

The DOI matches its Crossref record; 1 of the 1 references it cites were found in a registry or an index.
Warmer temperature accelerates senescence by modifying the aging-dependent changes in the mosquito transcriptome, altering immunity, metabolism, and DNA repair
Open accessPreprint — published as 10.1186/s12979-025-00551-7 · Paper page
Abstract
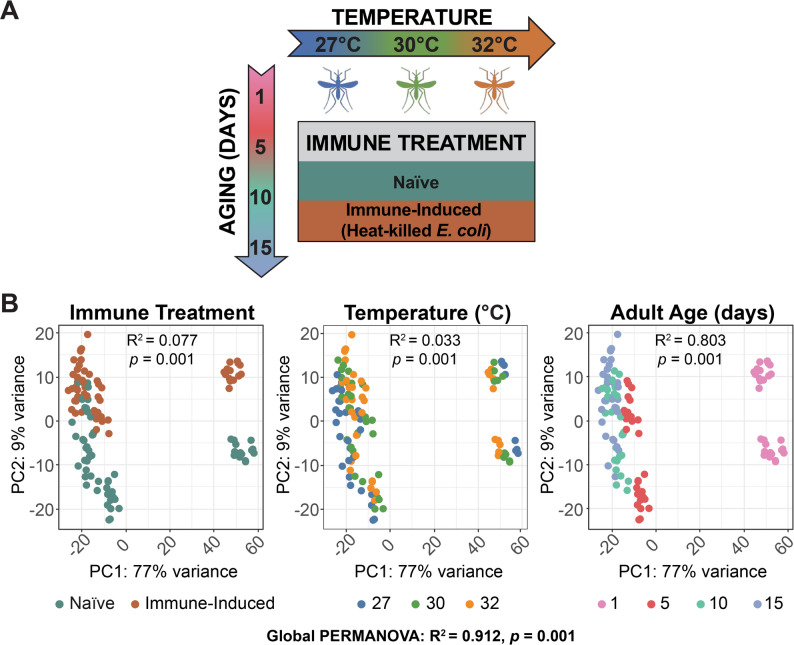
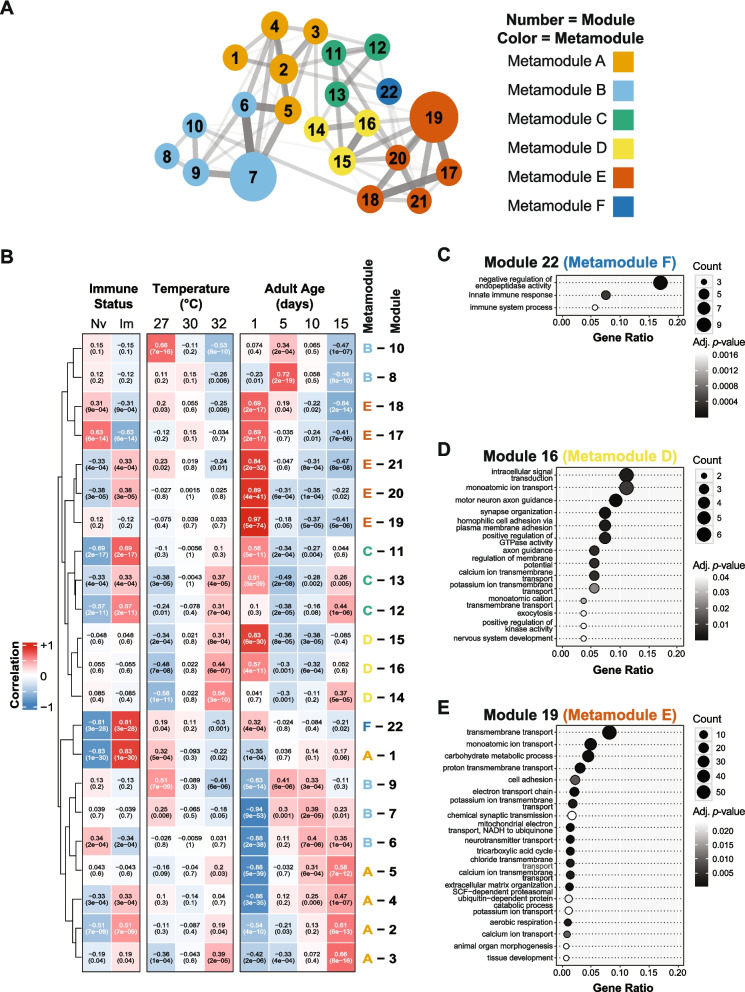
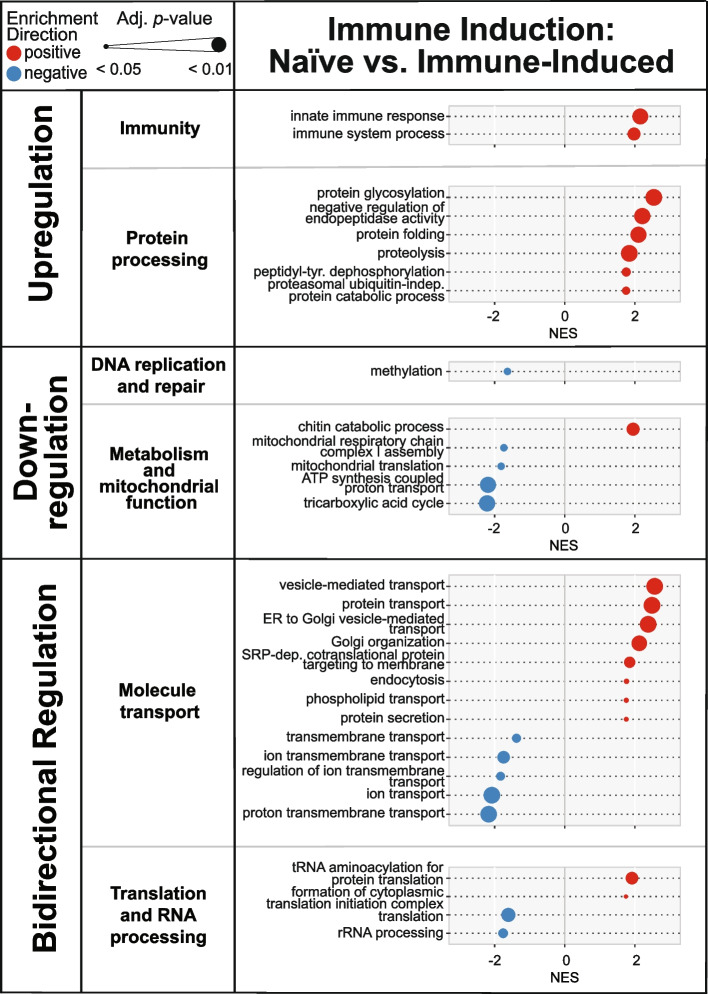
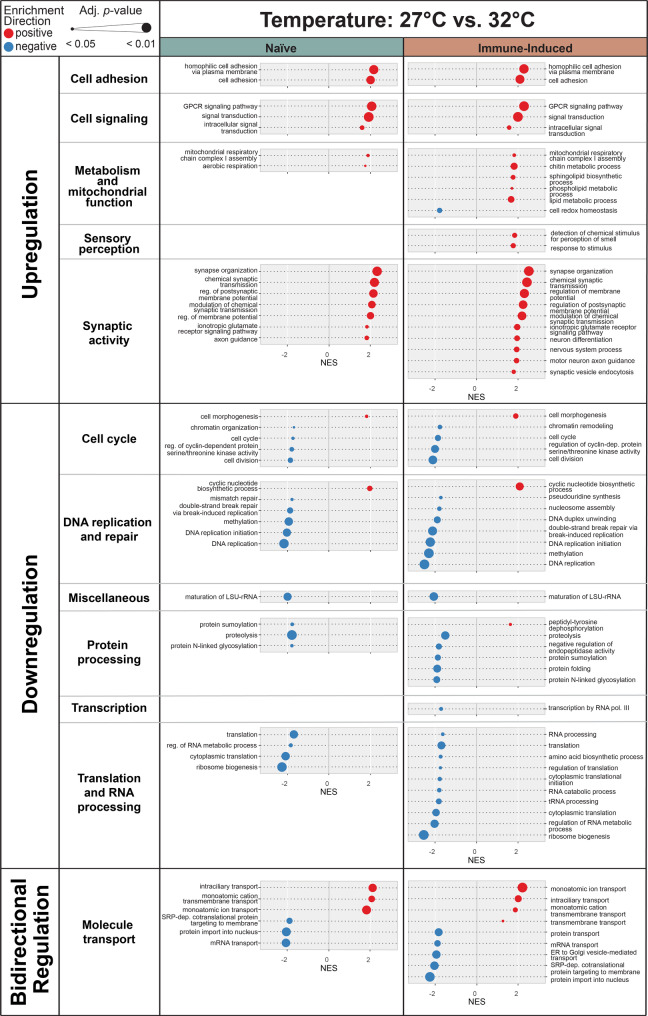
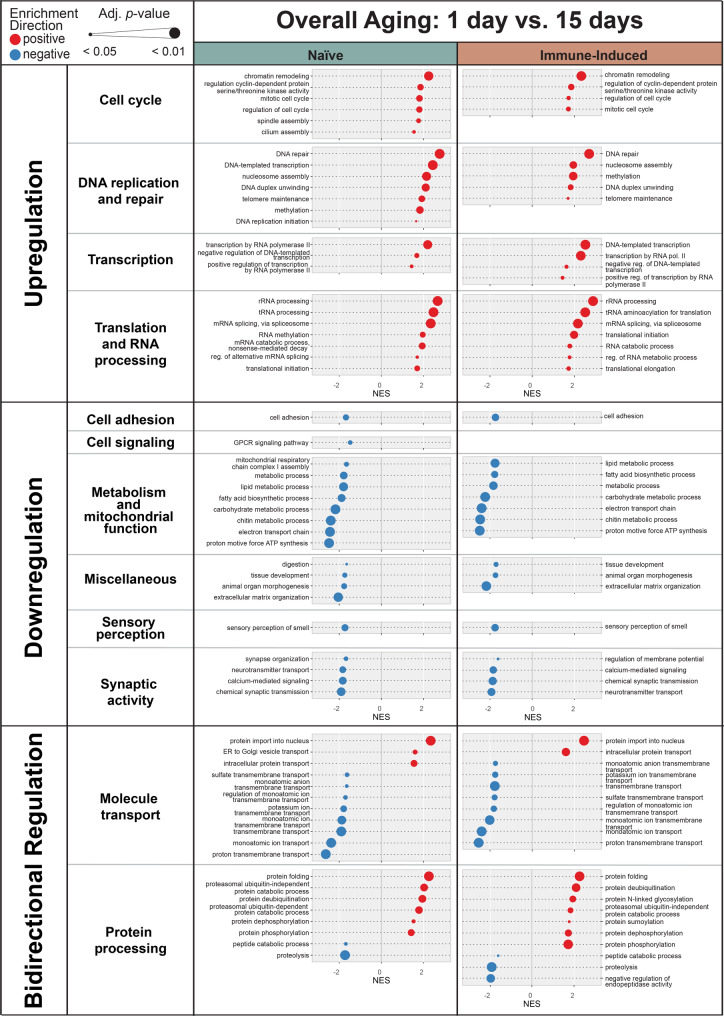
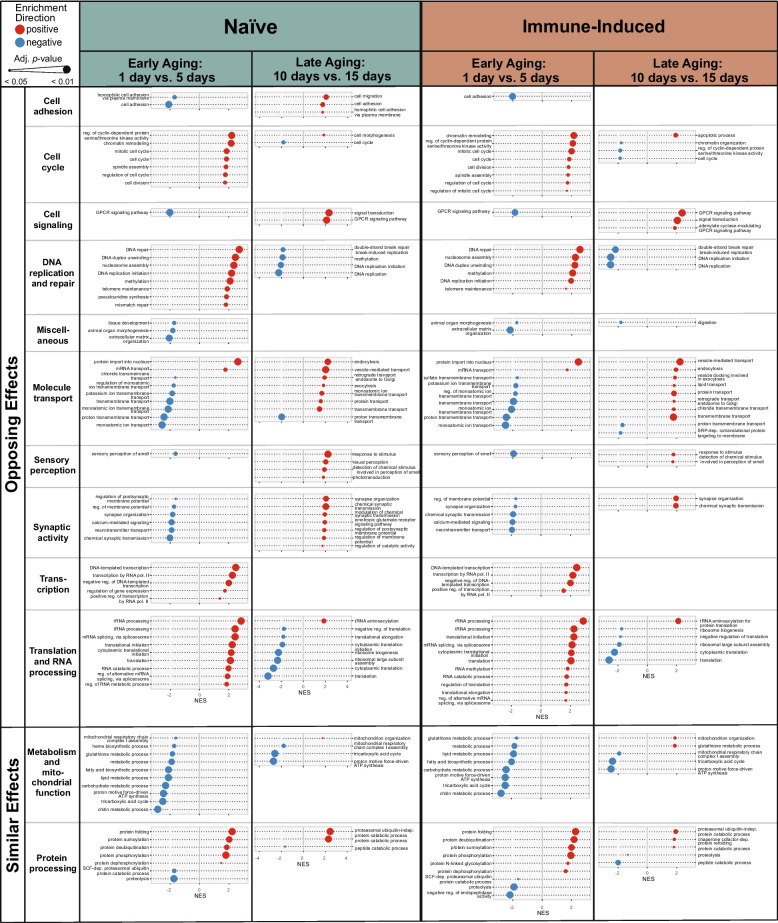
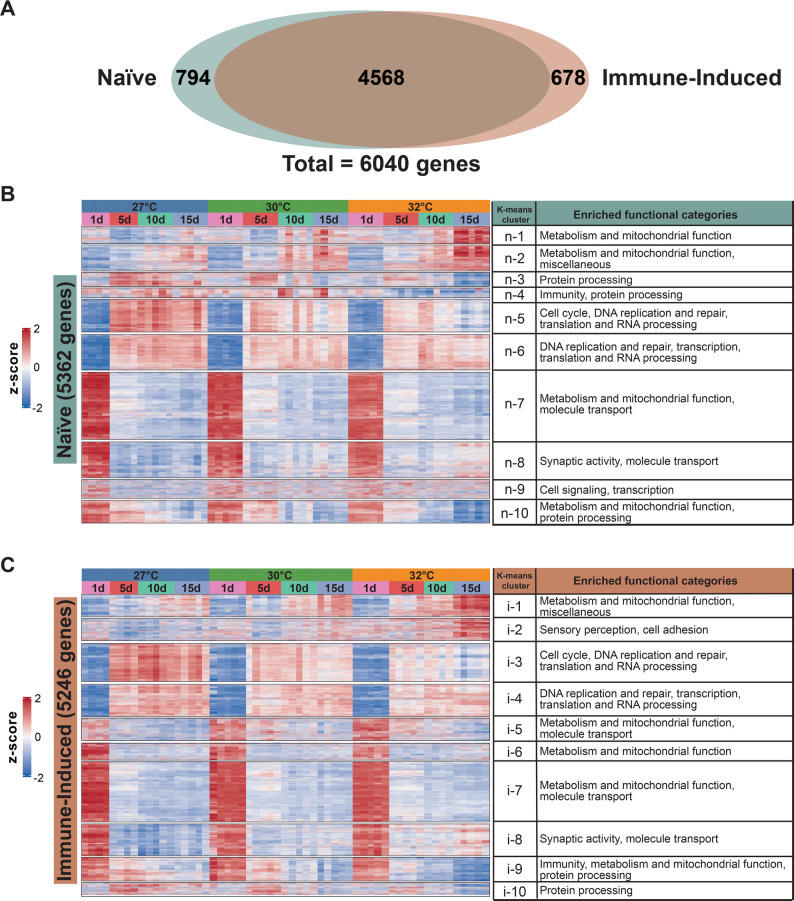
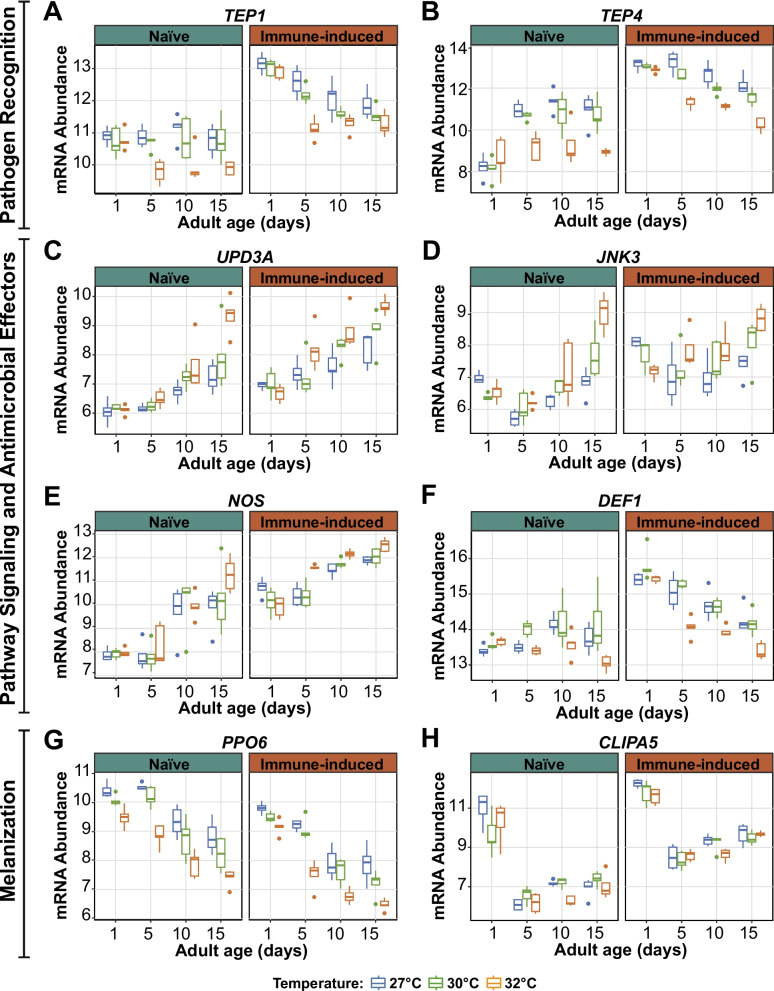
Background: Global environmental temperatures are rising, which is increasing the body temperature of mosquitoes. This increase in body temperature is accelerating senescence, thereby weakening immune responses and reproductive processes, and shortening lifespan. To determine how warmer temperature and aging, individually and interactively, shape the transcriptome of the African malaria mosquito, Anopheles gambiae , we conducted RNA-sequencing and network-analysis in naive and immune-induced mosquitoes that had been reared at 27C, 30C or 32C and were 1, 5, 10 or 15 days into adulthood. Results: We demonstrate that immune induction, warmer temperature, and aging alter the transcriptome. Notably, the transcriptome of 1-day-old mosquitoes is pronouncedly different from older mosquitoes, and importantly, warmer temperature modifies the aging-dependent changes to accelerate senescence. For example, warmer temperature amplifies the aging-dependent decrease in immune gene expression but dampens both the aging-dependent decrease in metabolic gene expression and the aging-dependent increase in DNA repair gene expression. Conclusions: Altogether, warmer temperature accelerates senescence, shaping the transcriptome in ways that alter the mosquitos ability to fight infection and survive in a warming environment.
Overview
The claims and statistics of this paper haven’t been checked yet.
Run the check — free, no account needed. It reads the open-access text and checks the sources it cites.
Integrity signals
Registry
Cites
Statistics
Figures
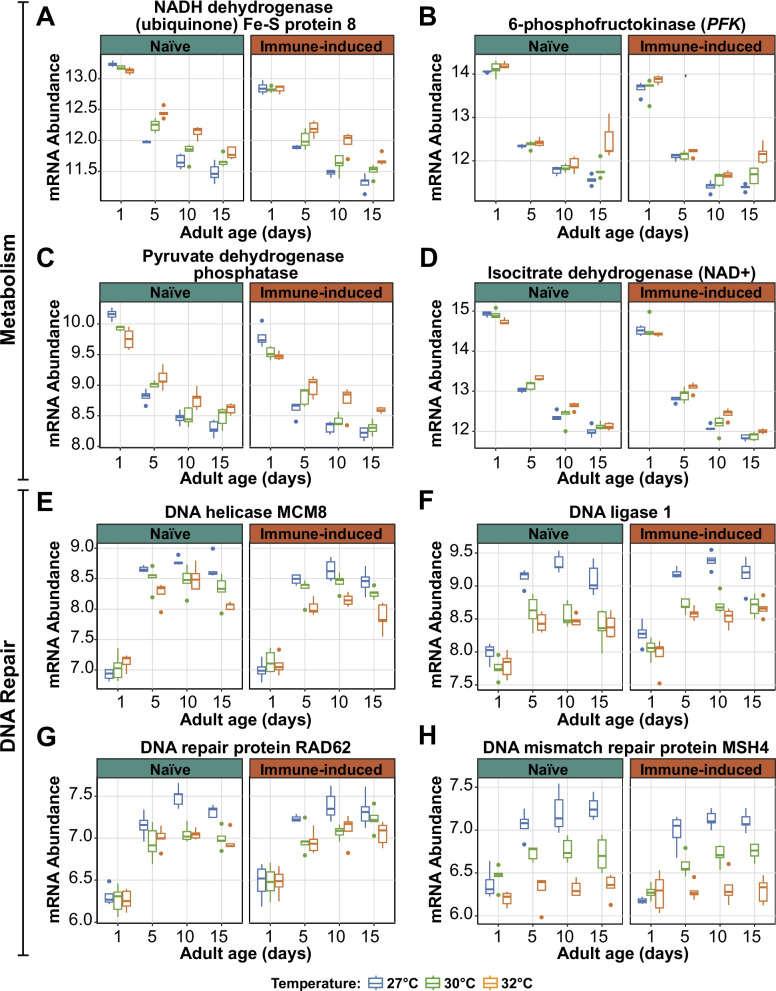
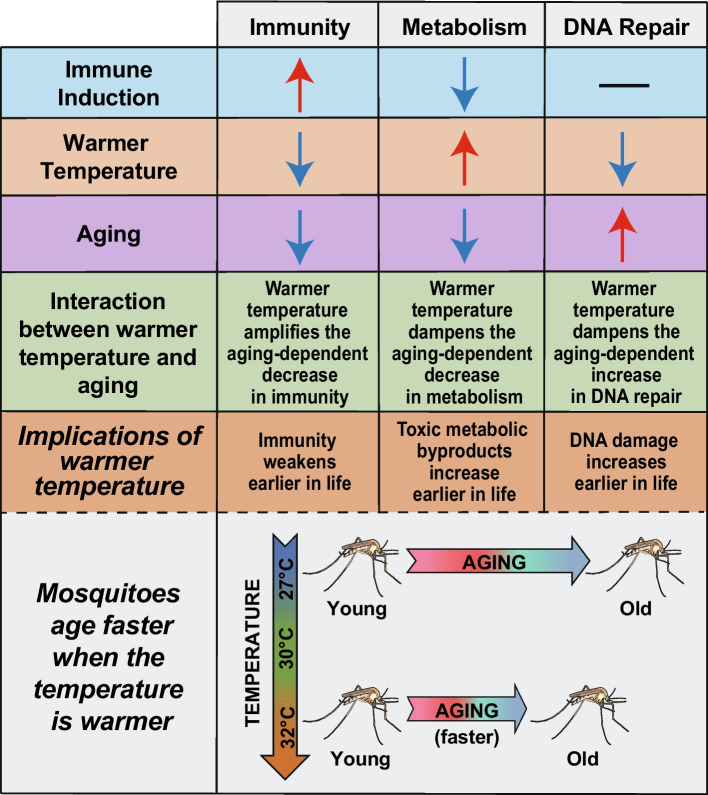
Verification
Claims the paper makes
The claims and statistics of this paper haven’t been checked yet.
Run the check — free, no account needed. It reads the open-access text and checks the sources it cites.
Self-check
Percentages, sums and reported differences re-computed from the paper’s own numbers.
The self-check needs the paper’s full text.
Citations
Cites
The central role of DNA damage in the ageing process
Schumacher, B., Pothof, J., Vijg, J., & Hoeijmakers, J. H. J. (2021) · Nature · doi:10.1038/s41586-021-03307-7 · Cited by 907
Research works printed but not linked: 136
- 2023, Temperature and age, individually and interactively, shape the size, weight, and body composition of adult female mosquitoes, J Insect Physiol, 148, 104525, 10.1016/j.jinsphys.2023.104525 · DOI
- 10.1016/S0925-5214(00)00169-1 · DOI
- 10.1086/648567 · DOI
- 2022, Effects of elevated temperatures on the growth and development of adult Anopheles gambiae (s.l, Diptera: Culicidae) mosquitoes. J Med Entomol, 59, 1413
- 2022, Effects of elevated temperatures on the development of immature stages of Anopheles gambiae (s.l.) mosquitoes, Trop Med Int Health, 27, 338, 10.1111/tmi.13732 · DOI
- 10.1603/ME13003 · DOI
- 10.1186/s13071-019-3303-4 · DOI
- 10.1590/S0085-56262010000300021 · DOI
- 10.1186/s12979-024-00465-w · DOI
- 10.3390/ijerph18147255 · DOI · Paper page
- 2021, The effect of resource limitation on the temperature dependence of mosquito population fitness, Proc R Soc Lond B Biol Sci, 288, 20203217
- 10.1371/journal.ppat.1011935 · DOI
- 10.1098/rspb.2012.0638 · DOI
- 10.1111/ele.13335 · DOI
- 2020, Effects of temperature on lifespan of Drosophila melanogaster from different genetic backgrounds: Links between metabolic rate and longevity, Insects, 11, 470, 10.3390/insects11080470 · DOI
- 10.1098/rsob.200246 · DOI
- 10.3389/fmicb.2020.00901 · DOI
- 2025, Thermal variation influences the transcriptome of the major malaria vector Anopheles stephensi, Commun Biol, 8, 112
- 10.1038/s41467-021-21496-7 · DOI
- 2012, Warmer temperatures reduce the vectorial capacity of malaria mosquitoes, Biol Letters, 8, 465, 10.1098/rsbl.2011.1075 · DOI
- 10.1371/journal.pbio.2003489 · DOI · Paper page
- Ryan SJ , Ben-Horin T , Johnson LR . Malaria control and senescence: The importance of accounting for the pace and shape of aging in wild mosquitoes. Ecosphere. 2015;6(9):art170. · DOI
- 2007, Mosquitoes do senesce: Departure from the paradigm of constant mortality, Am J Trop Med Hyg, 76, 111, 10.4269/ajtmh.2007.76.111 · DOI
- 2020, Senescence in wild insects: Key questions and challenges, Funct Ecol, 34, 26, 10.1111/1365-2435.13399 · DOI
- 10.1111/j.1462-5822.2004.00430.x · DOI
- 10.2307/3281593 · DOI
- 10.1006/jipa.1995.1054 · DOI
- 2024, Mosquito ageing modulates the development, virulence and transmission potential of pathogens, Proc R Soc Lond B Biol Sci, 291, 20232097
- 10.1016/0022-2011(92)90095-L · DOI
- 2023, The effects of female age on blood-feeding, insemination, sperm storage, and fertility in the dengue vector mosquito Aedes aegypti (Diptera: Culicidae), J Insect Physiol, 150, 104570, 10.1016/j.jinsphys.2023.104570 · DOI
- 10.1371/journal.pone.0200766 · DOI
- 10.1111/j.1948-7134.2009.00024.x · DOI
- 10.1603/0022-2585(2008)45[307:ASOTDV]2.0.CO;2 · DOI
- 10.3390/ijerph120605975 · DOI
- 2021, Transcriptome profiles of Anopheles gambiae harboring natural low-level Plasmodium infection reveal adaptive advantages for the mosquito, Sci Rep, 11, 22578, 10.1038/s41598-021-01842-x · DOI
- 10.1111/j.1365-2583.2006.00610.x · DOI
- 10.1073/pnas.0604875103 · DOI
- 10.1371/journal.pone.0013359 · DOI
- 10.1186/s13071-017-2302-6 · DOI
- 10.1016/j.jinsphys.2017.06.013 · DOI
- 10.1242/jeb.225821 · DOI
- 2024, Senescence of humoral antimicrobial immunity occurs in infected mosquitoes when the temperature is higher, J Exp Biol, 227, jeb248149
- 2025, Warmer temperature accelerates reproductive senescence in mosquitoes, Front Physiol, 16, 1610310, 10.3389/fphys.2025.1610310 · DOI
- 2025, Cellular immune senescence in mosquitoes accelerates when the temperature is warmer, Dev Comp Immunol, 168, 105396, 10.1016/j.dci.2025.105396 · DOI
- 2026, When a mosquito ingests blood, the phagocytic activity of hemocytes increases with warmer environmental temperature and aging, J Invertebr Pathol, 214, 108459, 10.1016/j.jip.2025.108459 · DOI
- 2025, Warmer temperature accelerates the aging-dependent decrease in female ovary size, delays male accessory gland development, and accelerates aging-dependent changes in reproductive gene expression in Anopheles gambiae mosquitoes, Insects, 16, 921, 10.3390/insects16090921 · DOI
- 10.1371/journal.pmed.1000209 · DOI
- Pörtner HO , Roberts DC , Tignor M , Poloczanska ES , Mintenbeck K , Alegría A , et al. IPCC, 2022: Climate Change 2022: Impacts, Adaptation, and Vulnerability. Contribution of Working Group II to the Sixth Assessment Report of the Intergovernmental Panel on Climate Change. Cambridge, UK and New York, USA: Cambridge University Press; 2022.
- 2017, Malaria, Nat Rev Dis Primers, 3, 17050, 10.1038/nrdp.2017.50 · DOI
- 2024, The transcriptional response in mosquitoes distinguishes between fungi and bacteria but not Gram types, BMC Genomics, 25, 353, 10.1186/s12864-024-10153-0 · DOI
- 10.1098/rspb.2017.0727 · DOI
- 10.1093/nar/30.1.207 · DOI · Paper page
- 10.1093/bioinformatics/bts635 · DOI · Paper page
- Dobin A , Gingeras TR . Mapping RNA-seq reads with STAR. Curr Protoc Bioinformatics. 2015;51(1):11.4.1-.4.9. · DOI
- 10.1186/s13059-014-0550-8 · DOI · Paper page
- 10.1073/pnas.0914005107 · DOI
- 10.2307/1268249 · DOI
- Greenfest-Allen E , Cartailler J-P , Magnuson MA , Stoeckert CJ . iterativeWGCNA: Iterative refinement to improve module detection from WGCNA co-expression networks. 2017. · DOI
- 10.1186/1471-2105-9-559 · DOI · Paper page
- 10.1186/1471-2164-10-327 · DOI · Paper page
- 10.1089/omi.2011.0118 · DOI · Paper page
- 10.1111/j.2517-6161.1995.tb02031.x · DOI · Paper page
- 10.1371/journal.pone.0021800 · DOI · Paper page
- 10.1093/bioinformatics/btt632 · DOI
- 10.1034/j.1600-0706.2000.880110.x · DOI
- 2018, Immune–metabolic interactions during systemic and enteric infection in Drosophila, Curr Opin Insect Sci, 29, 21, 10.1016/j.cois.2018.05.014 · DOI
- 10.1016/j.micinf.2013.11.010 · DOI
- Alonzo SH , Kindsvater HK . Life-history patterns. In: Jørgensen SE , Fath BD , editors. Encyclopedia of ecology. Oxford: Academic Press; 2008. p. 2175–80. · DOI
- 10.1016/j.anbehav.2011.01.008 · DOI
- 10.1046/j.1365-2540.2000.00685.x · DOI
- 2018, Role of temperature on growth and metabolic rate in the tenebrionid beetles Alphitobius diaperinus and Tenebrio molitor, J Insect Physiol, 107, 89, 10.1016/j.jinsphys.2018.02.010 · DOI
- 2023, Effects of temperature on metabolic rate during metamorphosis in the alfalfa leafcutting bee, Biol Open, 12, bio060213, 10.1242/bio.060213 · DOI
- 10.1093/nar/30.6.1354 · DOI
- 10.1186/s13014-015-0462-0 · DOI
- 10.32607/20758251-2016-8-2-75-78 · DOI
- 10.1002/jcp.24302 · DOI
- 10.1242/jeb.213744 · DOI
- 10.1016/j.arr.2005.04.001 · DOI
- 2018, Deficiency in DNA damage response of enterocytes accelerates intestinal stem cell aging in Drosophila, Aging, 10, 322, 10.18632/aging.101390 · DOI
- 10.1038/srep15299 · DOI · Paper page
- 2019, DNA damage response and repair in perspective: Aedes aegypti, Drosophila melanogaster and Homo sapiens, Parasit Vectors, 12, 533, 10.1186/s13071-019-3792-1 · DOI
- 10.1146/annurev-ento-061621-064341 · DOI
- 10.1111/acel.12556 · DOI
- 10.1016/j.cell.2005.01.028 · DOI · Paper page
- 10.7554/eLife.62852 · DOI · Paper page
- 10.1093/nar/gkm756 · DOI · Paper page
- Brunet-Rossinni AK , Austad SN . Senescence in wild populations of mammals and birds. In: Masoro EJ , Austad SN , editors. Handbook of the biology of aging. Sixth ed. Burlington: Academic Press; 2005. p. 243–66. · DOI
- 2012, Aging and immunosenescence in invertebrates, Invert Surviv J, 9, 102
- 2009, Understanding insect life histories and senescence through a resource allocation lens, Funct Ecol, 23, 27, 10.1111/j.1365-2435.2009.01527.x · DOI
- 10.1016/j.jprot.2015.06.008 · DOI
- 2017, How micronutrients influence the physiology of mosquitoes, Curr Opin Insect Sci, 23, 112, 10.1016/j.cois.2017.07.002 · DOI
- 10.1242/jeb.069468 · DOI
- 10.1371/journal.pntd.0008915 · DOI
- 10.1016/0022-1910(90)90118-Y · DOI
- 10.1073/pnas.0704967104 · DOI
- 10.1016/j.chom.2009.01.005 · DOI
- 10.1371/journal.ppat.1002737 · DOI
- 10.1016/S0092-8674(01)00267-7 · DOI
- 10.1371/journal.ppat.1002023 · DOI
- 10.1126/science.1171400 · DOI
- 10.1016/j.ibmb.2019.01.007 · DOI
- 10.1073/pnas.0905006106 · DOI
- 10.1371/journal.pntd.0001317 · DOI
- 10.1016/j.chom.2009.04.003 · DOI
- 10.1016/j.jmb.2013.10.006 · DOI
- 2022, The immune deficiency and c-Jun N-terminal kinase pathways drive the functional integration of the immune and circulatory systems of mosquitoes, Open Biol, 12, 220111, 10.1098/rsob.220111 · DOI
- 10.1371/journal.ppat.1003622 · DOI
- 10.1073/pnas.1423586112 · DOI
- 10.1016/j.pt.2005.02.007 · DOI
- 2021, The fungus Leptosphaerulina persists in Anopheles gambiae and induces melanization, PLoS One, 16, e0246452, 10.1371/journal.pone.0246452 · DOI
- 10.1074/jbc.274.17.11727 · DOI
- 10.1111/j.1462-5822.2006.00718.x · DOI
- 1973, Studies of a halophilic NADH dehydrogenase: I. Purification and properties of the enzyme, Biochim Biophys Acta, 302, 216, 10.1016/0005-2744(73)90150-2 · DOI
- 2014, Identification and transcription profiling of NDUFS8 in Aedes taeniorhynchus (Diptera: Culicidae): Developmental regulation and environmental response, Open Access Insect Physiol, 5, 1
- 1991, McAlister-Henn L. NAD(+)-dependent isocitrate dehydrogenase. Cloning, nucleotide sequence, and disruption of the IDH2 gene from Saccharomyces cerevisiae, J Biol Chem, 266, 22199, 10.1016/S0021-9258(18)54554-3 · DOI
- 10.1007/978-94-007-4572-8_17 · DOI
- 10.1038/s41467-020-16718-3 · DOI
- 2015, Understanding the DNA damage response in order to achieve desired gene editing outcomes in mosquitoes, Chromosome Res, 23, 31, 10.1007/s10577-014-9450-8 · DOI
- 10.3181/00379727-176-41867 · DOI
- Hansen IA , Attardo GM , Rodriguez SD , Drake LL . Four-way regulation of mosquito yolk protein precursor genes by juvenile hormone-, ecdysone-, nutrient-, and insulin-like peptide signaling pathways. Front Physiol. 2014;5:103. · DOI
- 2005, Reproductive physiology of Anopheles gambiae and Anopheles atroparvus, J Vector Ecol, 30, 11
- 2021, Use of transcriptional age grading technique to determine the chronological age of Sri Lankan Aedes aegypti and Aedes albopictus females, Parasit Vectors, 14, 493, 10.1186/s13071-021-04994-x · DOI
- 10.1126/sciadv.adr0616 · DOI
- 10.1016/0047-6374(76)90034-8 · DOI
- 10.1073/pnas.96.20.11399 · DOI
- 10.1007/s10522-015-9571-2 · DOI
- 10.1146/annurev-ento-041520-074454 · DOI
- 10.1074/jbc.M707700200 · DOI
- 2017, The roles of history: age and prior exploitation in aquatic container habitats have immediate and carry-over effects on mosquito life history, Ecol Entomol, 42, 704, 10.1111/een.12436 · DOI
- 2023, Nutritional stress compromises mosquito fitness and antiviral immunity, while enhancing dengue virus infection susceptibility, Commun Biol, 6, 1123, 10.1038/s42003-023-05516-4 · DOI
- 10.1002/ece3.5192 · DOI
- 10.1016/j.jip.2017.10.008 · DOI
- 10.1038/srep36778 · DOI
- 10.1603/0022-2585-37.5.732 · DOI
- 2023, Larval diet and temperature alter mosquito immunity and development: using body size and developmental traits to track carry-over effects on longevity, Parasit Vectors, 16, 434, 10.1186/s13071-023-06037-z · DOI
- 2011, Effects of different temperature regimens on the development of Aedes aegypti (L, Diptera: Culicidae) mosquitoes. Acta Trop, 119, 38
Metadata
- Authors
- Martin, L. E., Barr, J. S., Cartailler, J.-P., Shrestha, S., Estévez-Lao, T. Y., & Hillyer, J. F.
- Affiliations
- Vanderbilt University (US)
- Corresponding author
- Hillyer, Julián F.
- ORCID
- Venue
- Immunity & Ageing
- Publisher
- openRxiv
- Published
- 2025-10-27
- Volume
- 23
- Issue
- 1
- Pages
- 1-1
- ISSN
- 1742-4933 (ISSN-L)
- PMC
- PMC12781269
- OpenAlex
- W4417321364
- Cited by
- 3
- References
- 1
- Citations by year
- 2026: 3
- FWCI
- 0.95
- Type
- journal article
- Language
- en
- Open access
- gold
- doi.org
- Licence
- Locations
- Immunity & Ageing (publishedVersion, cc-by)
- bioRxiv (Cold Spring Harbor Laboratory) (acceptedVersion, cc-by)
- PubMed (publishedVersion)
- PubMed Central (publishedVersion, cc-by)
- DOAJ (DOAJ: Directory of Open Access Journals) (submittedVersion, cc-by-sa)
- Funders
- U.S. National Science Foundation (1936843, Graduate Research Fellowship)
- Topics
- Life Sciences › Biochemistry, Genetics and Molecular Biology › Aging › Genetics, Aging, and Longevity in Model Organisms
- Life Sciences › Immunology and Microbiology › Immunology › Invertebrate Immune Response Mechanisms
- Physical Sciences › Environmental Science › Ecology › Physiological and biochemical adaptations
- Keywords
- Anopheles gambiae, aging, high temperature, transcriptome, immune gene expression, metabolic gene expression, DNA repair, immune induction, climate change, malaria vectors, lifespan
About these checks
Registry, retraction, Cites and statistics results are computed, not judged, with one exception: a printed reference that no index lists is read once by a model before it counts as a citation error. Claims are extracted by a model and kept only when their quote appears verbatim in the text; each cited source is then checked, with a model’s help, for whether it says what the claim relies on. Those verdicts can be wrong — read the claim’s quote and the cited source before relying on one.
Statistics and arithmetic are recomputed, not judged.
Confidence bands are shown only for fields calibrated on our annotated test set. None is calibrated yet, so no band is shown.
What counts as a claim ›How we measure confidence ›How we check this ›
Are you an author, or do you see a problem with this page? Request a review
