

Resolving cellular systems by ultra-sensitive and economical single-cell transcriptome filtering
Open accessPreprint — published as 10.1016/j.isci.2021.102147
The DOI matches its Crossref record; 27 of the 27 references it cites were found in a registry or an index.
Abstract
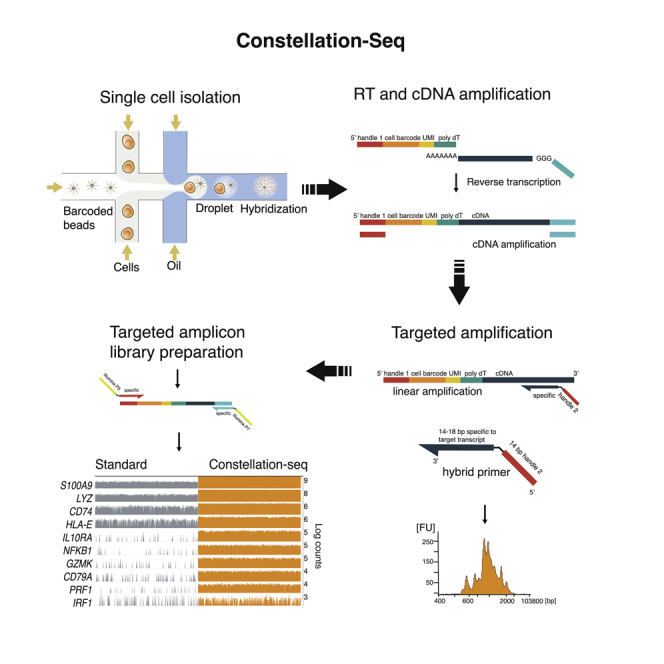
Single-cell transcriptomics has sensitivity limits that restrict low abundance transcript identification, affects clustering and introduce artefact. Here, we describe Constellation DropSeq (C-DropSeq), a molecular transcriptome filter that delivers two orders of magnitude sensitivity gains by maximising read utility while reducing sequencing depth and costs. The simple and powerful method is broadly compatible with library preparation routines and was demonstrated by identifying and characterizing the activation of rare dendritic cell sub-populations.
Overview
The claims and statistics of this paper haven’t been checked yet.
Free: it reads the open-access text and checks the first 5 claims that cite a source we can check. Create a free account to check every claim.
Integrity signals
Registry
Cites
Statistics
Figures


Verification
Claims the paper makes
The claims and statistics of this paper haven’t been checked yet.
Free: it reads the open-access text and checks the first 5 claims that cite a source we can check. Create a free account to check every claim.
Claims other papers make about this one
Each is checked against this paper’s own text: does it say what the citing paper says it does?
The cited source says what the claim attributes to it.
In the citing paper
“Diverse approaches exist for enriching transcripts using multiplexed PCR34, custom RT beads35, or linear amplification36; however, each of these is limited by number of target genes, quality, and/or a priori gene selection.”
From Combinatorial single-cell CRISPR screens by direct guide RNA capture and targeted sequencing (2020) · cites this paper as [36]
In the citing paper
“Unlike previous high-throughput27–29 and low-throughput30 targeted single-cell RNA-seq methods, its modular design ensures platform-independent, robust genetic screens.”
From Targeted Perturb-seq enables genome-scale genetic screens in single cells (2020) · cites this paper as [29]
Self-check
Percentages, sums and reported differences re-computed from the paper’s own numbers.
The self-check needs the paper’s full text.
Citations
Cites
SCANPY: large-scale single-cell gene expression data analysis
Wolf, F. A., Angerer, P., & Theis, F. J. (2018) · Genome Biology · doi:10.1186/s13059-017-1382-0 · Cited by 8,881
Highly parallel genome-wide expression profiling of individual cells using nanoliter droplets.
Macosko, E. Z., Basu, A., Satija, R., Nemesh, J., Shekhar, K., Goldman, M., Tirosh, I., Bialas, A. R., Kamitaki, N., Martersteck, E. M., et al. (2015) · Cell · doi:10.1016/j.cell.2015.05.002 · Cited by 7,110
From Louvain to Leiden: guaranteeing well-connected communities
Traag, V. A., Waltman, L., & van Eck, N. J. (2019) · Scientific Reports · doi:10.1038/s41598-019-41695-z · Cited by 5,635
Single-cell RNA-seq reveals new types of human blood dendritic cells, monocytes, and progenitors
Villani, A.-C., Satija, R., Reynolds, G., Sarkizova, S., Shekhar, K., Fletcher, J., Griesbeck, M., Butler, A., Zheng, S., Lazo, S., et al. (2017) · Science · doi:10.1126/science.aah4573 · Cited by 2,413
Comparative Analysis of Single-Cell RNA Sequencing Methods
Ziegenhain, C., Vieth, B., Parekh, S., Reinius, B., Guillaumet-Adkins, A., Smets, M., Leonhardt, H., Heyn, H., Hellmann, I., & Enard, W. (2017) · Molecular Cell · doi:10.1016/j.molcel.2017.01.023 · Cited by 1,494
Eleven grand challenges in single-cell data science
Lähnemann, D., Köster, J., Szczurek, E., McCarthy, D. J., Hicks, S. C., Robinson, M. D., Vallejos, C. A., Campbell, K. R., Beerenwinkel, N., Mahfouz, A., et al. (2020) · Genome Biology · doi:10.1186/s13059-020-1926-6 · Cited by 1,327
Producing polished prokaryotic pangenomes with the Panaroo pipeline
Tonkin-Hill, G., MacAlasdair, N., Ruis, C., Weimann, A., Horesh, G., Lees, J. A., Gladstone, R. A., Lo, S., Beaudoin, C., Floto, R. A., et al. (2020) · Genome Biology · doi:10.1186/s13059-020-02090-4 · Cited by 1,320
CEL-seq: single-cell RNA-seq by multiplexed linear amplification
Hashimshony, T., Wagner, F., Sher, N., & Yanai, I. (2012) · Cell Reports · doi:10.1016/j.celrep.2012.08.003 · Cited by 1,231
Jamboree, P. I. T. 1. H. C. A., Lun, A. T. L., Riesenfeld, S., Andrews, T., Dao, T. P., Gomes, T., & Marioni, J. C. (2019) · Genome Biology · doi:10.1186/s13059-019-1662-y · Cited by 1,097
Haniffa, M., Shin, A., Bigley, V., McGovern, N., Teo, P., See, P., Wasan, P. S., Wang, X.-N., Malinarich, F., Malleret, B., et al. (2012) · Immunity · doi:10.1016/j.immuni.2012.04.012 · Cited by 724
Cited by
Combinatorial single-cell CRISPR screens by direct guide RNA capture and targeted sequencing
Replogle, J. M., Norman, T. M., Xu, A., Hussmann, J. A., Chen, J., Cogan, J. Z., Meer, E. J., Terry, J. M., Riordan, D. P., Srinivas, N., et al. (2020) · Nature Biotechnology · doi:10.1038/s41587-020-0470-y · Cited by 465
Targeted Perturb-seq enables genome-scale genetic screens in single cells
Schraivogel, D., Gschwind, A. R., Milbank, J. H., Leonce, D. R., Jakob, P., Mathur, L., Korbel, J. O., Merten, C. A., Velten, L., & Steinmetz, L. M. (2020) · Nature Methods · doi:10.1038/s41592-020-0837-5 · Cited by 245
Advances and Opportunities in Single-Cell Transcriptomics for Plant Research
Seyfferth, C., Renema, J., Wendrich, J. R., Eekhout, T., Seurinck, R., Vandamme, N., Blob, B., Saeys, Y., Helariutta, Y., Birnbaum, K. D., et al. (2021) · Annual Review of Plant Biology · doi:10.1146/annurev-arplant-081720-010120 · Cited by 215
Coexpression reveals conserved gene programs that co-vary with cell type across kingdoms
Crow, M., Suresh, H., Lee, J., & Gillis, J. (2022) · Nucleic Acids Research · doi:10.1093/nar/gkac276 · Cited by 36
HyPR-seq: Single-cell quantification of chosen RNAs via hybridization and sequencing of DNA probes
Marshall, J. L., Doughty, B. R., Subramanian, V., Guckelberger, P., Wang, Q. S., Chen, L. M., Rodriques, S. G., Zhang, K., Fulco, C. P., Nasser, J., et al. (2020) · Proceedings of the National Academy of Sciences · doi:10.1073/pnas.2010738117 · Cited by 39
Multiplex SERS Phenotyping of Single Cancer Cells in Microdroplets
Oliveira, K., Teixeira, A., Fernandes, J. M., Lopes, C., Chícharo, A., Piairo, P., Wu, L., Rodríguez‐Lorenzo, L., Diéguez, L., & Abalde‐Cela, S. (2022) · Advanced Optical Materials · doi:10.1002/adom.202201500 · Cited by 30
Ashton, J. J., Boukas, K., Davies, J., Stafford, I. S., Vallejo, A. F., Haggarty, R., Coelho, T. A. F., Batra, A., Afzal, N. A., Vadgama, B., et al. (2020) · Journal of Crohn s and Colitis · doi:10.1093/ecco-jcc/jjaa236 · Cited by 25
Self-citationEmerging Technologies for Understanding Platelet Diversity
Heemskerk, J. W. M., & West, J. J. (2022) · Arteriosclerosis Thrombosis and Vascular Biology · doi:10.1161/atvbaha.121.317092 · Cited by 18
Self-citationSirvent, S., Vallejo, A. F., Corden, E., Teo, Y. X., Davies, J., Clayton, K., Seaby, E. G., Lai, C., Ennis, S., Alyami, R., et al. (2023) · Nature Communications · doi:10.1038/s41467-023-38588-1 · Cited by 14
Self-citationA practical guide to targeted single-cell RNA sequencing technologies
Moro, G., Brunner, E., & Basler, K. (2026) · Communications Biology · doi:10.1038/s42003-026-09675-y · Cited by 13
Clayton, K., Holbrook, D. J., Vallejo, A. F., Porter, G., Sirvent, S., Davies, J., Pople, J., Lim, F.-L., Christodoulides, M., Polak, M. E., et al. (2022) · British Journal of Dermatology · doi:10.1093/bjd/ljac088 · Cited by 11
Self-citationMoro, G., Mallona, I., Barz, M., Maillard, J., Brügger, M. D., Fazilaty, H., Szabo, Q., Valenta, T., Handler, K., Kerlin, F., et al. (2025) · Nature Communications · doi:10.1038/s41467-025-66248-z · Cited by 6
A targeted sequencing extension for transcript genotyping in single-cell transcriptomics
Horebeek, L. V., David, M., Dedoncker, N., Mallants, K., Bijnens, B., Goris, A., & Dubois, B. (2023) · Life Science Alliance · doi:10.26508/lsa.202301971 · Cited by 4
Coexpression reveals conserved mechanisms of transcriptional cell identityPreprint
Crow, M., Suresh, H., Lee, J., & Gillis, J. A. (2020) · bioRxiv (Cold Spring Harbor Laboratory) · doi:10.1101/2020.11.10.375758 · Cited by 2
Chen, B., Gao, J., Sun, H., Liu, Y., Zhao, Y., & Qiu, X. (2025) · Methods · doi:10.1016/j.ymeth.2025.09.002 · Cited by 1
Sirvent, S., Vallejo, A. F., Corden, E., Teo, Y. X., Davies, J., Clayton, K., Seaby, E. G., Lai, C., Ennis, S., Alyami, R., et al. (2021) · medRxiv · doi:10.1101/2021.10.07.21264714 · Cited by 1
Self-citationYan, Y., & Wu, Z. (2026) · Briefings in Bioinformatics · doi:10.1093/bib/bbag024
Metadata
- Authors
- Vallejo, A. F., Davies, J., Grover, A., Tsai, C.-H., Jepras, R., Polak, M. E., & West, J.
- Affiliations
- University of Southampton (GB)
- GlaxoSmithKline (United Kingdom) (GB)
- GlaxoSmithKline (United States) (US)
- Corresponding author
- Polak, Marta E.
- West, Jonathan
- Venue
- iScience
- Publisher
- openRxiv
- Published
- 2019-10-10
- Volume
- 24
- Issue
- 3
- Pages
- 102147-102147
- ISSN
- 2589-0042 (ISSN-L)
- PMC
- PMC7900351
- OpenAlex
- W3128091223
- Cited by
- 17
- References
- 26
- Citations by year
- 2026: 2 · 2025: 2 · 2023: 2 · 2022: 4 · 2021: 2 · 2020: 5
- FWCI
- 0.63
- Type
- journal article
- Language
- en
- Open access
- gold
- doi.org
- Licence
- cc-by
- Locations
- iScience (publishedVersion, cc-by)
- bioRxiv (Cold Spring Harbor Laboratory) (acceptedVersion)
- PubMed Central (publishedVersion, cc-by)
- PubMed (publishedVersion)
- ePrints Soton (University of Southampton) (acceptedVersion)
- DOAJ (DOAJ: Directory of Open Access Journals) (submittedVersion, cc-by-sa)
- ePrints Soton (University of Southampton) (submittedVersion)
- Funders
- GlaxoSmithKline
- Wellcome Trust (109377/Z/15/Z, /Z/15/Z, 109377)
- University of Southampton
- Medical Research Council (MC_PC_15078)
- Topics
- Life Sciences › Biochemistry, Genetics and Molecular Biology › Molecular Biology › Single-cell and spatial transcriptomics
- Life Sciences › Biochemistry, Genetics and Molecular Biology › Molecular Biology › Genomics and Phylogenetic Studies
- Life Sciences › Biochemistry, Genetics and Molecular Biology › Molecular Biology › Gene expression and cancer classification
- Keywords
- single-cell transcriptomics, sequencing sensitivity, sequencing cost reduction, dendritic cells, peripheral blood mononuclear cells, gene expression profiling, marker validation
About these checks
Registry, retraction, Cites and statistics results are computed, not judged, with one exception: a printed reference that no index lists is read once by a model before it counts as a citation error. Claims are extracted by a model and kept only when their quote appears verbatim in the text; each cited source is then checked, with a model’s help, for whether it says what the claim relies on. Those verdicts can be wrong — read the claim’s quote and the cited source before relying on one.
Statistics and arithmetic are recomputed, not judged.
Confidence bands are shown only for fields calibrated on our annotated test set. None is calibrated yet, so no band is shown.
What counts as a claim ›How we measure confidence ›How we check this ›
Are you an author, or do you see a problem with this page? Request a review
Data sources
Bibliographic data: Semantic Scholar, OpenAlex, Crossref.
Contains information from the Semantic Scholar Academic Graph Datasets, made available under the ODC Attribution License (ODC-BY 1.0).
Semantic Scholar’s data is described in: Kinney, R., et al. (2023). The Semantic Scholar Open Data Platform. arXiv:2301.10140.
