

The DOI matches its Crossref record; 53 of the 53 references it cites were found in a registry or an index.
The discovery of integrated gene networks for autism and related disorders
Open accessAbstract
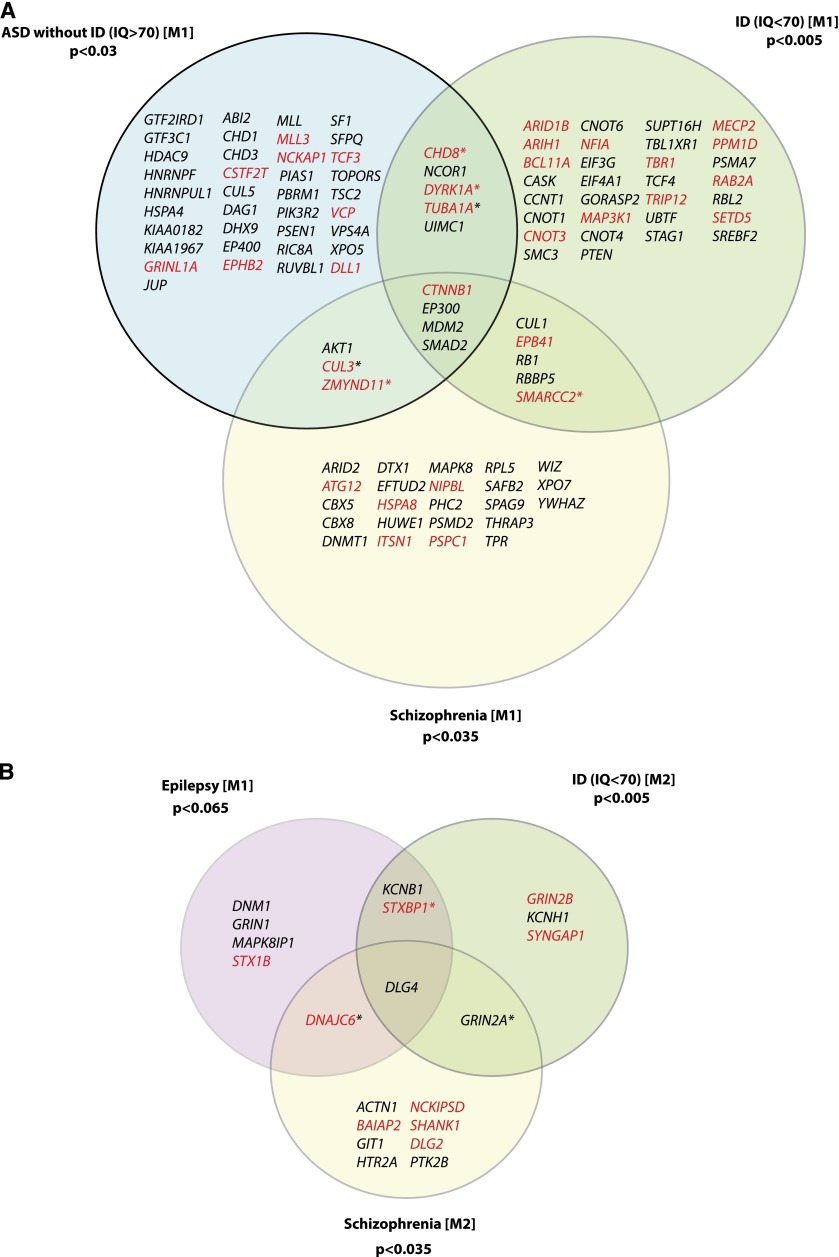
Despite considerable genetic heterogeneity underlying neurodevelopmental diseases, there is compelling evidence that many disease genes will map to a much smaller number of biological subnetworks. We developed a computational method, termed MAGI (m erging a ffected g enes into i ntegrated networks), that simultaneously integrates protein–protein interactions and RNA-seq expression profiles during brain development to discover “modules” enriched for de novo mutations in probands. We applied this method to recent exome sequencing of 1116 patients with autism and intellectual disability, discovering two distinct modules that differ in their properties and associated phenotypes. The first module consists of 80 genes associated with Wnt, Notch, SWI/SNF, and NCOR complexes and shows the highest expression early during embryonic development (8–16 post-conception weeks [pcw]). The second module consists of 24 genes associated with synaptic function, including long-term potentiation and calcium signaling with higher levels of postnatal expression. Patients with de novo mutations in these modules are more significantly intellectually impaired and carry more severe missense mutations when compared to probands with de novo mutations outside of these modules. We used our approach to define subsets of the network associated with higher functioning autism as well as greater severity with respect to IQ. Finally, we applied MAGI independently to epilepsy and schizophrenia exome sequencing cohorts and found significant overlap as well as expansion of these modules, suggesting a core set of integrated neurodevelopmental networks common to seemingly diverse human diseases.
Overview
The claims and statistics of this paper haven’t been checked yet.
Run the check — free, no account needed. It reads the open-access text and checks the sources it cites.
Integrity signals
Registry
Cites
Statistics
Figures
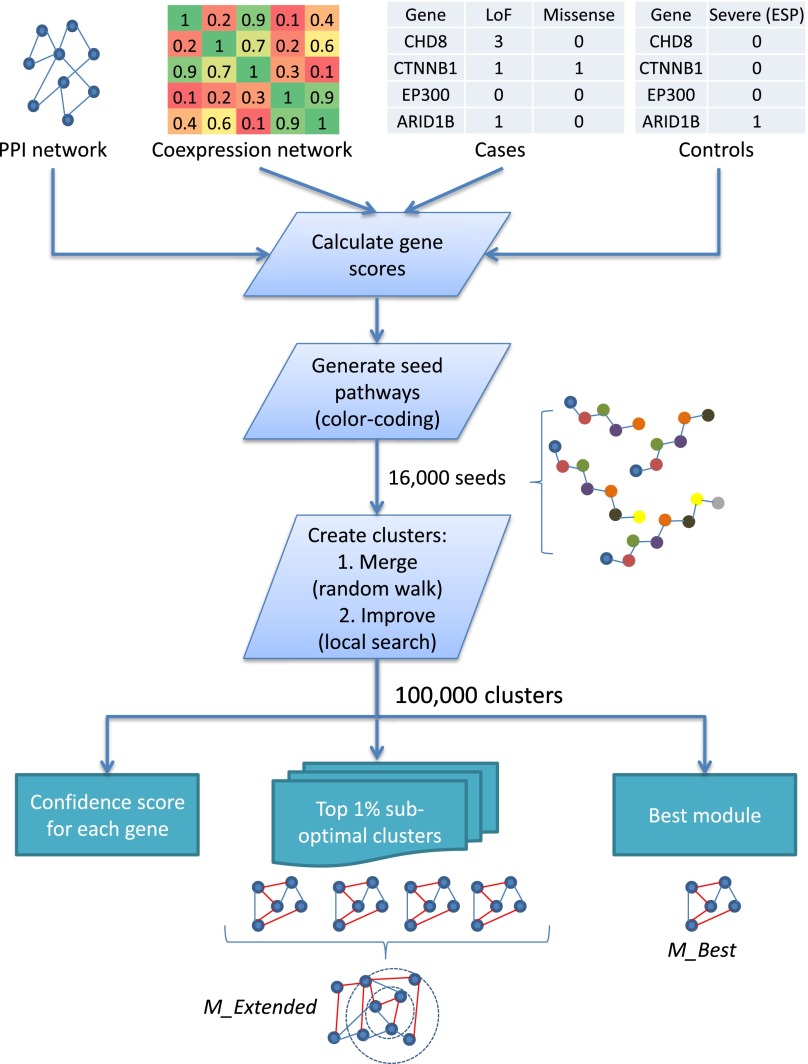
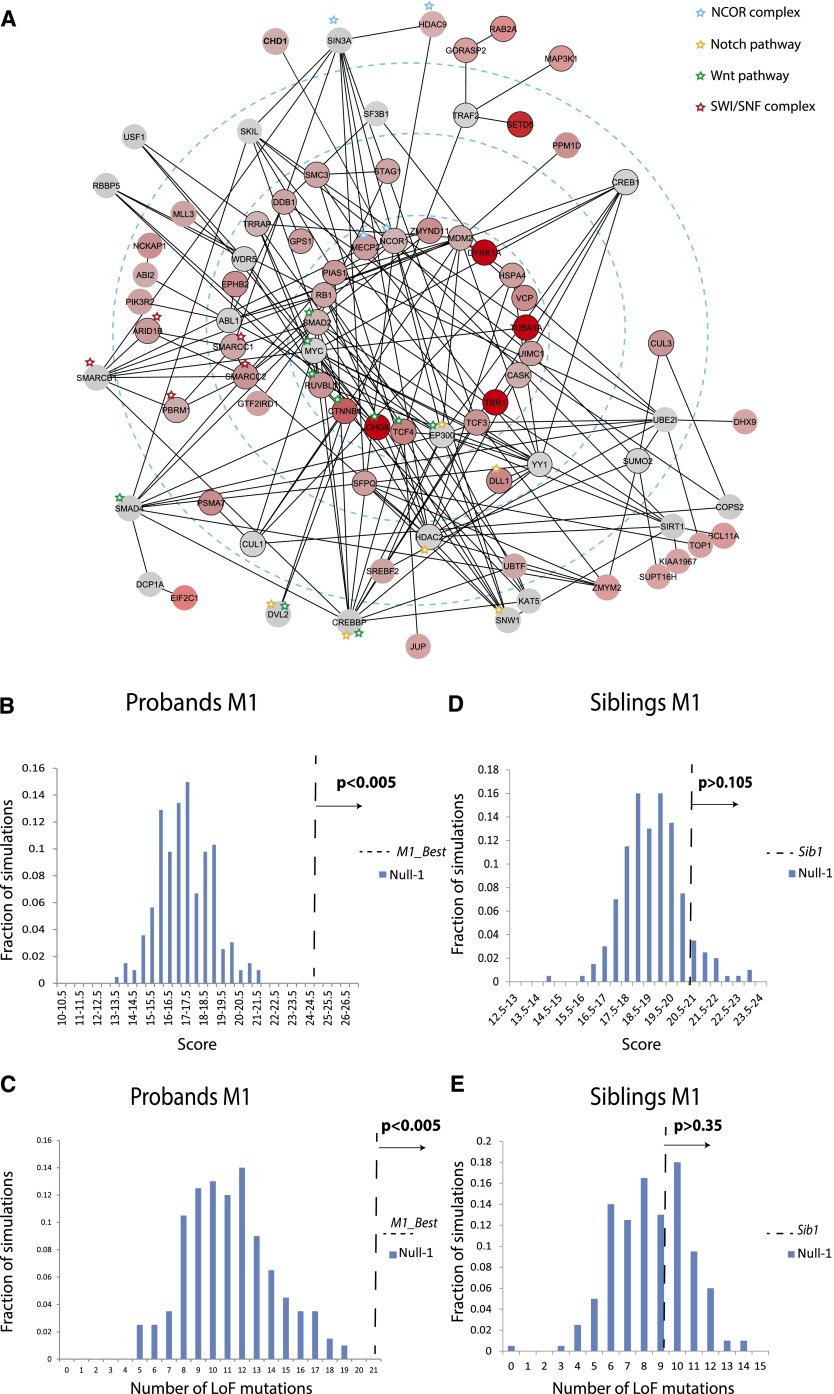
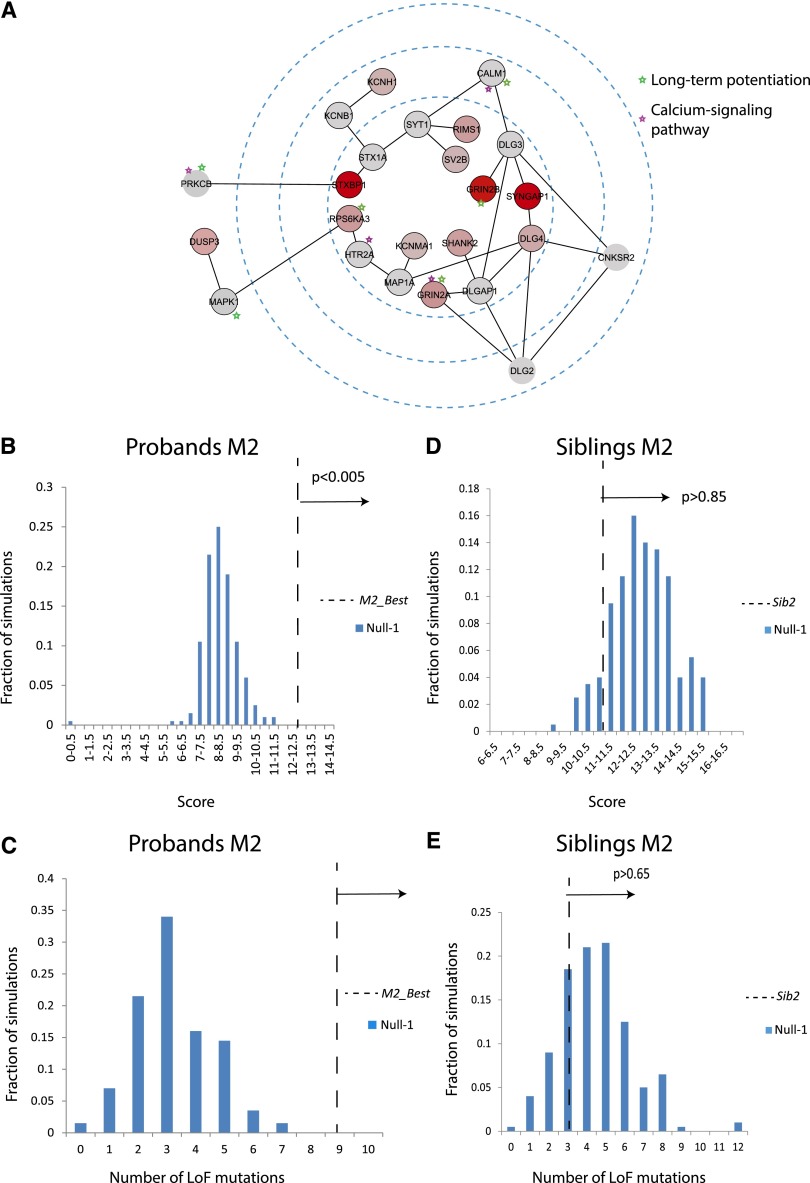
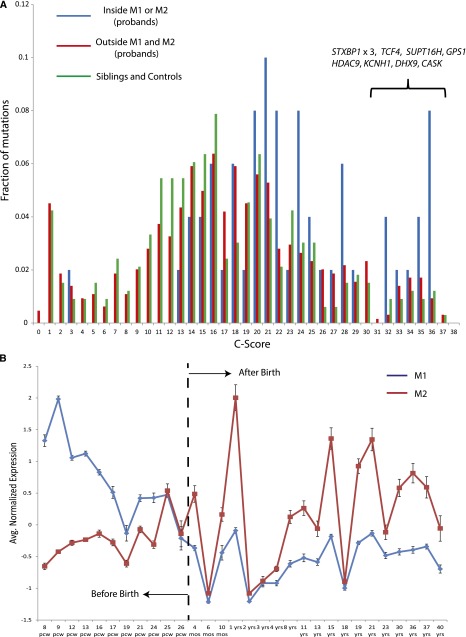
Verification
Claims the paper makes
The claims and statistics of this paper haven’t been checked yet.
Run the check — free, no account needed. It reads the open-access text and checks the sources it cites.
Claims other papers make about this one
Each is checked against this paper’s own text: does it say what the citing paper says it does?
The source backs part of the claim, not all of it — or backs it for a different population, condition or comparison.
In the citing paper
“M1 consists of 47 genes associated with Wnt, Notch, SWI/SNF, and NCOR signaling, and showing high expression during embryonic development (8–16 pcw) (Fig. 1, Supplementary Table S1).”
From Distinct selective forces and Neanderthal introgression shaped genetic diversity at genes involved in neurodevelopmental disorders (2017) · cites this paper as [29]
Experimental — accuracy not yet measuredThe source backs part of the claim, not all of it — or backs it for a different population, condition or comparison.
In the citing paper
“M2 includes 21 genes associated with synaptic function and mainly expressed at postnatal stages (Fig. 1, Supplementary Table S1).”
From Distinct selective forces and Neanderthal introgression shaped genetic diversity at genes involved in neurodevelopmental disorders (2017) · cites this paper as [29]
Experimental — accuracy not yet measuredThe source backs part of the claim, not all of it — or backs it for a different population, condition or comparison.
In the citing paper
“These modules were built through the exome sequencing data of 1116 patients affected by ASD and ID29.”
From Distinct selective forces and Neanderthal introgression shaped genetic diversity at genes involved in neurodevelopmental disorders (2017) · cites this paper as [29]
Experimental — accuracy not yet measuredThe source backs part of the claim, not all of it — or backs it for a different population, condition or comparison.
In the citing paper
“We focused in particular on 68 genes which, despite not being an exhaustive catalog of genetic risk loci for ASD and ID, were previously shown to represent functional modules enriched of de novo mutations in probands29.”
From Distinct selective forces and Neanderthal introgression shaped genetic diversity at genes involved in neurodevelopmental disorders (2017) · cites this paper as [29]
Experimental — accuracy not yet measuredThe cited source says what the claim attributes to it.
In the citing paper
“Module 1 includes genes associated to transcriptional regulation during brain development, whereas module 2 is composed of synaptic genes involved in long-term potentiation and calcium signaling29.”
From Distinct selective forces and Neanderthal introgression shaped genetic diversity at genes involved in neurodevelopmental disorders (2017) · cites this paper as [29]
The cited source says what the claim attributes to it.
In the citing paper
“Module 1 includes genes associated to transcriptional regulation during brain development, whereas module 2 is composed of synaptic genes involved in long-term potentiation and calcium signaling29.”
From Distinct selective forces and Neanderthal introgression shaped genetic diversity at genes involved in neurodevelopmental disorders (2017) · cites this paper as [29]
In the citing paper
“MAGI identified modules containing functionally related genes enriched for deleterious mutations in ASD, many of which are under strong purifying selection, and are also found in epilepsy, schizophrenia and intellectual disability133.”
From Systems biology and gene networks in neurodevelopmental and neurodegenerative disorders (2015) · cites this paper as [133]
Self-check
Percentages, sums and reported differences re-computed from the paper’s own numbers.
The self-check needs the paper’s full text.
Citations
Cites
Cytoscape: A software Environment for integrated models of biomolecular interaction networks
Shannon, P., Markiel, A., Ozier, O., Baliga, N. S., Wang, J. T., Ramage, D., Amin, N., Schwikowski, B., & Ideker, T. (2003) · Genome Research · doi:10.1101/gr.1239303 · Cited by 51,888
A general framework for estimating the relative pathogenicity of human genetic variants
Kircher, M., Witten, D. M., Jain, P., O'Roak, B. J., Cooper, G. M., & Shendure, J. (2014) · Nature Genetics · doi:10.1038/ng.2892 · Cited by 6,183
Szklarczyk, D., Franceschini, A., Kuhn, M., Simonovic, M., Roth, A. C., Mínguez, P., Doerks, T., Stark, M., Muller, J., Bork, P., et al. (2010) · Nucleic Acids Research · doi:10.1093/nar/gkq973 · Cited by 3,469
Human Protein Reference Database--2009 update
Prasad, T. S. K., Goel, R., Kandasamy, K., Keerthikumar, S., Kumar, S., Mathivanan, S., Telikicherla, D., Raju, R., Shafreen, R. B., Venugopal, A., et al. (2008) · Nucleic Acids Research · doi:10.1093/nar/gkn892 · Cited by 3,252
Sporadic autism exomes reveal a highly interconnected protein network of de novo mutations
O’Roak, B. J., Vives, L., Girirajan, S., Karakoc, E., Krumm, N., Coe, B. P., Levy, R., Ko, A., Lee, C., Smith, J. D., et al. (2012) · Nature · doi:10.1038/nature10989 · Cited by 2,165
Self-citationRate of de novo mutations and the importance of father’s age to disease risk
Kong, A., Frigge, M. L., Masson, G., Besenbacher, S., Sulem, P., Magnusson, G., Gudjonsson, S. A., Sigurdsson, A., Jonasdottir, A., Jonasdottir, A., et al. (2012) · Nature · doi:10.1038/nature11396 · Cited by 2,134
De novo mutations revealed by whole-exome sequencing are strongly associated with autism
Sanders, S. J., Murtha, M. T., Gupta, A. R., Murdoch, J. D., Raubeson, M. J., Willsey, A. J., Ercan-Sencicek, A. G., DiLullo, N. M., Parikshak, N. N., Stein, J. L., et al. (2012) · Nature · doi:10.1038/nature10945 · Cited by 2,084
FMRP Stalls Ribosomal Translocation on mRNAs Linked to Synaptic Function and Autism
Darnell, J. C., Van Driesche, S. J., Zhang, C., Hung, K. Y. S., Mele, A., Fraser, C. E., Stone, E. F., Chen, C., Fak, J. J., Chi, S. W., et al. (2011) · Cell · doi:10.1016/j.cell.2011.06.013 · Cited by 2,072
Transcriptomic Analysis of Autistic Brain Reveals Convergent Molecular Pathology
Voineagu, I., Wang, X., Johnston, P., Lowe, J. K., Tian, Y., Horvath, S., Mill, J., Cantor, R. M., Blencowe, B. J., & Geschwind, D. H. (2011) · Nature · doi:10.1038/nature10110 · Cited by 1,874
Patterns and rates of exonic de novo mutations in autism spectrum disorders
Neale, B. M., Kou, Y., Liu, L., Ma’ayan, A., Samocha, K. E., Sabo, A., Lin, C.-F., Stevens, C., Wang, L.-S., Makarov, V., et al. (2012) · Nature · doi:10.1038/nature11011 · Cited by 1,734
Cited by
Sorted by citations
Items 101–200 of 248
New genes involved in Angelman syndrome-like: Expanding the genetic spectrum
Aguilera, C., Gabau, E., Ramírez-Mallafré, A., Gasca, C. B. I., Domínguez‐Carral, J., Delgadillo, V., Laurie, S., Derdak, S. V., Padilla, N., de la Cruz, X., et al. (2021) · PLoS ONE · doi:10.1371/journal.pone.0258766 · Cited by 28
Dai, Y., Pei, G., Zhao, Z., & Jia, P. (2019) · Frontiers in Genetics · doi:10.3389/fgene.2019.00318 · Cited by 23
Standardized phenotyping enhances Mendelian disease gene identification
Vissers, L. E. L. M., & Veltman, J. A. (2015) · Nature Genetics · doi:10.1038/ng.3425 · Cited by 22
UBE3A-mediated regulation of imprinted genes and epigenome-wide marks in human neurons
Lopez, S. J., Dunaway, K. W., Islam, M. S., Mordaunt, C. E., Ciernia, A. V., Meguro‐Horike, M., Horike, S., Segal, D. J., & LaSalle, J. M. (2017) · Epigenetics · doi:10.1080/15592294.2017.1376151 · Cited by 24
Mozzi, A., Forni, D., Cagliani, R., Pozzoli, U., Clerici, M., & Sironi, M. (2017) · Scientific Reports · doi:10.1038/s41598-017-06440-4 · Cited by 19
Functional divergence of the two Elongator subcomplexes during neurodevelopment
Gaik, M., Kojic, M., Stegeman, M. R., Öner, T. Ö., Kościelniak, A., Jones, A., Mohamed, A., Chau, P. Y. S., Sharmin, S., Chramiec‐Głąbik, A., et al. (2022) · EMBO Molecular Medicine · doi:10.15252/emmm.202115608 · Cited by 20
Self-citationLevchenko, А., Nurgaliev, T., Kanapin, A. A., Samsonova, A. A., & Gainetdinov, R. R. (2020) · Heliyon · doi:10.1016/j.heliyon.2020.e03990 · Cited by 20
Gokoolparsadh, A., Sutton, G. J., Charamko, A., Green, N. F. O., Pardy, C. J., & Voineagu, I. (2016) · Cellular and Molecular Life Sciences · doi:10.1007/s00018-016-2304-0 · Cited by 19
Characterization of cell-cell communication in autistic brains with single-cell transcriptomes
Astorkia, M., Lachman, H. M., & Zheng, D. (2022) · Journal of Neurodevelopmental Disorders · doi:10.1186/s11689-022-09441-1 · Cited by 19
Guerreiro, S. R., & Maciel, P. (2023) · Cells · doi:10.3390/cells12040538 · Cited by 20
Network module identification—A widespread theoretical bias and best practices
Nikolayeva, I., Guitart-Pla, O., & Schwikowski, B. (2017) · Methods · doi:10.1016/j.ymeth.2017.08.008 · Cited by 19
Jia, P., Chen, X., Fanous, A. H., & Zhao, Z. (2018) · Translational Psychiatry · doi:10.1038/s41398-018-0154-2 · Cited by 19
Shohat, S., Amelan, A., & Shifman, S. (2020) · Biological Psychiatry · doi:10.1016/j.biopsych.2020.05.019 · Cited by 19
Nguyen, H. T., Bryois, J., Kim, A., Dobbyn, A., Huckins, L. M., Muñoz‐Manchado, A. B., Ruderfer, D. M., Genovese, G., Fromer, M., Xu, X., et al. (2017) · bioRxiv (Cold Spring Harbor Laboratory) · doi:10.1101/135293 · Cited by 19
NetMix: A Network-Structured Mixture Model for Reduced-Bias Estimation of Altered Subnetworks
Reyna, M. A., Chitra, U., Elyanow, R., & Raphael, B. J. (2021) · Journal of Computational Biology · doi:10.1089/cmb.2020.0435 · Cited by 16
Fass, D. M., Lewis, M. C., Ahmad, R., Szucs, M. J., Zhang, Q., Fleishman, M., Wang, D., Kim, M. J., Biag, J. D., Carr, S. A., et al. (2022) · Molecular Psychiatry · doi:10.1038/s41380-022-01557-z · Cited by 20
Enabling Precision Medicine through Integrative Network Models
Yao, V., Wong, A. K., & Troyanskaya, O. G. (2018) · Journal of Molecular Biology · doi:10.1016/j.jmb.2018.07.004 · Cited by 17
Kozol, R. A. (2018) · Journal of Developmental Biology · doi:10.3390/jdb6040029 · Cited by 18
Incorporating networks in a probabilistic graphical model to find drivers for complex human diseases
Mezlini, A. M., & Goldenberg, A. (2017) · PLoS Computational Biology · doi:10.1371/journal.pcbi.1005580 · Cited by 16
Identification of disease treatment mechanisms through the multiscale interactomePreprint
Ruiz, C., Žitnik, M., & Leskovec, J. (2020) · bioRxiv (Cold Spring Harbor Laboratory) · doi:10.1101/2020.04.30.069690 · Cited by 17
Genetic Causes of Autism Spectrum Disorders
Huguet, G., & Bourgeron, T. (2016) · Elsevier eBooks · doi:10.1016/b978-0-12-800109-7.00002-9 · Cited by 17
Meng, Y., Guan, Y., Zhang, W., Wu, Y., Jia, H., Zhang, Y., Zhang, X., Du, H., & Wang, X. (2016) · Scientific Reports · doi:10.1038/srep34138 · Cited by 16
Co-expression networks reveal the tissue-specific regulation of transcription and splicingPreprint
Saha, A., Kim, Y., Gewirtz, A. D., Jo, B., Gao, C., McDowell, I. C., Engelhardt, B. E., & Battle, A. J. (2016) · bioRxiv (Cold Spring Harbor Laboratory) · doi:10.1101/078741 · Cited by 17
Pang, K., Wang, L., Wang, W., Zhou, J., Cheng, C., Han, K., Zoghbi, H. Y., & Liu, Z. (2020) · Genome Research · doi:10.1101/gr.254987.119 · Cited by 16
Current trends of high-risk gene Cul3 in neurodevelopmental disorders
Lin, P., Yang, J., Wu, S., Ye, T., Zhuang, W., Wang, W., & Tan, T. (2023) · Frontiers in Psychiatry · doi:10.3389/fpsyt.2023.1215110 · Cited by 14
Shchelochkov, O. A., Farmer, C., Chlebowski, C., Adedipe, D., Ferry, S., Manoli, I., Pass, A. R., McCoy, S., Ryzin, C. V., Sloan, J. L., et al. (2024) · Molecular Psychiatry · doi:10.1038/s41380-023-02385-5 · Cited by 14
Kopp, N., Climer, S., & Dougherty, J. D. (2015) · Frontiers in Genetics · doi:10.3389/fgene.2015.00301 · Cited by 15
ST-Steiner: a spatio-temporal gene discovery algorithm
Norman, U., & Çiçek, A. E. (2019) · Bioinformatics · doi:10.1093/bioinformatics/btz110 · Cited by 14
Genetic analysis of very obese children with autism spectrum disorder
Cortes, H. D., & Wevrick, R. (2018) · Molecular Genetics and Genomics · doi:10.1007/s00438-018-1418-5 · Cited by 15
A genomic view on epilepsy and autism candidate genes
Jabbari, K., & Nürnberg, P. (2016) · Genomics · doi:10.1016/j.ygeno.2016.01.001 · Cited by 15
New Horizons for Molecular Genetics Diagnostic and Research in Autism Spectrum Disorder
Al-Dewik, N. I. E., & Alsharshani, M. (2020) · Advances in neurobiology · doi:10.1007/978-3-030-30402-7_2 · Cited by 13
Strength of functional signature correlates with effect size in autism
Ballouz, S., & Gillis, J. (2017) · Genome Medicine · doi:10.1186/s13073-017-0455-8 · Cited by 14
Yang, Y., Shi, L., Jin, X., & Tong, S. (2023) · BMC Pediatrics · doi:10.1186/s12887-022-03819-9 · Cited by 13
A critical review of the impact of candidate copy number variants on autism spectrum disorder
Abedini, S. S., Akhavantabasi, S., Liang, Y., Heng, J. I., Alizadehsani, R., Dehzangi, A., Bauer, D. C., & Alinejad‐Rokny, H. (2024) · Mutation Research/Reviews in Mutation Research · doi:10.1016/j.mrrev.2024.108509 · Cited by 18
Loss of POGZ alters neural differentiation of human embryonic stem cells
Deng, L., Mojica-Perez, S. P., Azaria, R. D., Schultz, M. L., Parent, J. M., & Niu, W. (2022) · Molecular and Cellular Neuroscience · doi:10.1016/j.mcn.2022.103727 · Cited by 14
Anatomy and Cell Biology of Autism Spectrum Disorder: Lessons from Human Genetics
Kleijer, K. T. E., Huguet, G., Tastet, J., Bourgeron, T., & Burbach, J. P. H. (2017) · Advances in anatomy, embryology and cell biology · doi:10.1007/978-3-319-52498-6_1 · Cited by 13
Nanni, N. D., Bersanelli, M., Cupaioli, F. A., Milanesi, L., Mezzelani, A., & Mosca, E. (2019) · International Journal of Molecular Sciences · doi:10.3390/ijms20133363 · Cited by 13
Wu, N., Wang, Y., Jia, J.-Y., Pan, Y.-H., & Yuan, X. (2021) · Neuroscience Bulletin · doi:10.1007/s12264-021-00770-0 · Cited by 13
DeepND: Deep multitask learning of gene risk for comorbid neurodevelopmental disorders
Beyreli, İ., Karakahya, O., & Çiçek, A. E. (2022) · Patterns · doi:10.1016/j.patter.2022.100524 · Cited by 13
Choi, J., Shooshtari, P., Samocha, K. E., Daly, M. J., & Cotsapas, C. J. (2016) · PLoS Genetics · doi:10.1371/journal.pgen.1006121 · Cited by 12
Jia, P., Chen, X., Xie, W., Kendler, K. S., & Zhao, Z. (2018) · Schizophrenia Bulletin · doi:10.1093/schbul/sby085 · Cited by 11
Ahmed, H. A., Alarabi, L., El–Sappagh, S., Soliman, H., & Elmogy, M. M. (2021) · PeerJ Computer Science · doi:10.7717/peerj-cs.697 · Cited by 11
Translational genetic research of complex diseases
Grouse, L. D. (2015) · Journal of Translational Internal Medicine · doi:10.1515/jtim-2015-0020 · Cited by 10
Network Structure Analysis Identifying Key Genes of Autism and Its Mechanism
Wang, Y., Kou, Y., & Meng, D. (2020) · Computational and Mathematical Methods in Medicine · doi:10.1155/2020/3753080 · Cited by 11
Ashitha, S. N. M., & Ramachandra, N. B. (2020) · Neuroscience · doi:10.1016/j.neuroscience.2020.04.051 · Cited by 10
Distinct genetic patterns of shared and unique genes across four neurodevelopmental disorders
Zhang, Y., Wang, R., Liu, Z., Jiang, S., Du, L.-F., Qiu, K., Li, F., Wang, Q., Jin, J., Chen, X., et al. (2020) · American Journal of Medical Genetics Part B Neuropsychiatric Genetics · doi:10.1002/ajmg.b.32821 · Cited by 10
Telias, M., & Ben‐Yosef, D. (2021) · Frontiers in Molecular Neuroscience · doi:10.3389/fnmol.2021.680018 · Cited by 11
Translating genetic and preclinical findings into autism therapies
Chahrour, M. H., Kleiman, R. J., & Manzini, M. C. (2017) · Dialogues in Clinical Neuroscience · doi:10.31887/dcns.2017.19.4/cmanzini · Cited by 11
Diverse types of genomic evidence converge on alcohol use disorder risk genes
Dai, Y., Hu, R., Pei, G., Zhang, H., Zhao, Z., & Jia, P. (2020) · Journal of Medical Genetics · doi:10.1136/jmedgenet-2019-106490 · Cited by 11
The role of machine learning in autism spectrum disorder assessment and management
Reilly, A., Walsh, N., O’Reilly, D. P., Smyth, M., Gorman, K. M., Ostadabbas, S., & Power, C. (2025) · Pediatric Research · doi:10.1038/s41390-025-04566-0 · Cited by 15
Wang, Z., Qu, J., Yang, Z., Liu, D.-Y., Jiang, S., Zhang, Y., Yang, Z., Mao, X., & Liu, Z. (2022) · Frontiers in Neuroscience · doi:10.3389/fnins.2022.892022 · Cited by 10
Enrichment of factors regulating canonical Wnt signaling among autism risk genes
Packer, A. I. (2016) · Molecular Psychiatry · doi:10.1038/mp.2016.228 · Cited by 9
NetMix2: A Principled Network Propagation Algorithm for Identifying Altered Subnetworks
Chitra, U., Park, T. Y., & Raphael, B. J. (2022) · Journal of Computational Biology · doi:10.1089/cmb.2022.0336 · Cited by 9
Bhuvaneshwar, K., & Gusev, Y. (2024) · Briefings in Bioinformatics · doi:10.1093/bib/bbae098 · Cited by 11
Xu, J., Jing, R., Liu, Y., Dong, Y., Wen, Z., & Li, M. (2016) · Scientific Reports · doi:10.1038/srep28720 · Cited by 8
Machine Learning-Based Model for Identification of Syndromic Autism Spectrum Disorder
Sudha, V. P., & Vijaya, M. S. (2018) · Studies in computational intelligence · doi:10.1007/978-981-10-8797-4_16 · Cited by 8
Integration with systems biology approaches and -omics data to characterize risk variation
Young, H. E., Cote, A. C., & Huckins, L. M. (2022) · Elsevier eBooks · doi:10.1016/b978-0-12-819602-1.00017-6 · Cited by 9
Hierarchical cortical transcriptome disorganization in autism
Lombardo, M. V., Courchesne, E., Lewis, N. E., & Pramparo, T. (2016) · doi:10.1101/042937 · Cited by 7
Inhibition of GSK3α,β rescues cognitive phenotypes in a preclinical mouse model of CTNNB1 syndrome
Alexander, J., Vazquez-Ramirez, L., Lin, C., Antonoudiou, P., Maguire, J. L., Wagner, F. F., & Jacob, M. H. (2024) · EMBO Molecular Medicine · doi:10.1038/s44321-024-00110-5 · Cited by 9
Genetic and genomic analyses as a basis for new diagnostic nosologies
Gershon, E. S., & Grennan, K. S. (2015) · Dialogues in Clinical Neuroscience · doi:10.31887/dcns.2015.17.1/egershon · Cited by 8
How the New Neuroscience Will Advance Medicine
Bargmann, C. I. (2015) · JAMA · doi:10.1001/jama.2015.3298 · Cited by 7
Altieri, F., Hansen, T., & Vandin, F. (2019) · Frontiers in Genetics · doi:10.3389/fgene.2019.00265 · Cited by 7
The architecture of brain co-expression reveals the brain-wide basis of disease susceptibilityPreprint
Hartl, C., Ramaswami, G., Pembroke, W. G., Muller, S., Pintacuda, G., Saha, A., Parsana, P., Battle, A. J., Lage, K., & Geschwind, D. H. (2020) · bioRxiv (Cold Spring Harbor Laboratory) · doi:10.1101/2020.03.05.965749 · Cited by 7
Fujimoto, T., Mori, M., Tonosaki, M., Yaoi, T., Nakano, K., Okamura, T., & Itoh, K. (2025) · Molecular Neurobiology · doi:10.1007/s12035-024-04676-6 · Cited by 6
Integrative Functional Genomic Analysis in Multiplex Autism Families from Kazakhstan
Perfilyeva, A. V., Беспалова, К., Perfilyeva, Y. V., Skvortsova, L., Musralina, L., Zhunussova, G., Khussainova, E., Iskakova, U., Bekmanov, B., & Djansugurova, L. (2022) · Disease Markers · doi:10.1155/2022/1509994 · Cited by 6
Zhao, Y., Pan, Q., & Du, C. (2018) · Biometrics · doi:10.1111/biom.12955 · Cited by 6
Nishizaki, S. S., Haghani, N. K., La, G. N., Mariano, N. A. F., Uribe‐Salazar, J. M., Kaya, G., Regester, M., Andrews, D. S., Nordahl, C. W., Amaral, D. G., et al. (2025) · Autism Research · doi:10.1002/aur.3314 · Cited by 6
Quantifying concordant genetic effects of de novo mutations on multiple disorders
Guo, H., Hou, L., Shi, Y., Jin, S. C., Zeng, X. Q., Li, B., Lifton, R. P., Brueckner, M. K., Zhao, H., & Lu, Q. (2022) · eLife · doi:10.7554/elife.75551 · Cited by 6
Finding Mutated Subnetworks Associated with Survival in CancerPreprint
Hansen, T., & Vandin, F. (2016) · arXiv (Cornell University) · doi:10.48550/arxiv.1604.02467 · Cited by 6
The relationship between neurodevelopmental disorders (NDDs) and NLRP3 inflammasome
Shahi, A., Firoozi, Z., Al‐Awsi, G. R. L., Mirzaei, E., Shahbazi, H., Rezaee, Z., Mohammadisoleimani, E., Mansoori, Y., & Moravej, A. (2025) · Inflammation Research · doi:10.1007/s00011-025-02052-1 · Cited by 7
Naqvi, W., Singh, A., Garg, P., & Srivastava, P. (2023) · Biocell · doi:10.32604/biocell.2023.029624 · Cited by 5
Graph Node Classification to Predict Autism Risk in Genes
Bandara, D., & Riccardi, K. (2024) · Genes · doi:10.3390/genes15040447 · Cited by 6
Piergiorge, R. M., de Vasconcelos, A. T. R., Pimentel, M. M. G., & Santos-Rebouças, C. B. (2020) · The World Journal of Biological Psychiatry · doi:10.1080/15622975.2020.1821916 · Cited by 5
Novel correlative analysis identifies multiple genomic variations impacting ASD with macrocephaly
Fu, C. S., Ngo, J., Zhang, S., Lu, L., Miron, A., Schafer, S. T., Gage, F. H., Jin, F., Schumacher, F. R., & Wynshaw-Boris, A. J. (2022) · Human Molecular Genetics · doi:10.1093/hmg/ddac300 · Cited by 5
Bergman, N. (2016) · World Journal of Clinical Pediatrics · doi:10.5409/wjcp.v5.i3.330 · Cited by 7
Global changes in patterning, splicing and primate specific lncRNAs in autism brainPreprint
Parikshak, N., Swarup, V., Belgard, T. G., Gandal, M. J., Irimia, M., Leppä, V., Lowe, J. K., Johnson, R., Blencowe, B. J., Horvath, S., et al. (2016) · bioRxiv (Cold Spring Harbor Laboratory) · doi:10.1101/077057 · Cited by 4
An Overview of Bioinformatics Methods for Analyzing Autism Spectrum Disorders
Nakashima, S., Nacher, J. C., Song, J., & Akutsu, T. (2019) · Current Pharmaceutical Design · doi:10.2174/1381612825666191111154837 · Cited by 4
Zhang, P., Zhang, W., Sun, W., Xu, J., Hu, H., Wang, L., & Wong, L. (2024) · BMC Genomics · doi:10.1186/s12864-024-09967-9 · Cited by 5
He, M. L., Du, B., Chen, G., Lyu, Y., Guo, H., Jia, X., & Xia, K. (2025) · Autism Research · doi:10.1002/aur.3308 · Cited by 4
Ju, X., Zhang, P.-H., Li, Q., Bai, Q.-Y., Hu, B., Xu, J., & Lu, C. F. (2025) · Research on Child and Adolescent Psychopathology · doi:10.1007/s10802-025-01303-3 · Cited by 4
Pirooznia, M., Niranjan, T., Chen, Y.-C., Tunc, I., Goes, F. S., Avramopoulos, D., Potash, J. B., Huganir, R. L., Zandi, P. P., & Wang, T. (2019) · Frontiers in Genetics · doi:10.3389/fgene.2019.01186 · Cited by 4
A Data Fusion Approach to Enhance Association Study in Epilepsy
Marini, S., Limongelli, I., Rizzo, E., Malovini, A. L., Errichiello, E., Vetro, A., Da, T., Zuffardi, O., & Bellazzi, R. (2016) · PLoS ONE · doi:10.1371/journal.pone.0164940 · Cited by 4
Ćuk, M., Lovrenčić, L., Unal, B., Walker, M., Hayes, C. P., Krakar, G., Belužić, R., Sansović, I., Pavliša, G., & Ghazani, A. A. (2024) · American Journal of Case Reports · doi:10.12659/ajcr.943641 · Cited by 3
Complex Disease Genes Identification Using a Heterogeneous Network Embedding Approach
Ghasemi, M., Rahgozar, M., & Kavousi, K. (2022) · IEEE Transactions on Computational Biology and Bioinformatics · doi:10.1109/tcbb.2022.3175598 · Cited by 3
Neurodevelopmental Disorders of the Cerebellum: Autism Spectrum Disorder
Toback, M., Rad, A. A., Okafor, I. A., Allahtavakoli, M., Zangeneh, K., Siddiqui, T. J., & Marzban, H. (2023) · Contemporary clinical neuroscience · doi:10.1007/978-3-031-23104-9_21 · Cited by 4
SOX7: Autism associated gene identified by analysis of multi-Omics data
Gonzales, S., Zhao, J. Z., Choi, N. Y., Acharya, P., Jeong, S., Wang, X., & Lee, M. (2025) · PLoS ONE · doi:10.1371/journal.pone.0320096 · Cited by 7
Decision Tree Based Model for the Classification of Pathogenic Gene Sequences Causing ASD
Sudha, V. P., & Vijaya, M. S. (2018) · Communications in computer and information science · doi:10.1007/978-981-13-1423-0_23 · Cited by 3
Combinatorial Approach for Complex Disorder Prediction: Case Study of Neurodevelopmental Disorders
Huynh, L. N., & Hormozdiari, F. (2018) · Genetics · doi:10.1534/genetics.118.301280 · Cited by 3
Self-citationGagneux, P. (2021) · Evolutionary studies · doi:10.1007/978-4-431-56904-6_1 · Cited by 3
PyPathway: Python Package for Biological Network Analysis and Visualization
Xu, Y., & Luo, X. (2018) · Journal of Computational Biology · doi:10.1089/cmb.2017.0199 · Cited by 3
Deep multitask learning of gene risk for comorbid neurodevelopmental disordersPreprint
Beyreli, İ., Karakahya, O., & Çiçek, A. E. (2020) · bioRxiv (Cold Spring Harbor Laboratory) · doi:10.1101/2020.06.13.150201 · Cited by 3
Applications of Network Analysis in Biomedicine
Wang, S., & Huang, T. (2020) · Methods in molecular biology · doi:10.1007/978-1-0716-0904-0_4 · Cited by 2
Bhattacharya, A., Parlanti, P., Cavallo, L., Farrow, E., Spivey, T. M., Renieri, A., Mari, F., & Manzini, M. C. (2024) · Human Molecular Genetics · doi:10.1093/hmg/ddae070 · Cited by 3
Transcriptome Study in Sicilian Patients with Autism Spectrum Disorder
Salemi, M., Schillaci, F. A., Lanza, G., Marchese, G., Salluzzo, M. G., Cordella, A., Caniglia, S., Bruccheri, M. G., Truda, A., Greco, D., et al. (2024) · Biomedicines · doi:10.3390/biomedicines12071402 · Cited by 3
NetMix2: Unifying Network Propagation and Altered Subnetworks
Chitra, U., Park, T. Y., & Raphael, B. J. (2022) · Lecture notes in computer science · doi:10.1007/978-3-031-04749-7_12 · Cited by 2
Grouse, L. D. (2015) · PubMed Central · doi:10.3978/j.issn.2072-1439.2015.10.38 · Cited by 2
Neurodevelopmental Disorders of the Cerebellum: Autism Spectrum Disorder
Toback, M., Zangeneh, K., Siddiqui, T. J., & Marzban, H. (2017) · Contemporary clinical neuroscience · doi:10.1007/978-3-319-59749-2_18 · Cited by 2
Role of Copy Number Variations in ADHD
Krgović, D. (2020) · IntechOpen eBooks · doi:10.5772/intechopen.94383 · Cited by 2
Discriminative features in White-Sutton syndrome: literature review and first report in Iran
Esmaeilzadeh, E., Harandi, A. J., Astaraki, F., & Khorshid, H. R. K. (2023) · Psychiatric Genetics · doi:10.1097/ypg.0000000000000358 · Cited by 2
NetMix: A Network-Structured Mixture Model for Reduced-Bias Estimation of Altered Subnetworks
Reyna, M. A., Chitra, U., Elyanow, R., & Raphael, B. J. (2020) · Lecture notes in computer science · doi:10.1007/978-3-030-45257-5_11 · Cited by 2
Metadata
- Authors
- Hormozdiari, F., Penn, O., Borenstein, E., & Eichler, E. E.
- Affiliations
- University of Washington (US)
- Howard Hughes Medical Institute (US)
- Venue
- Genome Research
- Publisher
- Cold Spring Harbor Laboratory
- Published
- 2014-11-05
- Volume
- 25
- Issue
- 1
- Pages
- 142-154
- ISSN
- 1088-9051 (ISSN-L)
- 1549-5469
- PMC
- PMC4317170
- OpenAlex
- W2106870542
- Cited by
- 249
- References
- 53
- Citations by year
- 2026: 5 · 2025: 11 · 2024: 11 · 2023: 16 · 2022: 20 · 2021: 20 · 2020: 29 · 2019: 27 · 2018: 23 · 2017: 27 · 2016: 43 · 2015: 16 · 2014: 1
- Type
- posted content
- Language
- en
- Open access
- bronze
- doi.org
- Locations
- Genome Research (publishedVersion)
- PubMed Central (publishedVersion, cc-by-nc)
- PubMed (publishedVersion)
- eScholarship (California Digital Library) (submittedVersion, cc-by-nc)
- Funders
- Simons Foundation (303241)
- NIH/NIMH (R01MH101221)
- Topics
- Life Sciences › Biochemistry, Genetics and Molecular Biology › Genetics › Genetics and Neurodevelopmental Disorders
- Life Sciences › Neuroscience › Cognitive Neuroscience › Autism Spectrum Disorder Research
- Life Sciences › Biochemistry, Genetics and Molecular Biology › Molecular Biology › Bioinformatics and Genomic Networks
- Keywords
- autism spectrum disorder, intellectual disability, de novo mutations, gene regulatory networks, Three Kings, protein-protein interaction, RNA-seq expression, brain development, Wnt signaling, Notch signaling, SWI/SNF complex, synaptic function, long-term potentiation, calcium signaling, epilepsy, schizophrenia, neurodevelopmental disorders, missense mutations, disease severity
- MeSH terms
- Algorithms, Autistic Disorder, Epilepsy, Humans, Phenotype, Schizophrenia, Cohort Studies, Cluster Analysis, Databases, Factual, Sequence Analysis, RNA, Genetic Heterogeneity, Mutation, Missense, Gene Regulatory Networks, Exome
About these checks
Registry, retraction, Cites and statistics results are computed, not judged, with one exception: a printed reference that no index lists is read once by a model before it counts as a citation error. Claims are extracted by a model and kept only when their quote appears verbatim in the text; each cited source is then checked, with a model’s help, for whether it says what the claim relies on. Those verdicts can be wrong — read the claim’s quote and the cited source before relying on one.
Statistics and arithmetic are recomputed, not judged.
Confidence bands are shown only for fields calibrated on our annotated test set. None is calibrated yet, so no band is shown.
What counts as a claim ›How we measure confidence ›How we check this ›
Are you an author, or do you see a problem with this page? Request a review
