

The DOI matches its Crossref record; 125 of the 125 references it cites were found in a registry or an index; 45 of the 67 sources its claims cite were checked for support.
Distinct selective forces and Neanderthal introgression shaped genetic diversity at genes involved in neurodevelopmental disorders
Open accessAbstract
In addition to high intelligence, humans evolved specialized social-cognitive skills, which are specifically affected in children with autism spectrum disorder (ASD). Genes affected in ASD represent suitable candidates to study the evolution of human social cognition. We performed an evolutionary analysis on 68 genes associated to neurodevelopmental disorders; our data indicate that genetic diversity was shaped by distinct selective forces, including natural selection and introgression from archaic hominins. We discuss the possibility that segregation distortion during spermatogenesis accounts for a subset of ASD mutations. Finally, we detected modern-human-specific alleles in DYRK1A and TCF4. These variants are located within regions that display chromatin features typical of transcriptional enhancers in several brain areas, strongly suggesting a regulatory role. These SNPs thus represent candidates for association with neurodevelopmental disorders, and await experimental validation in future studies.
Overview
CoChat Summary
## TL;DR
This study analyzed 68 genes implicated in neurodevelopmental disorders and found that their evolutionary histories were shaped by purifying selection, episodic positive selection, Neanderthal introgression, and modern-human-specific changes. The authors highlight candidate regulatory variants in DYRK1A and TCF4 and a Neanderthal-derived haplotype spanning SYNGAP1 and nearby genes.
## Key findings
- Evidence of positive selection was found in 8/47 (17.0%) genes in module M1 and 6/21 (28.6%) genes in module M2 on the mammalian/sauropsidan branch-site analyses.
- Across the mammalian phylogeny, codeml site models rejected neutrality in favor of positive selection for MDM2, MECP2, MYC, SMARCC2, UIMC1 (M1) and GRIN2A, MAP1A, SYNGAP1 (M2); selected sites were kept only when supported by at least two methods.
- Human/great ape analyses showed strong purifying selection overall: the SnIPRE constraint parameter f was significantly lower for both M1 and M2 than for other human genes (one-way ANOVA F = 39.5, p = 2 × 10⁻¹⁶), and M1/M2 genes also had lower f than GC/length- or GERP-matched gene sets.
- Neanderthal introgression was significantly lower in M1 genes than in all coding genes in both populations (Kruskall-Wallis p = 0.032 in Europeans, p = 0.0085 in Asians; Nemenyi post-hoc p = 0.033 and 0.0085), and the authors found an ~108 kb introgressed haplotype spanning SYNGAP1 and nearby genes, with 5 variants reported as brain eQTLs for CUTA and PHF1.
- The strongest modern-human-specific signals were in DYRK1A and TCF4; the paper says these variants lie in regions with enhancer-like chromatin features in several brain areas and are candidates for neurodevelopmental disorder association.
## Methods
- The study examined 68 genes from two MAGI-defined modules: M1 (47 genes) and M2 (21 genes), previously enriched for de novo mutations in ASD/ID probands.
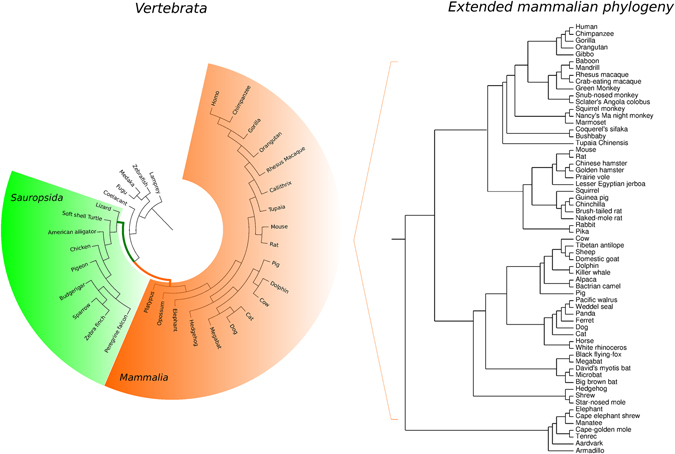
- Evolutionary analyses used vertebrate orthologs (33 species), a mammalian phylogeny (at least 60 mammalian species), human/chimp/gorilla population-genetic data, 1000 Genomes Phase 1 data, Neanderthal introgression probabilities, BRAINEAC brain eQTLs, and modern-human-specific site catalogs.
- Main analyses included branch-site likelihood ratio tests, codeml/PAML site models, gammaMap, SnIPRE, introgression-score comparisons, haplotype/network analysis, and scans for modern-human-specific variants in regulatory regions and low-S regions.
## Limitations
- The paper states that the 68 genes are “not an exhaustive catalog” of ASD and ID risk loci.
- The authors note that branch-site tests have limited power, and their conservative requirement that selected sites be supported by at least two methods likely underestimated the number of positively selected sites.
- For modern-human-specific alleles, the paper notes they were defined using two archaic genomes only, so some alleles may have been missed or misclassified; this is a limitation stated in the text.
- Evident from the text: several highlighted variants are described as candidates and “await experimental validation,” so functional effects remain untested.
Model-written summary. Check it against the paper before relying on it.
Integrity signals
Registry
Cites
Statistics
Figures



Verification
Claims the paper makes
33 Valid · 2 Not valid · 11 Not checked · 81 Own results and interpretations
Every source the paper cites for this claim was checked and supports it.
In the paper
“This was achieved by using branch-site tests, which were shown to be robust to the large evolutionary distances of the vertebrate phylogeny59.”
§ Distinct selective forces and Neanderthal introgression shaped genetic diversity at genes involved in neurodevelopmental disorders > Discussion
What the sources say
- Supportedcites [59] Studer, R. A., Penel, S., Duret, L. & Robinson-Rechavi, M. Pervasive positive selection on duplicated and nonduplicated vertebrate protein coding genes. Genome Res. 18, 1393–1402 (2008). source
The Results section reports simulations on divergent vertebrate sequences and concludes that the branch-site test is robust to large sequence divergence. No page number is supplied for the passage. (LLM, conf=0.93)
plain- Asserted: passes — The authors put it forward as true.
- Checkable: passes — It can be checked against evidence.
- Load-bearing: passes — The paper’s conclusions depend on it.
- Based: passes — The paper gives a reason why it holds.
- Supported
The cited sources support only part of this claim — read each source’s verdict below.
In the paper
“Moreover, regions depleted of both Neanderthal and Denisova ancestry are enriched for genes expressed in specific brain regions (e.g. the ventral frontal cortex-ventrolateral prefrontal cortex in infants and the striatum in adulthood)55.”
§ Distinct selective forces and Neanderthal introgression shaped genetic diversity at genes involved in neurodevelopmental disorders > Results > Neanderthal introgression and modern human-specific alleles
What the sources say
- Partly supportedcites [55] Vernot, B. et al. Excavating Neandertal and Denisovan DNA from the genomes of Melanesian individuals. Science 352, 235–239 (2016). sourceExperimental — accuracy not yet measured
The passage on regions depleted of archaic lineages (section labeled Abstract; page unavailable) reports enrichment for genes expressed in the developing cortex and adult striatum. It supports the main claim and the adult-striatum example, but does not identify the infant ventral frontal cortex–ventrolateral prefrontal cortex specifically. (LLM, conf=0.85)
plainstates an association- Asserted: passes — The authors put it forward as true.
- Checkable: passes — It can be checked against evidence.
- Load-bearing: passes — The paper’s conclusions depend on it.
- Based: passes — The paper gives a reason why it holds.
- Partly supported
The cited sources support only part of this claim — read each source’s verdict below.
In the paper
“Conversely, experiments in crows, birds that display high cognitive abilities10, failed to reveal other-regarding preferences and reciprocity11, 12.”
§ Distinct selective forces and Neanderthal introgression shaped genetic diversity at genes involved in neurodevelopmental disorders > Discussion
What the sources say
- Supportedcites [11] Di Lascio, F., Nyffeler, F., Bshary, R. & Bugnyar, T. Ravens (Corvus corax) are indifferent to the gains of conspecific recipients or human partners in experimental tasks. Anim. Cogn. 16, 35–43 (2013). source
The Discussion (‘Do ravens face cognitive constraints in the standard paradigm?’) explicitly describes the study as yielding negative results for other-regarding preferences and reciprocity. It cautions that the ravens may not have understood the task, but the claim says only that the experiments failed to reveal those behaviours. (LLM, conf=0.92)
- Partly supportedcites [12] Schwab, C., Swoboda, R., Kotrschal, K. & Bugnyar, T. Recipients affect prosocial and altruistic choices in jackdaws, Corvus monedula. PLoS One 7, e34922 (2012). sourceExperimental — accuracy not yet measured
The Discussion reports that jackdaws did not show other-regarding preferences per se, supporting that part of the claim. But the Introduction and Methods say the birds’ roles were not reversed to exclude short-term reciprocity; the experiment did not test and fail to find reciprocity. The paper also reports that recipients’ behaviour increased cooperative choices. (LLM, conf=0.90)
plain- Asserted: passes — The authors put it forward as true.
- Checkable: passes — It can be checked against evidence.
- Load-bearing: unclear — It is unclear whether the paper’s conclusions depend on it.
- Based: passes — The paper gives a reason why it holds.
- Supported
The cited sources support only part of this claim — read each source’s verdict below.
In the paper
“We focused in particular on 68 genes which, despite not being an exhaustive catalog of genetic risk loci for ASD and ID, were previously shown to represent functional modules enriched of de novo mutations in probands29.”
§ Distinct selective forces and Neanderthal introgression shaped genetic diversity at genes involved in neurodevelopmental disorders > Discussion
What the sources say
- Partly supportedcites [29] Hormozdiari, F., Penn, O., Borenstein, E. & Eichler, E. E. The discovery of integrated gene networks for autism and related disorders. Genome Res. 25, 142–154 (2015). sourceExperimental — accuracy not yet measured
The Results (Autism and intellectual disability; page unavailable) describe connected, coexpressed gene modules enriched for de novo mutations in ASD and ID probands. They report 80 genes in M1_Extended and 24 in M2_Extended, however, and do not identify the citing document’s specific set of 68 genes as those modules. (LLM, conf=0.85)
plainstates an association- Asserted: passes — The authors put it forward as true.
- Checkable: passes — It can be checked against evidence.
- Load-bearing: passes — The paper’s conclusions depend on it.
- Based: passes — The paper gives a reason why it holds.
- Partly supported
The cited sources support only part of this claim — read each source’s verdict below.
In the paper
“For both genes haploinsufficiency is often associated with disease, indicating that adequate expression levels of these proteins are essential for neurodevelopment98, 101, 106.”
§ Distinct selective forces and Neanderthal introgression shaped genetic diversity at genes involved in neurodevelopmental disorders > Discussion
What the sources say
- Not checked — no full text of the sourcecites [98] Zweier, C. et al. Haploinsufficiency of TCF4 causes syndromal mental retardation with intermittent hyperventilation (Pitt-Hopkins syndrome). Am. J. Hum. Genet. 80, 994–1001 (2007). source
- Not checked — no full text of the sourcecites [101] Ji, J. et al. DYRK1A haploinsufficiency causes a new recognizable syndrome with microcephaly, intellectual disability, speech impairment, and distinct facies. Eur. J. Hum. Genet. 23, 1473–1481 (2015). source
- Partly supportedcites [106] Dierssen, M. & de Lagran, M. M. DYRK1A (dual-specificity tyrosine-phosphorylated and -regulated kinase 1A): a gene with dosage effect during development and neurogenesis. ScientificWorldJournal 6, 1911–1922 (2006). sourceExperimental — accuracy not yet measured
The “Effects of DYRK1A Deletion” section reports that mice with one disrupted DYRK1A allele have developmental delay, learning deficits, and reduced brain size, supporting the importance of DYRK1A dosage in neurodevelopment. This paper does not address TCF4, and its evidence for DYRK1A haploinsufficiency comes from mice rather than showing that it is often associated with human disease. (LLM, conf=0.86)
hedgedstates an association- Asserted: passes — The authors put it forward as true.
- Checkable: passes — It can be checked against evidence.
- Load-bearing: passes — The paper’s conclusions depend on it.
- Based: passes — The paper gives a reason why it holds.
69 more claims
Create a free account to see all 127 claims and every source verdict.
- Probably not a substantial claim. 34
- It may state two separate claims as one. 25
Citations
Cites
PAML 4: Phylogenetic Analysis by Maximum Likelihood
Yang, Z. (2007) · Molecular Biology and Evolution · doi:10.1093/molbev/msm088 · Cited by 13,879
Vos, T., Abajobir, A. A., Abate, K. H., Abbafati, C., Abbas, K. M., Abd-Allah, F., Abdulkader, R. S., Abdulle, A. M., Abebo, T. A., Abera, S. F., et al. (2017) · The Lancet · doi:10.1016/s0140-6736(17)32154-2 · Cited by 13,220
Median-joining networks for inferring intraspecific phylogenies
Bandelt, H. J., Forster, P., & Rohl, A. (1999) · Molecular Biology and Evolution · doi:10.1093/oxfordjournals.molbev.a026036 · Cited by 11,742
Vos, T., Barber, R. M., Bell, B., Bertozzi-Villa, A., Biryukov, S., Bolliger, I., Charlson, F., Davis, A., Degenhardt, L., Dicker, D., et al. (2015) · The Lancet · doi:10.1016/s0140-6736(15)60692-4 · Cited by 6,414
A draft sequence of the Neandertal genome
Green, R. E., Krause, J., Briggs, A. W., Maricic, T., Stenzel, U., Kircher, M., Patterson, N., Li, H., Zhai, W., Fritz, M. H.-Y., et al. (2010) · Science · doi:10.1126/science.1188021 · Cited by 4,318
HyPhy: hypothesis testing using phylogenies
Pond, S. L. K., Frost, S. D. W., & Muse, S. V. (2005) · Bioinformatics · doi:10.1093/bioinformatics/bti079 · Cited by 2,866
Not So Different After All: A Comparison of Methods for Detecting Amino Acid Sites Under Selection
Kosakovsky Pond, S. L., & Frost, S. D. W. (2005) · Molecular Biology and Evolution · doi:10.1093/molbev/msi105 · Cited by 2,324
The complete genome sequence of a Neanderthal from the Altai Mountains
Prüfer, K., Racimo, F., Patterson, N., Jay, F., Sankararaman, S., Sawyer, S., Heinze, A., Renaud, G., Sudmant, P. H., de Filippo, C., et al. (2014) · Nature · doi:10.1038/nature12886 · Cited by 2,254
Genetic history of an archaic hominin group from Denisova Cave in Siberia
Reich, D., Green, R. E., Kircher, M., Krause, J., Patterson, N., Durand, E. Y., Viola, B., Briggs, A. W., Stenzel, U., Johnson, P. L. F., et al. (2010) · Nature · doi:10.1038/nature09710 · Cited by 1,991
A high-coverage genome sequence from an archaic denisovan individual
Meyer, M., Kircher, M., Gansauge, M.-T., Li, H., Racimo, F., Mallick, S., Schraiber, J. G., Jay, F., Prüfer, K., de Filippo, C., et al. (2012) · Science · doi:10.1126/science.1224344 · Cited by 1,967
Cited by
DYRK1A and cognition: A lifelong relationship
Arbones, M. L., Thomazeau, A., Nakano-Kobayashi, A., Hagiwara, M., & Delabar, J. M. (2019) · Pharmacology & Therapeutics · doi:10.1016/j.pharmthera.2018.09.010 · Cited by 165
Harvati, K., & Ackermann, R. (2022) · Nature Ecology & Evolution · doi:10.1038/s41559-022-01875-z · Cited by 76
Evolutionary and medical consequences of archaic introgression into modern human genomes
Dolgova, O., & Lao, O. (2018) · Genes · doi:10.3390/genes9070358 · Cited by 34
“However, whatever the potential benefits of archaic introgression in the past, alleles of Neanderthal origin have been also associated with several neurological, dermatological, and immunological phenotypes, indicating an influence of ancient admixture on current disease risk in humans (Mozzi et al., 2017; Simonti et…”
BackgroundWidowati, E. W., Ernst, S., Hausmann, R., Müller‐Newen, G., & Becker, W. B. (2018) · Biology Open · doi:10.1242/bio.032862 · Cited by 36
DYRK1A Inhibitors and Perspectives for the Treatment of Alzheimer's Disease
de Souza, M. M., Cenci, A. R., Teixeira, K. F., Machado, V., Schülerb, M. C. G. M., Gonçalves, A. E., Dalmagro, A. P., Cazarin, C. A., Ferreira, L. L. G., de Oliveira, A. S., et al. (2022) · Current Medicinal Chemistry · doi:10.2174/0929867329666220620162018 · Cited by 31
Metadata
- Authors
- Mozzi, A., Forni, D., Cagliani, R., Pozzoli, U., Clerici, M., & Sironi, M.
- Affiliations
- IRCCS Eugenio Medea (IT)
- University of Milan (IT)
- Corresponding author
- Mozzi, Alessandra
- Venue
- Scientific Reports
- Published
- 2017-07-21
- Volume
- 7
- Issue
- 1
- Pages
- 6116-6116
- ISSN
- 2045-2322 (ISSN-L)
- PMC
- PMC5522412
- OpenAlex
- W2734786271
- Cited by
- 19
- References
- 125
- Citations by year
- 2026: 1 · 2025: 1 · 2023: 2 · 2022: 6 · 2021: 2 · 2020: 1 · 2018: 5
- FWCI
- 0.94
- Type
- journal article
- Language
- en
- Open access
- gold
- doi.org
- Licence
- cc-by
- creativecommons.org/licenses/by/4.0 (tdm)
- creativecommons.org/licenses/by/4.0 (vor)
- Locations
- Scientific Reports (publishedVersion, cc-by)
- PubMed Central (publishedVersion, cc-by)
- PubMed (publishedVersion)
- Archivio Istituzionale della Ricerca (Universita Degli Studi Di Milano) (submittedVersion, other-oa)
- BOA (University of Milano-Bicocca) (submittedVersion, cc-by)
- DOAJ (DOAJ: Directory of Open Access Journals) (submittedVersion, cc-by-sa)
- Topics
- Life Sciences › Neuroscience › Cognitive Neuroscience › Autism Spectrum Disorder Research
- Life Sciences › Biochemistry, Genetics and Molecular Biology › Genetics › Genetic Associations and Epidemiology
- Life Sciences › Biochemistry, Genetics and Molecular Biology › Genetics › Genetics and Neurodevelopmental Disorders
- Keywords
- Neanderthal introgression, natural selection, neurodevelopmental disorders, autism spectrum disorder, genetic diversity, segregation distortion, spermatogenesis, DYRK1A, TCF4, enhancers, regulatory variants
- MeSH terms
- Alleles, Animals, Humans, Mammals, Selection, Genetic, Genetic Variation, Hominidae, Evolution, Molecular, Genetic Predisposition to Disease, Polymorphism, Single Nucleotide, Neanderthals, Neurodevelopmental Disorders
About these checks
Registry, retraction, Cites and statistics results are computed, not judged, with one exception: a printed reference that no index lists is read once by a model before it counts as a citation error. Claims are extracted by a model and kept only when their quote appears verbatim in the text; each cited source is then checked, with a model’s help, for whether it says what the claim relies on. Those verdicts can be wrong — read the claim’s quote and the cited source before relying on one.
The claim verdicts this report counts are experimental: their accuracy is not yet measured.
A language model drew the claims from the paper on 2026-10-11, under version 3 of the claim definition (model deepseek-v4.1-flash, prompt extract-v3).
A second model labelled each claim on 2026-10-11 (model jev-1.13-20260917, definition revision gold-guideline-v0.2).
Cited sources are checked with a language model’s help (gpt-6-sol).
Statistics and arithmetic are recomputed, not judged.
Confidence bands are shown only for fields calibrated on our annotated test set. None is calibrated yet, so no band is shown.
What counts as a claim ›How we measure confidence ›How we check this ›
Are you an author, or do you see a problem with this page? Request a review
How to cite
Cite CoChat for the checks on this page, and the paper for its own findings.
- This page
- CoChat. (2026). Citation check: Distinct selective forces and Neanderthal introgression shaped genetic diversity at genes involved in neurodevelopmental disorders. https://app.cochat.ai/papers/10.1038/s41598-017-06440-4
- The paper
- Mozzi, A., Forni, D., Cagliani, R., Pozzoli, U., Clerici, M., & Sironi, M. (2017). Distinct selective forces and Neanderthal introgression shaped genetic diversity at genes involved in neurodevelopmental disorders. Scientific Reports. https://doi.org/10.1038/s41598-017-06440-4
Data sources
Bibliographic data: Semantic Scholar, OpenAlex, Crossref.
Contains information from the Semantic Scholar Academic Graph Datasets, made available under the ODC Attribution License (ODC-BY 1.0).
Semantic Scholar’s data is described in: Kinney, R., et al. (2023). The Semantic Scholar Open Data Platform. arXiv:2301.10140.
