

The DOI matches its Crossref record; 8 of the 8 references it cites were found in a registry or an index.
Single-cell analysis of human embryos reveals diverse patterns of aneuploidy and mosaicism
Published version of a preprint
Abstract
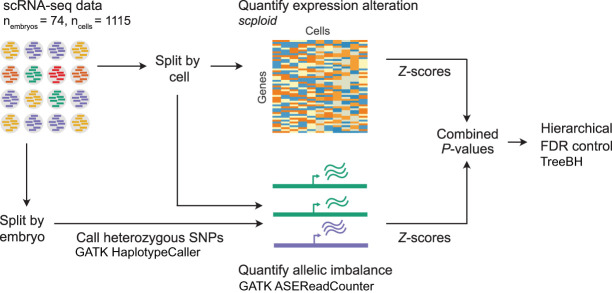
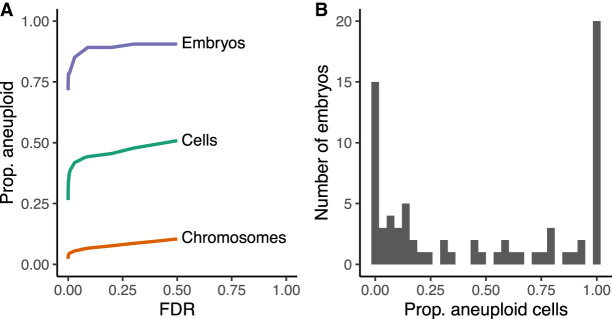
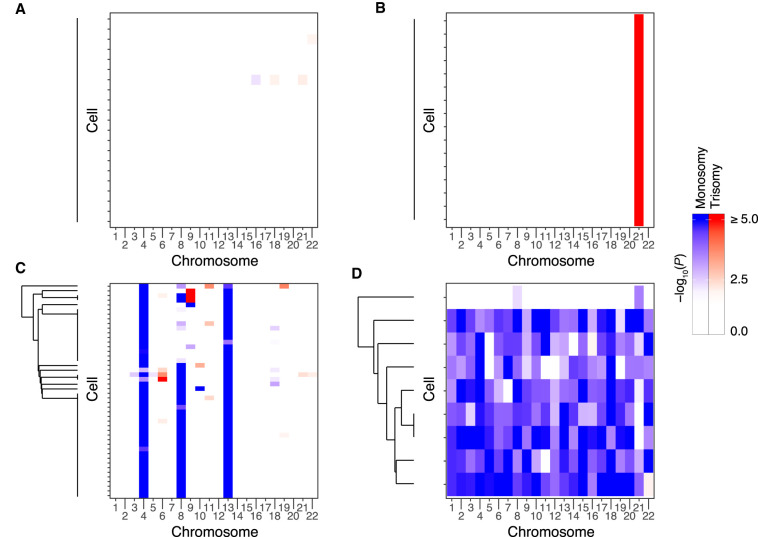
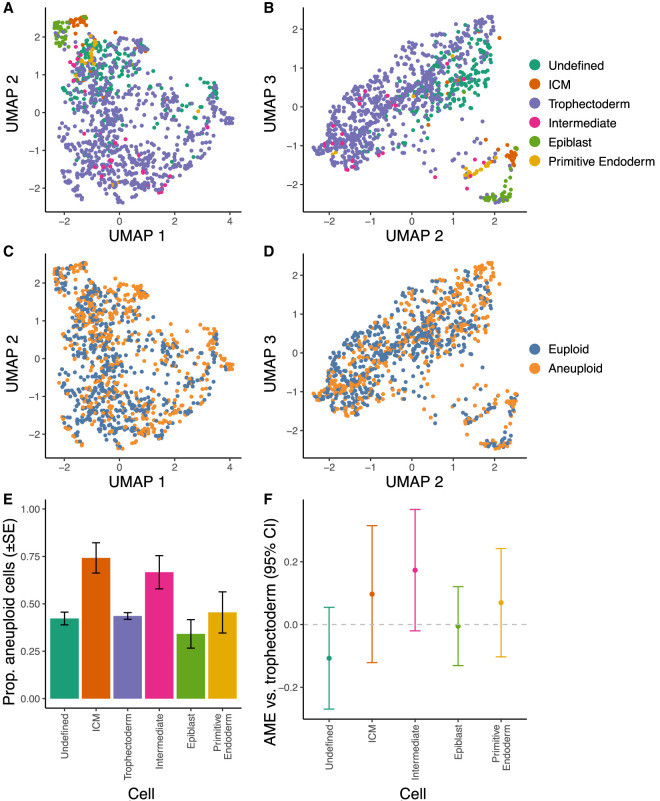
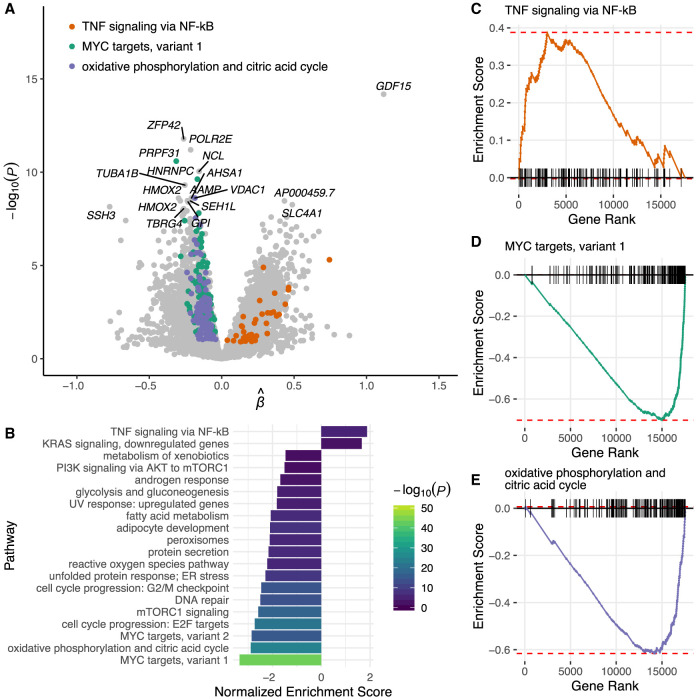
Less than half of human zygotes survive to birth, primarily due to aneuploidies of meiotic or mitotic origin. Mitotic errors generate chromosomal mosaicism, defined by multiple cell lineages with distinct chromosome complements. The incidence and impacts of mosaicism in human embryos remain controversial, with most previous studies based on bulk DNA assays or comparisons of multiple biopsies of few embryonic cells. Single-cell genomic data provide an opportunity to quantify mosaicism on an embryo-wide scale. To this end, we extended an approach to infer aneuploidies based on dosage-associated changes in gene expression by integrating signatures of allelic imbalance. We applied this method to published single-cell RNA sequencing data from 74 human embryos, spanning the morula to blastocyst stages. Our analysis revealed widespread mosaic aneuploidies, with 59 of 74 (80%) embryos harboring at least one putative aneuploid cell (1% FDR). By clustering copy number calls, we reconstructed histories of chromosome segregation, inferring that 55 (74%) embryos possessed mitotic aneuploidies and 23 (31%) embryos possessed meiotic aneuploidies. We found no significant enrichment of aneuploid cells in the trophectoderm compared to the inner cell mass, although we do detect such enrichment in data from later postimplantation stages. Finally, we observed that aneuploid cells up-regulate immune response genes and down-regulate genes involved in proliferation, metabolism, and protein processing, consistent with stress responses documented in other stages and systems. Together, our work provides a high-resolution view of aneuploidy in preimplantation embryos, and supports the conclusion that low-level mosaicism is a common feature of early human development.
Overview
The claims and statistics of this paper haven’t been checked yet.
Run the check — free, no account needed. It reads the open-access text and checks the sources it cites.
Integrity signals
Registry
Cites
Statistics
Figures
Verification
Claims the paper makes
The claims and statistics of this paper haven’t been checked yet.
Run the check — free, no account needed. It reads the open-access text and checks the sources it cites.
Claims other papers make about this one
Each is checked against this paper’s own text: does it say what the citing paper says it does?
The cited source says what the claim attributes to it.
In the citing paper
“Recently, even aneuploidy and mosaicism were found to be frequent occurrences in early-stage human embryos (Starostik, Sosina, and McCoy 2020).”
From Initial heritable genome editing: mapping a responsible pathway from basic research to the clinic (2023) · cites this paper as Starostik, Sosina, and McCoy 2020
Self-check
Percentages, sums and reported differences re-computed from the paper’s own numbers.
The self-check needs the paper’s full text.
Citations
Cites
Fitting Linear Mixed-Effects Models Using lme4
Bates, D., Mächler, M., Bolker, B., & Walker, S. (2015) · Journal of Statistical Software · doi:10.18637/jss.v067.i01 · Cited by 86,835
Subramanian, A., Tamayo, P., Mootha, V. K., Mukherjee, S., Ebert, B. L., Gillette, M. A., Paulovich, A., Pomeroy, S. L., Golub, T. R., Lander, E. S., et al. (2005) · Proceedings of the National Academy of Sciences · doi:10.1073/pnas.0506580102 · Cited by 53,625
The Molecular Signatures Database Hallmark Gene Set Collection
Liberzon, A., Birger, C., Thorvaldsdóttir, H., Ghandi, M., Mesirov, J. P., & Tamayo, P. (2015) · Cell Systems · doi:10.1016/j.cels.2015.12.004 · Cited by 13,807
Trapnell, C., Cacchiarelli, D., Grimsby, J., Pokharel, P., Li, S., Morse, M., Lennon, N. J., Livak, K. J., Mikkelsen, T. S., & Rinn, J. L. (2014) · Nature Biotechnology · doi:10.1038/nbt.2859 · Cited by 7,314
A practical guide to single-cell RNA-sequencing for biomedical research and clinical applications
Haque, A., Engel, J., Teichmann, S. A., & Lönnberg, T. (2017) · Genome Medicine · doi:10.1186/s13073-017-0467-4 · Cited by 1,071
Kempf, T., Eden, M., Strelau, J., Naguib, M., Willenbockel, C., Tongers, J., Heineke, J., Kotlarz, D., Xu, J., Molkentin, J. D., et al. (2006) · Circulation Research · doi:10.1161/01.res.0000202805.73038.48 · Cited by 651
Tools and best practices for data processing in allelic expression analysis.
Castel, S. E., Levy-Moonshine, A., Mohammadi, P., Banks, E., & Lappalainen, T. (2015) · Genome Biology · doi:10.1186/s13059-015-0762-6 · Cited by 375 · cited 3×
“Using embryo-level heterozygous SNPs and corresponding single-cell alignments as input, allelic read counts were then computed at every heterozygous SNP in every cell using the ASEReadCounter tool of GATK.”
MethodInfluentialSCnorm: robust normalization of single-cell RNA-seq data
Bacher, R., Chu, L.-F., Leng, N., Gasch, A. P., Thomson, J. A., Stewart, R. M., Newton, M., & Kendziorski, C. (2017) · Nature Methods · doi:10.1038/nmeth.4263 · Cited by 282
Research works printed but not linked: 54
- 10.1111/j.2517-6161.1995.tb02031.x · DOI · Paper page
- Bogomolov M , Peterson CB , Benjamini Y , Sabatti C . 2017. Testing hypotheses on a tree: new error rates and controlling strategies. arXiv :1705.07529v2 [stat.ME]. · arXiv
- 10.1038/ncomms11165 · DOI
- 10.1093/humrep/dew250 · DOI
- 10.1371/journal.pgen.1008414 · DOI
- 10.1016/j.rbmo.2019.06.012 · DOI
- 10.1007/s00441-015-2305-6 · DOI
- 10.1101/gr.239830.118 · DOI
- 10.1101/gr.200527.115 · DOI
- 10.1093/bioinformatics/bts635 · DOI · Paper page
- 10.1186/1471-2164-15-139 · DOI
- 10.1101/gr.228080.117 · DOI
- 10.1016/j.tig.2005.02.012 · DOI
- 10.1186/s12958-017-0251-8 · DOI
- 10.1093/humrep/deg060 · DOI
- 10.1056/NEJMc1500421 · DOI
- 10.1186/s12864-017-4253-x · DOI
- 10.1101/gr.252981.119 · DOI · Paper page
- 10.1038/35066065 · DOI
- 10.1242/dev.145318 · DOI
- 10.1038/s41598-018-20614-8 · DOI
- 10.1101/060012 · DOI
- 10.1007/s10815-017-1060-x · DOI
- 10.1093/bioinformatics/btp352 · DOI · Paper page
- 10.1038/s41598-018-33279-0 · DOI
- 10.1038/sigtrans.2017.23 · DOI · Paper page
- 10.1038/s41586-018-0321-x · DOI · Paper page
- 10.1038/nmeth.3370 · DOI · Paper page
- 10.1016/j.tig.2017.04.001 · DOI · Paper page
- 10.1126/science.aaa3337 · DOI
- 10.1371/journal.pgen.1005601 · DOI
- 10.1101/gr.107524.110 · DOI · Paper page
- 10.1093/humrep/dez242 · DOI
- 10.1016/j.ajhg.2018.10.007 · DOI
- 10.1038/ng.3306 · DOI
- 10.1038/s41598-017-09693-1 · DOI
- 10.1016/j.cell.2016.03.023 · DOI · Paper page
- 10.1016/j.fertnstert.2018.06.002 · DOI
- 10.1016/j.fertnstert.2019.01.023 · DOI
- 10.1016/j.devcel.2017.05.022 · DOI
- 10.1073/pnas.1209227109 · DOI
- 10.1002/stem.1509 · DOI
- 10.1038/nmeth.4612 · DOI · Paper page
- 10.1242/dev.169672 · DOI
- 10.1371/journal.pone.0195905 · DOI
- 10.1038/s41586-019-1187-2 · DOI
- 10.1093/humrep/dex286 · DOI
- 10.1038/nm.1924 · DOI · Paper page
- 10.1530/REP-17-0569 · DOI
- 10.1038/ncomms8601 · DOI
- 10.1038/s41598-019-39111-7 · DOI
- 10.1038/s41591-019-0620-2 · DOI
- 10.1038/s41586-019-1500-0 · DOI
- 10.1038/s41588-017-0007-6 · DOI
Cited by
Sorted by citations
The changing face of Turner syndrome
Gravholt, C. H., Viuff, M., Just, J., Sandahl, K., Brun, S., van der Velden, J., Andersen, N. H., & Skakkebaek, A. (2023) · Endocrine Reviews · doi:10.1210/endrev/bnac016 · Cited by 149
Initial heritable genome editing: mapping a responsible pathway from basic research to the clinic
Ranisch, R., Trettenbach, K., & Arnason, G. (2023) · Medicine, Health Care and Philosophy · doi:10.1007/s11019-022-10115-x · Cited by 19
Metadata
- Authors
- Starostik, M. R., Sosina, O. A., & McCoy, R. C.
- Venue
- Genome Research
- Publisher
- Cold Spring Harbor Laboratory
- Published
- 2020-06
- Volume
- 30
- Issue
- 6
- Pages
- 814-825
- ISSN
- 1088-9051
- 1549-5469
- PMC
- PMC7370883
- Cited by
- 155
- References
- 8
- Language
- en
- Funders
- National Institutes of Health (R35GM133747)
About these checks
Registry, retraction, Cites and statistics results are computed, not judged, with one exception: a printed reference that no index lists is read once by a model before it counts as a citation error. Claims are extracted by a model and kept only when their quote appears verbatim in the text; each cited source is then checked, with a model’s help, for whether it says what the claim relies on. Those verdicts can be wrong — read the claim’s quote and the cited source before relying on one.
Statistics and arithmetic are recomputed, not judged.
Confidence bands are shown only for fields calibrated on our annotated test set. None is calibrated yet, so no band is shown.
What counts as a claim ›How we measure confidence ›How we check this ›
Are you an author, or do you see a problem with this page? Request a review
