

The DOI matches its Crossref record; 66 of the 67 references it cites were found in a registry or an index.
Modern Artificial Intelligence Model Development for Undergraduate Student Performance Prediction: An Investigation on Engineering Mathematics Courses
Open accessAbstract
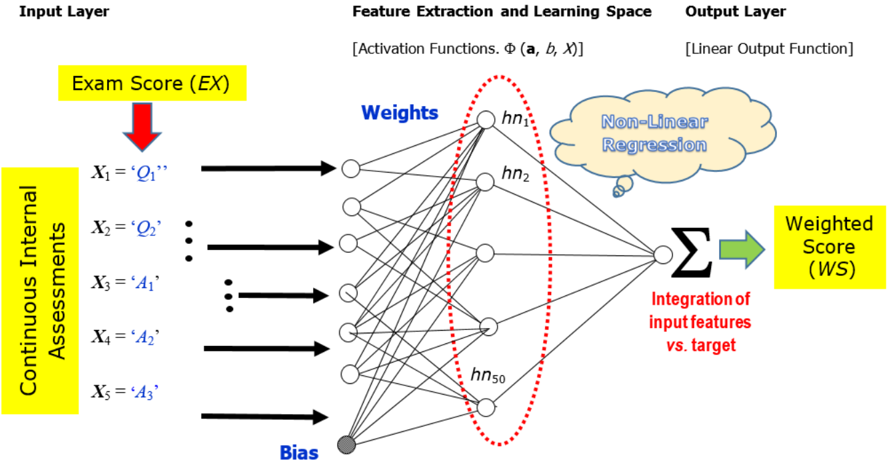
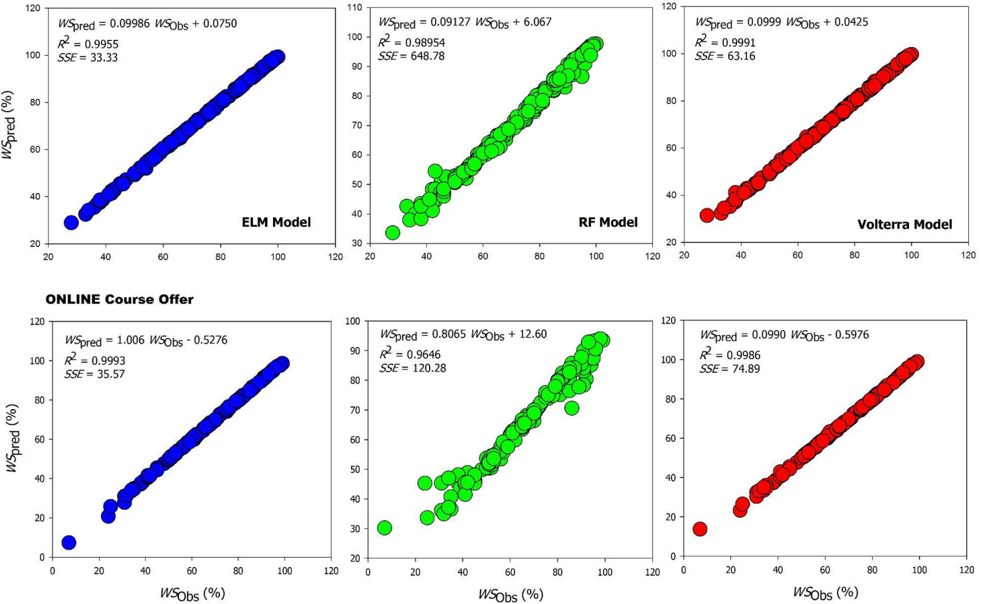
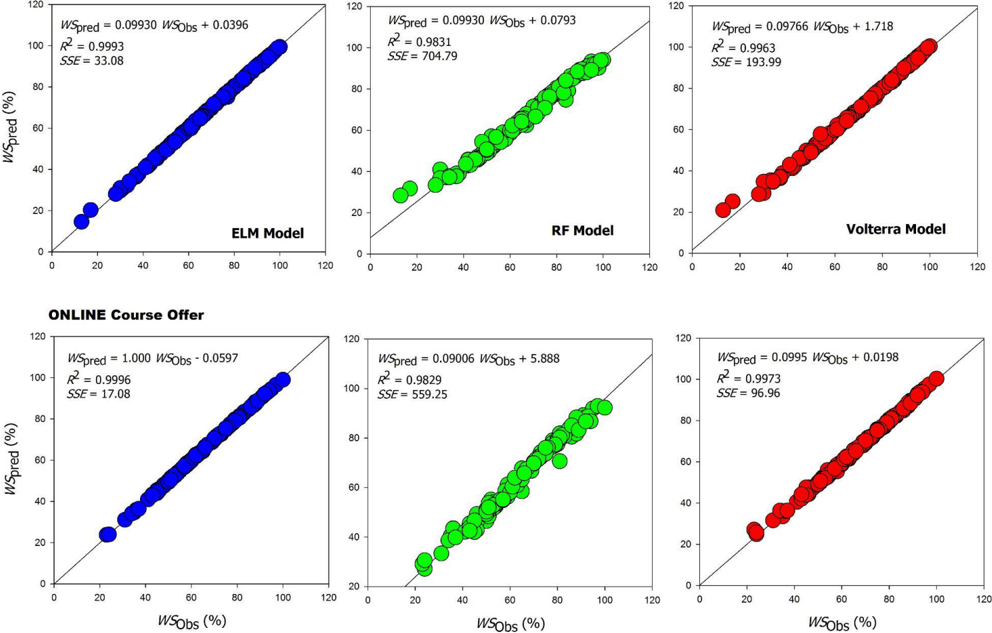
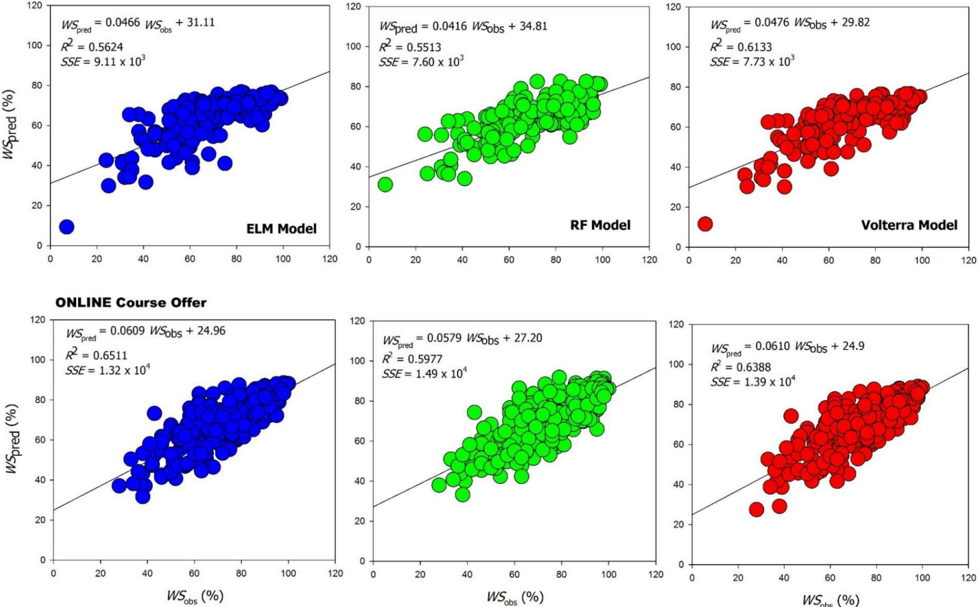
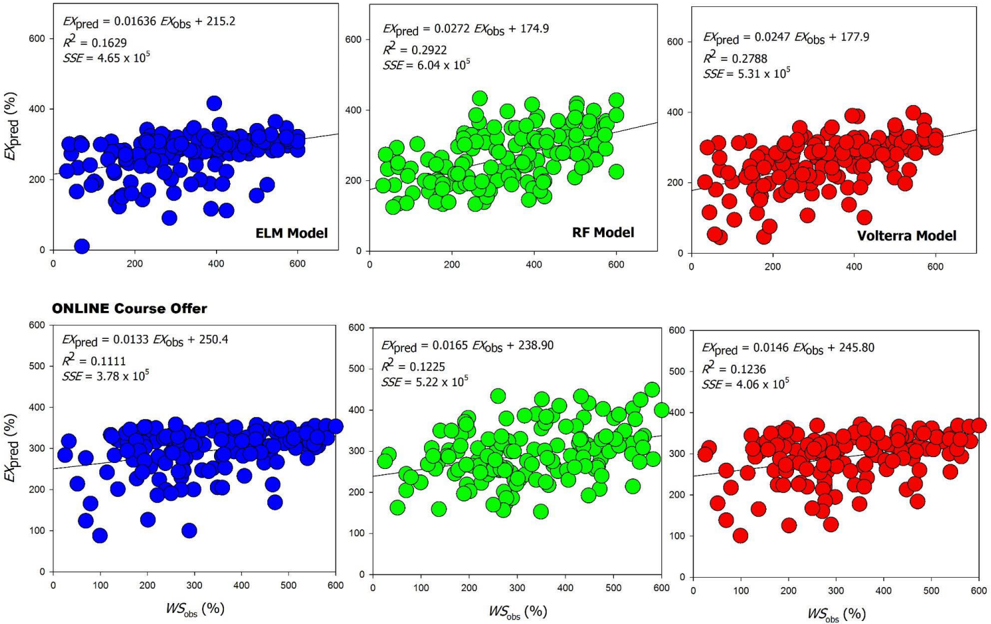
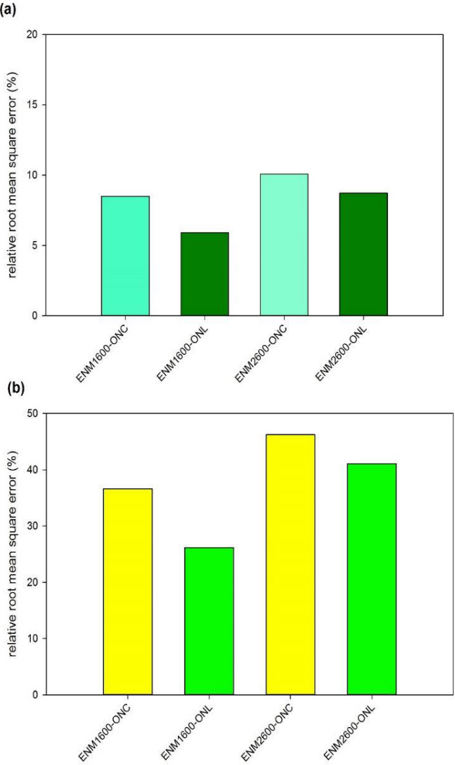
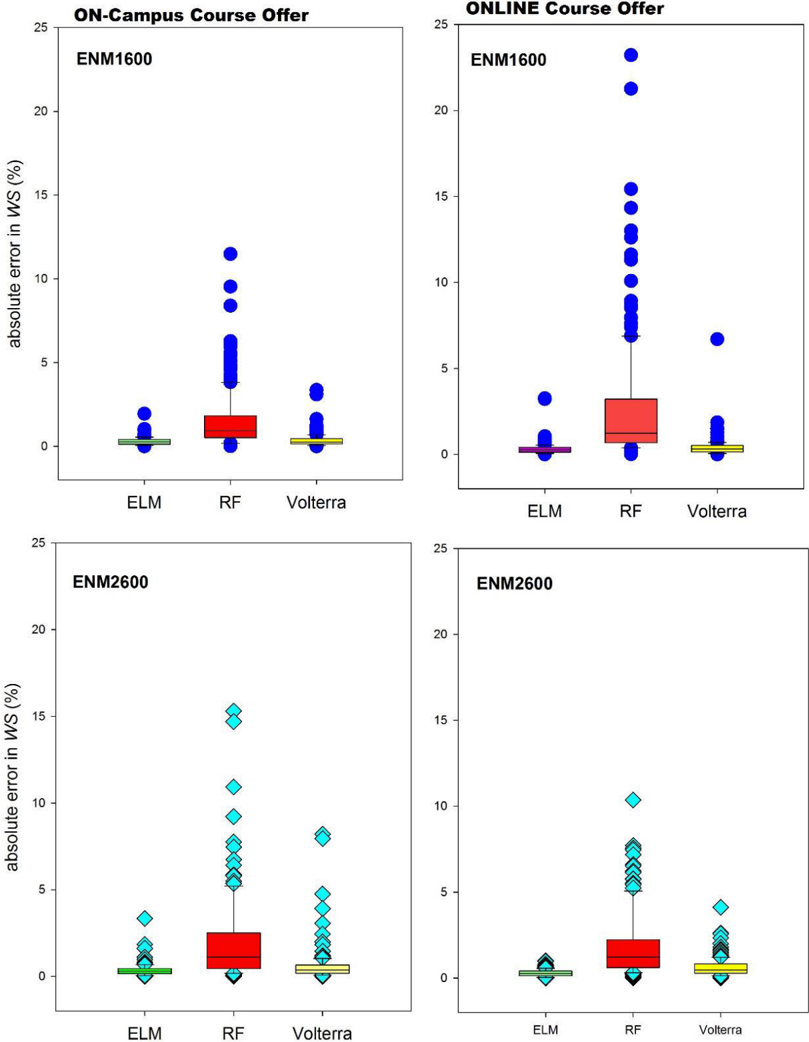
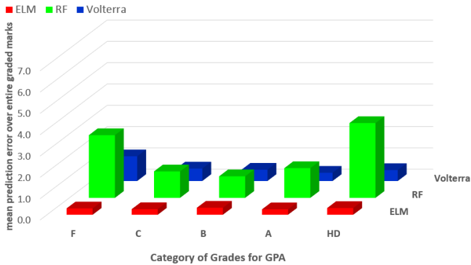
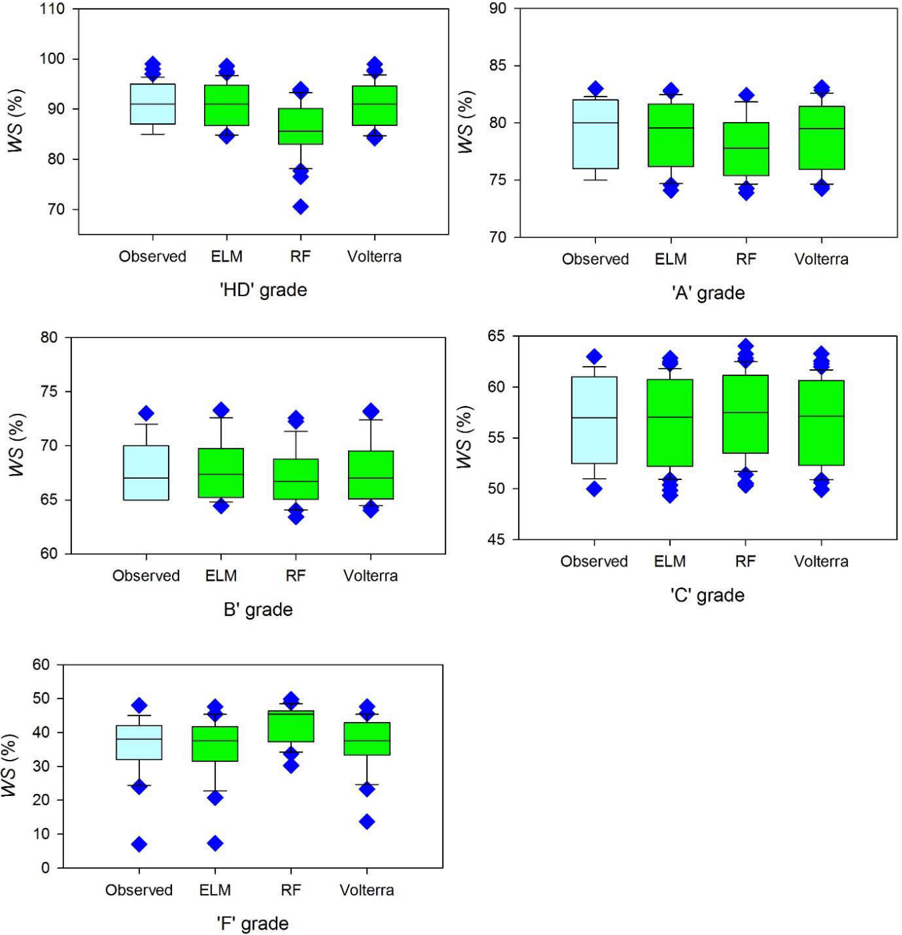
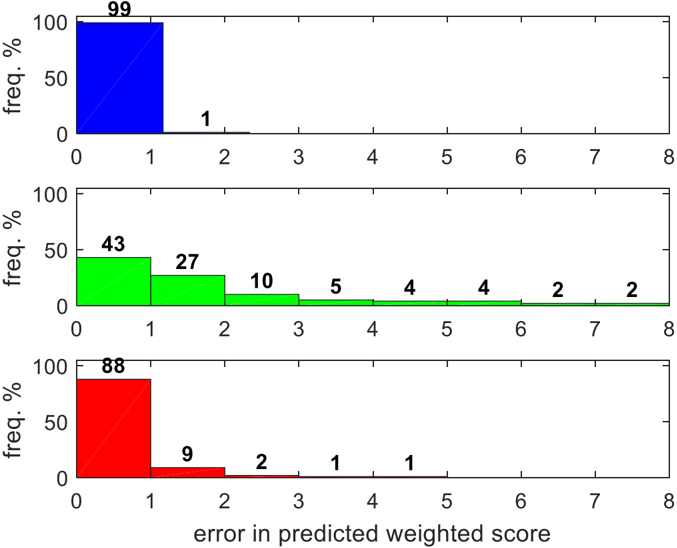
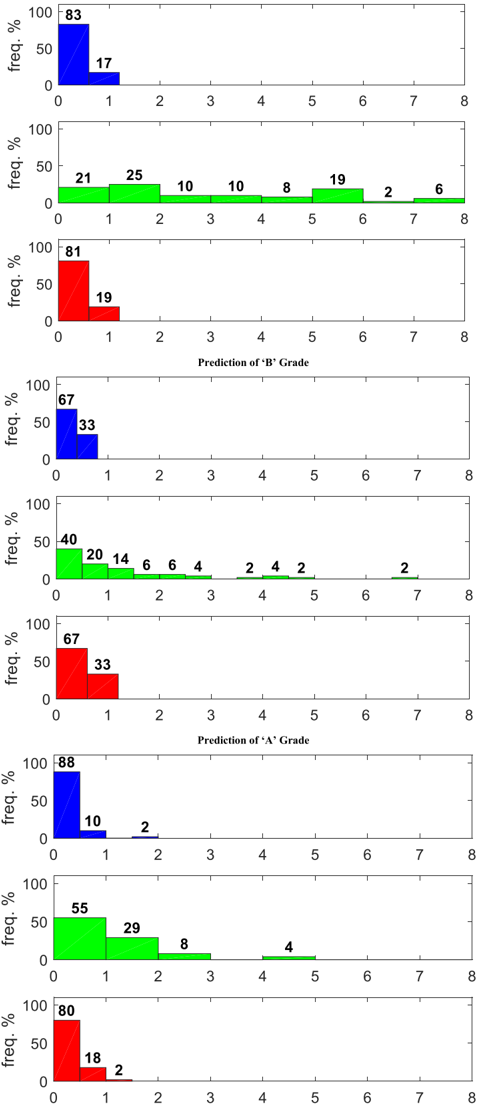
A computationally efficient artificial intelligence (AI) model called Extreme Learning Machines (ELM) is adopted to analyze patterns embedded in continuous assessment to model the weighted score (WS) and the examination (EX) score in engineering mathematics courses at an Australian regional university. The student performance data taken over a six-year period in multiple courses ranging from the mid- to the advanced level and a diverse course offering mode (i.e., on-campus, ONC, and online, ONL) are modelled by ELM and further benchmarked against competing models: random forest (RF) and Volterra. With the assessments and examination marks as key predictors of WS (leading to a grade in the mid-level course), ELM (with respect to RF and Volterra) outperformed its counterpart models both for the ONC and the ONL offer. This generated relative prediction error in the testing phase, of only 0.74%, compared to about 3.12% and 1.06%, respectively, while for the ONL offer, the prediction errors were only 0.51% compared to about 3.05% and 0.70%. In modelling the student performance in advanced engineering mathematics course, ELM registered slightly larger errors: 0.77% (vs. 22.23% and 1.87%) for ONC and 0.54% (vs. 4.08% and 1.31%) for the ONL offer. This study advocates a pioneer implementation of a robust AI methodology to uncover relationships among student learning variables, developing teaching and learning intervention and course health checks to address issues related to graduate outcomes, and student learning attributes in the higher education sector.
Overview
The claims and statistics of this paper haven’t been checked yet.
Free: it reads the open-access text and checks the first 5 claims that cite a source we can check. Create a free account to check every claim.
Integrity signals
Registry
Cites
Statistics
Figures








Verification
Claims the paper makes
The claims and statistics of this paper haven’t been checked yet.
Free: it reads the open-access text and checks the first 5 claims that cite a source we can check. Create a free account to check every claim.
Self-check
Percentages, sums and reported differences re-computed from the paper’s own numbers.
The self-check needs the paper’s full text.
Citations
Cites
Breiman, L. (2001) · Machine Learning · doi:10.1023/a:1010933404324 · Cited by 133,538
Extreme learning machine: Theory and applications
Huang, G.-B., Zhu, Q.-Y., & Siew, C.-K. (2006) · Neurocomputing · doi:10.1016/j.neucom.2005.12.126 · Cited by 13,285
Chai, T., & Draxler, R. R. (2014) · Geoscientific Model Development · doi:10.5194/gmd-7-1247-2014 · Cited by 8,761 · cited 1×
“the relative prediction error (%), given mathematically as follows [54], [55], (15)–(22), as shown at the bottom of the page, whereWSObs andWSPred were the observed and the predicted ith value of WS; WSObs and WSPred were the observed and forecasted mean WS in testing phase; and N was the number of datum points in the…”
BackgroundThe role of artificial intelligence in achieving the Sustainable Development Goals
Vinuesa, R., Azizpour, H., Leite, I., Balaam, M., Dignum, V., Domisch, S., Felländer, A., Langhans, S. D., Tegmark, M., & Fuso Nerini, F. (2020) · Nature Communications · doi:10.1038/s41467-019-14108-y · Cited by 3,294
Universal Approximation using Incremental Constructive Feedforward Networks with Random Hidden Nodes
Huang, G.-B., Chen, L., & Siew, C.-K. (2006) · IEEE Transactions on Neural Networks · doi:10.1109/tnn.2006.875977 · Cited by 2,614
A Fast and Accurate Online Sequential Learning Algorithm for Feedforward Networks
Liang, N.-Y., Huang, G.-B., Saratchandran, P., & Sundararajan, N. (2006) · IEEE Transactions on Neural Networks · doi:10.1109/tnn.2006.880583 · Cited by 1,965
Penetrating the Fog: Analytics in Learning and Education.
Siemens, G., & Long, P. (2011) · Adelaide Research & Scholarship (AR&S) (University of Adelaide) · Cited by 1,752
Trends in extreme learning machines: A review
Huang, G., Huang, G.-B., Song, S., & You, K. (2015) · Neural Networks · doi:10.1016/j.neunet.2014.10.001 · Cited by 1,732
Machine Learning Benchmarks and Random Forest Regression
Segal, M. R. (2004) · eScholarship (California Digital Library) · Cited by 1,250
On big data, artificial intelligence and smart cities
Allam, Z., & Dhunny, Z. A. (2019) · Cities · doi:10.1016/j.cities.2019.01.032 · Cited by 1,178
Research works printed but not linked: 5
- calvo-flores, 2006, Predicting students’ marks from Moodle logs using neural network models, Current Develop Technol Edu, 1, 586
- bhatt, 2011, Fuzzy logic based student performance evaluation model for practical components of engineering institutions subjects, International Journal of Technology and Engineering Education, 8, 1
- 2019, Study Book (ENM2600 Engineering Mathematics
- 2019, Study Book (ENM1600 Engineering Mathematics)
- 2017, The Higher Education Reform Package
Cited by
Artificial Intelligence for Student Assessment: A Systematic Review
González-Calatayud, V., Prendes-Espinosa, P., & Roig-Vila, R. (2021) · Applied Sciences · doi:10.3390/app11125467 · Cited by 503
“[48] determine that AI could be incorporated as a subcategory of intelligent algorithms implemented in stand-alone models, or within a hybrid integrated computer systems model.”
BackgroundThe application of AI technologies in STEM education: a systematic review from 2011 to 2021
Xu, W., & Ouyang, F. (2022) · International Journal of STEM Education · doi:10.1186/s40594-022-00377-5 · Cited by 495
Artificial intelligence in educational leadership: a comprehensive taxonomy and future directions
Sposato, M. (2025) · International Journal of Educational Technology in Higher Education · doi:10.1186/s41239-025-00517-1 · Cited by 260
Owoc, M. L., Sawicka, A., & Weichbroth, P. (2021) · IFIP Advances in Information and Communication Technology · doi:10.1007/978-3-030-85001-2_4 · Cited by 222
Artificial Intelligence and Machine Learning Approaches in Digital Education: A Systematic Revision
Munir, H., Vogel, B., & Jacobsson, A. (2022) · Information · doi:10.3390/info13040203 · Cited by 165
Metadata
- Authors
- Deo, R. C., Yaseen, Z. M., Al-Ansari, N., Nguyen-Huy, T., Langlands, T. A. M., & Galligan, L.
- Affiliations
- University of Southern Queensland (AU)
- Luleå University of Technology (SE)
- ORCID
- Venue
- IEEE Access
- Published
- 2020
- Volume
- 8
- Pages
- 136697-136724
- ISSN
- 2169-3536 (ISSN-L)
- OpenAlex
- W3044093562
- Cited by
- 89
- References
- 67
- Citations by year
- 2026: 8 · 2025: 27 · 2024: 16 · 2023: 12 · 2022: 16 · 2021: 8 · 2020: 1
- FWCI
- 8.45
- Type
- journal article
- Language
- en
- Open access
- gold
- doi.org
- Locations
- IEEE Access (publishedVersion, cc-by)
- Epubl LTU (submittedVersion, other-oa)
- DOAJ (DOAJ: Directory of Open Access Journals) (submittedVersion, cc-by-sa)
- Funders
- University of Southern Queensland, through the School of Sciences Quartile 1 Challenge Internal Grant, for this research study under Grant 2018
- Office for the Advancement of Learning and Teaching: Technology Demonstrator Project (H18REA236)
- Topics
- Physical Sciences › Computer Science › Computer Science Applications › Online Learning and Analytics
- Physical Sciences › Computer Science › Artificial Intelligence › Machine Learning and ELM
- Social Sciences › Education › Educational Technology and Pedagogy
- Keywords
- student performance prediction, extreme learning machine, continuous assessment, test scores, online learning, on-campus learning, random forest, Volterra model, higher education
About these checks
Registry, retraction, Cites and statistics results are computed, not judged, with one exception: a printed reference that no index lists is read once by a model before it counts as a citation error. Claims are extracted by a model and kept only when their quote appears verbatim in the text; each cited source is then checked, with a model’s help, for whether it says what the claim relies on. Those verdicts can be wrong — read the claim’s quote and the cited source before relying on one.
Statistics and arithmetic are recomputed, not judged.
Confidence bands are shown only for fields calibrated on our annotated test set. None is calibrated yet, so no band is shown.
What counts as a claim ›How we measure confidence ›How we check this ›
Are you an author, or do you see a problem with this page? Request a review
How to cite
Cite CoChat for the checks on this page, and the paper for its own findings.
- This page
- CoChat. (2026). Citation check: Modern Artificial Intelligence Model Development for Undergraduate Student Performance Prediction: An Investigation on Engineering Mathematics Courses. https://app.cochat.ai/papers/10.1109/access.2020.3010938
- The paper
- Deo, R. C., Yaseen, Z. M., Al-Ansari, N., Nguyen-Huy, T., Langlands, T. A. M., & Galligan, L. (2020). Modern Artificial Intelligence Model Development for Undergraduate Student Performance Prediction: An Investigation on Engineering Mathematics Courses. IEEE Access. https://doi.org/10.1109/access.2020.3010938
Data sources
Bibliographic data: Semantic Scholar, OpenAlex, Crossref.
Contains information from the Semantic Scholar Academic Graph Datasets, made available under the ODC Attribution License (ODC-BY 1.0).
Semantic Scholar’s data is described in: Kinney, R., et al. (2023). The Semantic Scholar Open Data Platform. arXiv:2301.10140.
