

Explainable Artificial Intelligence for Tabular Data: A Survey
Open accessThe DOI matches its Crossref record; 236 of the 241 references it cites were found in a registry or an index.
Abstract
Machine learning techniques are increasingly gaining attention due to their widespread use in various disciplines across academia and industry. Despite their tremendous success, many such techniques suffer from the “black-box” problem, which refers to situations where the data analyst is unable to explain why such techniques arrive at certain decisions. This problem has fuelled interest in Explainable Artificial Intelligence (XAI), which refers to techniques that can easily be interpreted by humans. Unfortunately, many of these techniques are not suitable for tabular data, which is surprising given the importance and widespread use of tabular data in critical applications such as finance, healthcare, and criminal justice. Also surprising is the fact that, despite the vast literature on XAI, there are still no survey articles to date that focus on tabular data. Consequently, despite the existing survey articles that cover a wide range of XAI techniques, it remains challenging for researchers working on tabular data to go through all of these surveys and extract the techniques that are suitable for their analysis. Our article fills this gap by providing a comprehensive and up-to-date survey of the XAI techniques that are relevant to tabular data. Furthermore, we categorize the references covered in our survey, indicating the type of the model being explained, the approach being used to provide the explanation, and the XAI problem being addressed. Our article is the first to provide researchers with a map that helps them navigate the XAI literature in the context of tabular data.
Overview
The claims and statistics of this paper haven’t been checked yet.
Free: it reads the open-access text and checks the first 5 claims that cite a source we can check. Create a free account to check every claim.
Integrity signals
Registry
Cites
Statistics
Figures

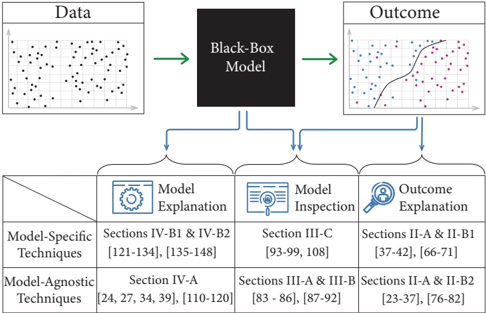
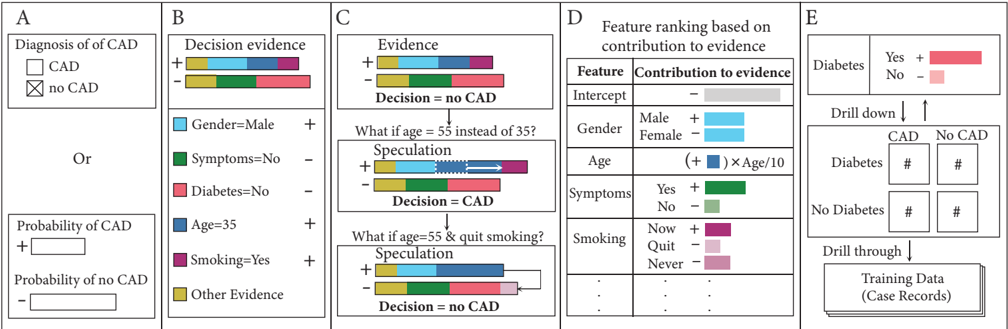
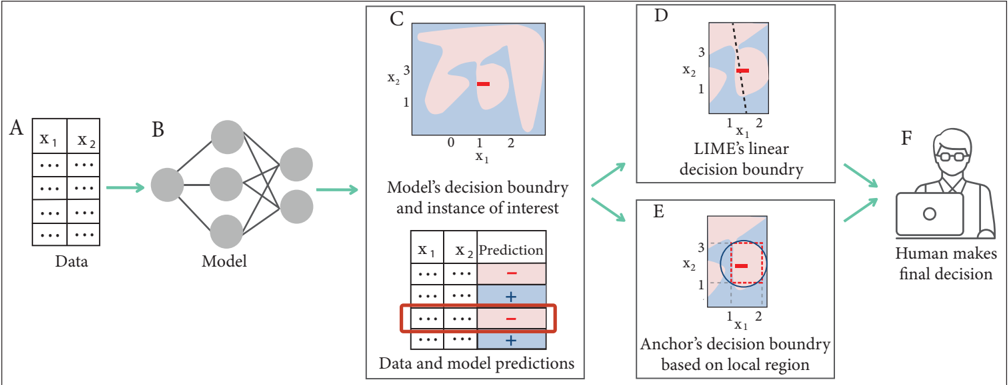
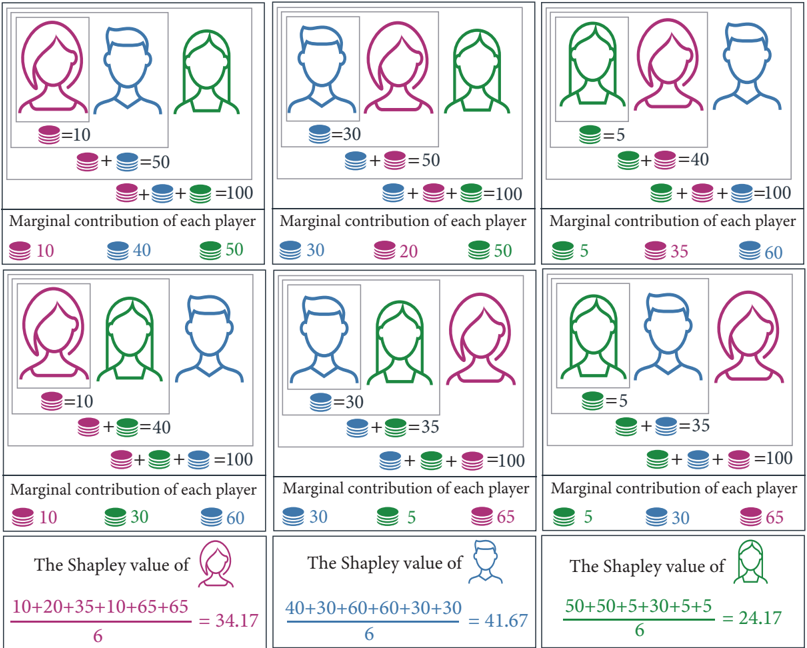




Verification
Claims the paper makes
The claims and statistics of this paper haven’t been checked yet.
Free: it reads the open-access text and checks the first 5 claims that cite a source we can check. Create a free account to check every claim.
Self-check
Percentages, sums and reported differences re-computed from the paper’s own numbers.
The self-check needs the paper’s full text.
Citations
Cites
A fast and elitist multiobjective genetic algorithm: NSGA-II
Deb, K., Pratap, A., Agarwal, S., & Meyarivan, T. (2002) · IEEE Transactions on Evolutionary Computation · doi:10.1109/4235.996017 · Cited by 50,053 · cited 2×
“They use the Nondominated Sorting Genetic Algorithm [100] with some modifications to solve the multi-level optimization problem.”
Greedy function approximation: A gradient boosting machine
Friedman, J. H. (2001) · The Annals of Statistics · doi:10.1214/aos/1013203451 · Cited by 30,731 · cited 2×
“Examples of black-box models include artificial neural networks [18] and gradient boosting [19].”
BackgroundMethodGrad-CAM: Visual Explanations from Deep Networks via Gradient-Based Localization
Selvaraju, R. R., Cogswell, M., Das, A., Vedantam, R., Parikh, D., & Batra, D. (2017) · 2017 IEEE International Conference on Computer Vision (ICCV) · doi:10.1109/iccv.2017.74 · Cited by 24,513
A Unified Approach to Interpreting Model Predictions
Lundberg, S., & Lee, S.-I. (2017) · arXiv · doi:10.48550/arxiv.1705.07874 · Cited by 23,707 · cited 1×
“Another, more recent framework that builds on the Shap-ley value was proposed by Lundberg and Lee [37].”
BackgroundNeural networks and physical systems with emergent collective computational abilities.
Hopfield, J. J. (1982) · Proceedings of the National Academy of Sciences · doi:10.1073/pnas.79.8.2554 · Cited by 19,270 · cited 1×
“Examples of black-box models include artificial neural networks [18] and gradient boosting [19].”
Background"Why Should I Trust You?": Explaining the Predictions of Any Classifier
Ribeiro, M. T., Singh, S., & Guestrin, C. (2016) · Proceedings of the 22nd ACM SIGKDD International Conference on Knowledge Discovery and Data Mining · doi:10.1145/2939672.2939778 · Cited by 17,555 · cited 4×
“Starting with SP-LIME [24], it takes a representative sample set from the input data and computes the LIME coefficients for all instances in that set, thereby providing a global view of the ML model’s decision boundary.”
MethodInfluentialHosmer, D. W., Lemeshow, S., & Sturdivant, R. X. (2013) · Wiley Series in Probability and Statistics · doi:10.1002/9781118548387 · Cited by 13,861
Gauriat, C.-M., Pencolé, Y., Ribot, P., & Brouillet, G. (2024) · HAL (Le Centre pour la Communication Scientifique Directe) · doi:10.4230/oasics.dx.2024.27 · Cited by 12,586
Rudin, C. (2019) · Nature Machine Intelligence · doi:10.1038/s42256-019-0048-x · Cited by 10,561 · cited 3×
“Unlike transparent models, black-box models are those that do not explain their predictions in a way that humans can understand [17].”
BackgroundFrom local explanations to global understanding with explainable AI for trees
Lundberg, S. M., Erion, G., Chen, H., DeGrave, A., Prutkin, J. M., Nair, B., Katz, R., Himmelfarb, J., Bansal, N., & Lee, S.-I. (2020) · Nature Machine Intelligence · doi:10.1038/s42256-019-0138-9 · Cited by 10,551 · cited 3×
“Extending their work, Lundberg et al. [39], [65] proposed SHAP interaction values that directly measure local feature interaction effects.”
Method
Research works printed but not linked: 6
- T. Wang, C. Rudin, F. Doshi-Velez, Y. Liu, E. Klampfl, and P. MacNeille, "A Bayesian framework for learning rule sets for interpretable classifica- tion," Journal of Machine Learning Research, vol. 18, no. 1, pp. 2357- 2393, 2017.
- C. Molnar, "Interpretable machine learning: A guide for making black box models explainable.(2019)," URL https://christophm. github. io/interpretable-ml-book, 2019.
- "Providing explainable ai through advanced knowledge graphs." https: //kyndi.com/wp-content/uploads/2018/03/Cognilytica-Briefing-Note_ Kyndi.pdf. Accessed: 18.07.2021.
- 225"Explainable machine learning challenge." https://community.fico.com/ s/explainable-machine-learning-challenge. Accessed: 06.07.2021.
- H. A. Chipman, E. I. George, and R. E. McCulloh, "Making sense of a forest of trees," Computing Science and Statistics, pp. 84-92, 1998.
- J. Angwin, J. Larson, S. Mattu, and L. Kirchner, "Machine bias: There's software used across the country to predict future crimi- nals. And it's biased against blacks." https://www.propublica.org/article/ machine-bias-risk-assessments-in-criminal-sentencing, 2016.
Cited by
Items 101–136 of 136
Ustin, P. N., Gafarov, F. M., & Berdnikov, A. (2023) · OBM Neurobiology · doi:10.21926/obm.neurobiol.2303180 · Cited by 1
DSS for blockchain technology using explainable multiagent system
Dhatterwal, J. S., & Kaswan, K. S. (2024) · Elsevier eBooks · doi:10.1016/b978-0-323-95315-3.00001-2 · Cited by 1
Learning Performance Maximizing Ensembles with Explainability Guarantees
Pisztora, V., & Li, J. (2024) · Proceedings of the AAAI Conference on Artificial Intelligence · doi:10.1609/aaai.v38i13.29378 · Cited by 1
Tabular Data Insights and Synthesis with the AutoTable Approach
Spillner, J. (2022) · IEEE Swiss Conference on Data Science (SDS) · doi:10.1109/sds54800.2022.00020
“Tabular data, including timeseries and relational data, has recently attracted the interest of researchers concerned with explainable AI (XAI) who noticed a gap between the focus on tabular engineering, and many XAI techniques not applicable to such formats despite dominance in businesses, especially SMEs [3].”
BackgroundUtkin, L. V., Krylova, J. Y., & Konstantinov, A. V. (2023) · Russian Journal for Personalized Medicine · doi:10.18705/2782-3806-2022-2-6-23-32
Interpretable Neural Network Models in School Teacher Success Prediction
Gafarov, F. M., Minullin, D. A., & Ustin, P. N. (2024) · Lecture notes in networks and systems · doi:10.1007/978-3-031-51521-7_18
Nagashruthi, M. K., Hemanth, K. S., & Buhari, S. M. (2024) · Research Square · doi:10.21203/rs.3.rs-3934081/v1
Sharmila, S. P., Gupta, S., Tiwari, A., & Chaudhari, N. S. (2024) · SSRN Electronic Journal · doi:10.2139/ssrn.4866513
Tatout, F., & Dugoin-Clément, C. (2024) · Lecture notes in computer science · doi:10.1007/978-3-031-62139-0_17 · Cited by 1
Towards a Novel Classification of Table Types in Scholarly Publications
He, J., Borisova, E., & Rehm, G. (2024) · Lecture notes in computer science · doi:10.1007/978-3-031-65794-8_3 · Cited by 2
Explainable Feature Ranking Using Interactive Dashboards
Amorim, D., Pato, M. P. M., & Datia, N. (2024) · International Conference on Information Visualisation (IV) · doi:10.1109/iv64223.2024.00050
“…explore the concept of explainability in different areas of AI, such as methods applied to Deep Learning (DL) [12], applying it to tabular data [13], used in Graph Neural Network (GNN) [14], for categorical and mixed data [15], or studying how do practitioners evaluate software artefacts,…”
MethodUnveiling the black box: Enhancing transparency in deep learning through explainable AI
Tingare, B. A., -, P. U., -, A. C., & -, A. K. (2025) · AIP conference proceedings · doi:10.1063/5.0254216
Sharma, P. K., & Krishnarth, N. (2025) · Wiley eBooks · doi:10.1002/9781394302444.ch9 · Cited by 1
Autonomous Droplet Microfluidic Design Framework with Large Language ModelsPreprint
Dinh, N., Nguyen, N., & Tong, R. K. (2025) · Research Square · doi:10.21203/rs.3.rs-6282521/v1
AI-Driven Modern Cybersecurity Approach: A Systematic Literature Review
Khan, Y. A., & Tufail, M. (2025) · Information systems engineering and management · doi:10.1007/978-3-031-81481-5_1
Symbolic regression approach for analytical modeling of ITU-R P.1546-6 propagation curves
de Oliveira, G. K., Haddad, D. B., Giraldi, G. A., & Dias, M. (2025) · Telecommunication Systems · doi:10.1007/s11235-025-01297-9 · Cited by 1
“Specifically, interpretation refers to the articulation of abstract concepts in terms that are comprehensible to humans, whereas explanation focuses on identifying the factors that have influenced the result of a specific instance [19].”
Predicting Mental Health Problems in Gay Men in Peru Using Machine Learning and Deep Learning Models
Aybar-Flores, A., & Espinoza-Portilla, E. (2025) · Informatics · doi:10.3390/informatics12030060 · Cited by 1
Designing an Interpretable and Efficient AutoML Pipeline for Enhanced Data Analytics
Hasan, I., & Tausif, M. (2025) · International Conference on Self Sustainable Artificial Intelligence Systems (ICSSAS) · doi:10.1109/icssas66150.2025.11081354
“As described by Sahakyan, Aung, and Rah-wan [9], LIME’s model-agnostic framework is well suited for analyzing complex, black-box models applied to tabular data.”
Johanesa, T. V. A., Equeter, L., Mahmoudi, S. A., & Dehombreux, P. (2025) · Communications in computer and information science · doi:10.1007/978-3-032-04339-9_21
Data-Efficient Tabular Classification with Transformer-Based Small Language Models
Haddad-Neto, M., Silva, D., CALIARI, Í. P., & Bragança, H. L. D. S. (2025) · Brazilian Symposium on Multimedia and the Web · doi:10.5753/webmedia.2025.15193
“Tabular data is ubiquitous in domains ranging from healthcare to climate and finance [19], it presents unique challenges such as mixed data types and limited features.”
Arpacı, S. A., & Varlı, S. (2025) · International Symposium on Multidisciplinary Studies and Innovative Technologies (ISMSIT) · doi:10.1109/ismsit67332.2025.11267865
“Many different proposals for explaining artificial intelligence models have been published to date [3], [23].”
Hidden Neuron Activation Analysis on Labeled Text Data
Das, A., Dalal, A., & Hitzler, P. (2025) · International Conference on Knowledge Capture · doi:10.1145/3731443.3771369
“XAI has also been applied to several studies on tabular data [24].”
Açıklanabilir kuantum destekli hibrit öğrenme ile meme kanseri sınıflandırması
Uysal, İ. (2025) · Gümüşhane Üniversitesi Fen Bilimleri Enstitüsü Dergisi · doi:10.17714/gumusfenbil.1715840
Infrastructure-Level Intelligence: Embedding AI into Data Movement and Validation Layers
Potharaju, B. (2026) · International Journal of Computational and Experimental Science and Engineering · doi:10.22399/ijcesen.4944
Visualization and the Use of Multimodality to Explain
Albrecht, R., Carli, R., Tchappi, I., & Najjar, A. (2026) · Springer eBooks · doi:10.1007/978-981-96-5290-7_25
Qin, J. (2026) · International Conference on Artificial Intelligence and Fintech · doi:10.1145/3800973.3801040
A Machine Learning Study of Country-Level ESG Modeling Using Open Indicators
Shi, Y., & Wang, J. (2026) · Communications in computer and information science · doi:10.1007/978-3-032-29003-8_14
An Empirical Benchmark of Explainable AI Methods Across Vision, Text, and Tabular Models
Kumar, D. M., Peter, M. C., & Sujatha, D. C. (2026) · International Conference on AI, Data Science, Cyber Security and Smart Manufacturing for Sustainable Development (ICADCS) · doi:10.1109/icadcs70036.2026.11583722
“Although there are many empirical studies on XAI approaches, most modern benchmarks are either limited to specific data modalities or certain model classes [15].”
Shen, Y., Yang, W., & Shen, Y. (2026) · IEEE Access · doi:10.1109/access.2026.3717981
“In fact, research on Explainable AI methodologies for structured data [34] shows that the use of transparency mechanisms may have a significant impact on the acceptance of AI-based decision systems in critical applications.”
Dafali, S. M., Kissi, M., & Beggar, O. E. (2026) · Results in Engineering · doi:10.1016/j.rineng.2026.112856 · Cited by 1
Avogadro, R., Rauniyar, A., Belotti, F., Soylu, A., & Roman, D. (2025) · IEEE/WIC/ACM International Conference on Web Intelligence and Intelligent Agent Technology (WI-IAT) · doi:10.1109/wi-iat67162.2025.00020
“Additionally, their outputs are often difficult to interpret or debug, limiting their use in scenarios requiring traceability [11], [24].”
An integrated explainable AI framework with counterfactual optimization for decision support
Jahan, N., Maua, J., Rozario, U., & Shoaib, H. A. (2026) · PLoS ONE · doi:10.1371/journal.pone.0358643 · Cited by 1
“Explainable AI (XAI) methods can broadly be categorized into intrinsic (ante-hoc) and post hoc approaches [18].”
A mixed-methods matrix approach to explainable GNNs in migrant network capital
Daovisan, H. (2026) · Discover Artificial Intelligence · doi:10.1007/s44163-026-02406-6
“Moreover, migration has been reinforced by cultural and linguistic affinities, as mutually intelligible languages and shared social traditions have helped reduce barriers to adaptation [25].”
Multi-Class Classification of Tabular Data Based on the FT-Transformer Model
Sariyev, S., Yarmatov, S., & Sayidkulov, A. (2026) · International Russian Automation Conference (RusAutoCon) · doi:10.1109/rusautocon69876.2026.11707378
“Sahakyan et al. examined explainable artificial intelligence for tabular data and showed the importance of interpreting model decisions in structured-data applications [3].”
Beyond Accuracy: A Comparative Analysis of Prompt Serialization Strategies for Tabular Data
A., O. B., Priya Darshini, P., Samarth, M. R., Parinith, N., & Devasia, J. V. (2026) · IEEE International Conference on Recent Advances in Electronics, Communication, Computing, Automation and Power (RECCAP) · doi:10.1109/reccap69368.2026.11724358
“Experiment 5 (Error Analysis and XAI): Model errors (false positives and false negatives) are analyzed, and SHAP [8], [12], [13] is used to understand model behavior and identify biases.”
Metadata
- Authors
- Sahakyan, M., Aung, Z., & Rahwan, T.
- Affiliations
- New York University Abu Dhabi (AE)
- Khalifa University of Science and Technology (AE)
- Venue
- IEEE Access
- Published
- 2021
- Volume
- 9
- Pages
- 135392-135422
- ISSN
- 2169-3536 (ISSN-L)
- OpenAlex
- W3201854521
- Cited by
- 135
- References
- 241
- Citations by year
- 2026: 17 · 2025: 37 · 2024: 43 · 2023: 20 · 2022: 18
- FWCI
- 7.16
- Type
- journal article
- Language
- en
- Open access
- gold
- doi.org
- Licence
- Locations
- IEEE Access (publishedVersion, cc-by-nc-nd)
- DOAJ (DOAJ: Directory of Open Access Journals) (submittedVersion, cc-by-sa)
- Funders
- Khalifa University, Abu Dhabi, UAE, by providing a Ph.D. Scholarship and Research Facilities
- Topics
- Physical Sciences › Computer Science › Artificial Intelligence › Explainable Artificial Intelligence (XAI)
- Physical Sciences › Computer Science › Artificial Intelligence › Privacy-Preserving Technologies in Data
- Physical Sciences › Computer Science › Artificial Intelligence › Machine Learning and Data Classification
- Keywords
- explainable AI, tabular data, black box problem, model interpretability, explanation methods, model types
About these checks
Registry, retraction, Cites and statistics results are computed, not judged, with one exception: a printed reference that no index lists is read once by a model before it counts as a citation error. Claims are extracted by a model and kept only when their quote appears verbatim in the text; each cited source is then checked, with a model’s help, for whether it says what the claim relies on. Those verdicts can be wrong — read the claim’s quote and the cited source before relying on one.
Statistics and arithmetic are recomputed, not judged.
Confidence bands are shown only for fields calibrated on our annotated test set. None is calibrated yet, so no band is shown.
What counts as a claim ›How we measure confidence ›How we check this ›
Are you an author, or do you see a problem with this page? Request a review
Data sources
Bibliographic data: Semantic Scholar, OpenAlex, Crossref.
Contains information from the Semantic Scholar Academic Graph Datasets, made available under the ODC Attribution License (ODC-BY 1.0).
Semantic Scholar’s data is described in: Kinney, R., et al. (2023). The Semantic Scholar Open Data Platform. arXiv:2301.10140.
