

Explainable Artificial Intelligence for Tabular Data: A Survey
Open accessThe DOI matches its Crossref record; 236 of the 241 references it cites were found in a registry or an index.
Abstract
Machine learning techniques are increasingly gaining attention due to their widespread use in various disciplines across academia and industry. Despite their tremendous success, many such techniques suffer from the “black-box” problem, which refers to situations where the data analyst is unable to explain why such techniques arrive at certain decisions. This problem has fuelled interest in Explainable Artificial Intelligence (XAI), which refers to techniques that can easily be interpreted by humans. Unfortunately, many of these techniques are not suitable for tabular data, which is surprising given the importance and widespread use of tabular data in critical applications such as finance, healthcare, and criminal justice. Also surprising is the fact that, despite the vast literature on XAI, there are still no survey articles to date that focus on tabular data. Consequently, despite the existing survey articles that cover a wide range of XAI techniques, it remains challenging for researchers working on tabular data to go through all of these surveys and extract the techniques that are suitable for their analysis. Our article fills this gap by providing a comprehensive and up-to-date survey of the XAI techniques that are relevant to tabular data. Furthermore, we categorize the references covered in our survey, indicating the type of the model being explained, the approach being used to provide the explanation, and the XAI problem being addressed. Our article is the first to provide researchers with a map that helps them navigate the XAI literature in the context of tabular data.
Overview
The claims and statistics of this paper haven’t been checked yet.
Free: it reads the open-access text and checks the first 5 claims that cite a source we can check. Create a free account to check every claim.
Integrity signals
Registry
Cites
Statistics
Figures

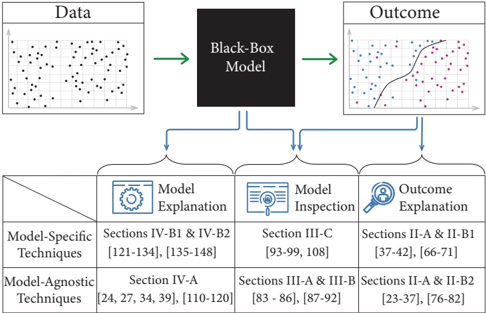




Verification
Claims the paper makes
The claims and statistics of this paper haven’t been checked yet.
Free: it reads the open-access text and checks the first 5 claims that cite a source we can check. Create a free account to check every claim.
Self-check
Percentages, sums and reported differences re-computed from the paper’s own numbers.
The self-check needs the paper’s full text.
Citations
Cites
Items 201–236 of 236
Defining Locality for Surrogates in Post-hoc Interpretablity
Laugel, T., Renard, X., Lesot, M., Marsala, C., & Detyniecki, M. (2018) · arXiv (Cornell University) · doi:10.48550/arxiv.1806.07498 · Cited by 44 · cited 1×
“The stability of post-hoc explanation techniques has also been criticized, showing that some of them are locally not stable enough [162] or, on the contrary, too stable and hence do not have sufficient local accuracy [163].”
BackgroundKnowledge Discovery Via Multiple Models
Domingos, P. (1998) · Intelligent Data Analysis · doi:10.3233/ida-1998-2303 · Cited by 43 · cited 2×
“CMM [129] 1998 Training a tree ensemble model on multiple synthetic data sets to generate a decision tree whereby every leaf corresponds to a single data set.”
BackgroundMethodIterative Orthogonal Feature Projection for Diagnosing Bias in Black-Box Models
Adebayo, J., & Kagal, L. (2016) · arXiv (Cornell University) · doi:10.48550/arxiv.1611.04967 · Cited by 42 · cited 2×
“Adebayo and Kagal [92] proposed a process that iteratively transforms the input features in a given data set to obtain several new data sets, where one feature is removed after each iteration.”
BackgroundInterpreting Models via Single Tree Approximation
Zhou, Y., & Hooker, G. (2016) · arXiv (Cornell University) · doi:10.48550/arxiv.1610.09036 · Cited by 39 · cited 2×
“- [131] 2016 CAD-MDD with the addition of hypothesis testing.”
MethodIdentifying Significant Predictive Bias in Classifiers
Zhang, Z., & Neill, D. B. (2016) · arXiv (Cornell University) · doi:10.48550/arxiv.1611.08292 · Cited by 38 · cited 1×
“THE recent surge of interest in Machine Learning (ML) and Artificial Intelligence (AI) has spurred a wide array of models designed to make decisions in a variety of domains, including healthcare [1]–[3], financial systems [4]– [7], and criminal justice [8]–[10], just to name a few.”
Tree Space Prototypes: Another Look at Making Tree Ensembles Interpretable
Tan, S., Soloviev, M., Hooker, G., & Wells, M. T. (2016) · arXiv (Cornell University) · doi:10.48550/arxiv.1611.07115 · Cited by 36
Rule extraction from trained neural networks using genetic algorithms
Arbatli, A. D., & Akın, H. L. (1997) · Nonlinear Analysis · doi:10.1016/s0362-546x(96)00267-2 · Cited by 35 · cited 1×
“Other techniques of rule extraction from neural networks include genetic programming [153]–[155], function-analysis [156], Boolean function approximation of neural network nodes [157], information gain maximization of hidden layers [158], and recursive discretization of the activation values of…”
MethodPrograms as Black-Box Explanations
Singh, S. K., Ribeiro, M. T., & Guestrin, C. (2016) · arXiv (Cornell University) · doi:10.48550/arxiv.1611.07579 · Cited by 34 · cited 1×
“In their follow-up papers, the developers of LIME underline the importance and challenges of model-agnostic techniques [55] and propose alternatives to LIME that are capable of explaining model outcome via “if-then” rules [56], [57].”
BackgroundSupport vector machine interpretation
Navia-Vázquez, A., & Parrado-Hernández, E. (2006) · Neurocomputing · doi:10.1016/j.neucom.2005.12.118 · Cited by 33 · cited 2×
“Other techniques include extracting if-then rules from SVM using feature selection, prediction modelling, and rule extraction [146], and extracting linear rules in local regions of the input space using a growing support vector classifier [147].”
MethodLoan Default Prediction Using Diversified Sensitivity Undersampling
Chen, Y.-Q., Zhang, J., & Ng, W. W. Y. (2018) · International Conference on Machine Learning and Cybernetics · doi:10.1109/icmlc.2018.8526936 · Cited by 29 · cited 1×
“T HE recent surge of interest in Machine Learning (ML) and Artificial Intelligence (AI) has spurred a wide array of models designed to make decisions in a variety of domains, including healthcare [1]–[3], financial systems [4]– [7], and criminal justice [8]–[10], just to name a few.”
BackgroundSharma, S., Henderson, J., & Ghosh, J. (2019) · arXiv · doi:10.48550/arxiv.1905.07857 · Cited by 28 · cited 2×
“CERTIFATI [80] 2019 Genetic algorithm.”
MethodPredicting Hospital Re-Admissions from Nursing Care Data of Hospitalized Patients
Lodhi, M. K., Ansari, R., Yao, Y., Keenan, G. M., Wilkie, D. J., & Khokhar, A. (2017) · Lecture notes in computer science · doi:10.1007/978-3-319-62701-4_14 · Cited by 27
Feature Importance Measure for Non-linear Learning AlgorithmsPreprint
Vidovic, M. M.-C., Görnitz, N., Müller, K., & Kloft, M. (2016) · arXiv (Cornell University) · doi:10.48550/arxiv.1611.07567 · Cited by 26 · cited 3×
“Other model-agnostic techniques use Monte Carlo sampling [33], feature importance ranking [34], ge-netic algorithms [31], and local linear modelling combined with random forests [30].”
BackgroundMethodInterpretable & Explorable Approximations of Black Box Models
Lakkaraju, H., Kamar, E., Caruana, R., & Leskovec, J. (2017) · arXiv · doi:10.48550/arxiv.1707.01154 · Cited by 23
LionForests: Local Interpretation of Random ForestsPreprint
Mollas, I., Bassiliades, N., Vlahavas, I. P., & Tsoumakas, G. (2019) · arXiv (Cornell University) · doi:10.48550/arxiv.1911.08780 · Cited by 22 · cited 1×
“Other model-specific outcome explanation techniques include the one proposed by Mollas et al. [42], which uses unsupervised learning techniques and a similarity metric to explain individual outcomes of random forests.”
MethodLoyola‐González, O. (2019) · Lecture notes in computer science · doi:10.1007/978-3-030-33749-0_12 · Cited by 20 · cited 2×
“XAI has been used across a wide range of domains, including healthcare [175]–[181] (Section VI-A), finance [182]–[186] (Section VI-B), criminal justice [187]–[190] (Section VI-C) and other domains [191], [192] (Section VI-D).”
BackgroundMethodExplainable AI (XAI) Models Applied to Planning in Financial MarketsPreprint
Benhamou, E., Ohana, J., Saltiel, D., & Guez, B. (2021) · SSRN Electronic Journal · doi:10.2139/ssrn.3862437 · Cited by 20 · cited 1×
“Benhamou et al. [201] used gradient boosting decision trees to analyse the stock market during the March-2020 eq-uity crash.”
BackgroundBurgt, J. V. D. (2020) · Journal of digital banking. · doi:10.69554/qxwu3940 · Cited by 19 · cited 2×
“XAI has been used across a wide range of domains, including healthcare [175]–[181] (Section VI-A), finance [182]–[186] (Section VI-B), criminal justice [187]–[190] (Section VI-C) and other domains [191], [192] (Section VI-D).”
BackgroundXAlgo: a Design Probe of Explaining Algorithms’ Internal States via Question-Answering
Rebanal, J., Combitsis, J., Tang, Y., & Chen, X. '. (2021) · 26th International Conference on Intelligent User Interfaces · doi:10.1145/3397481.3450676 · Cited by 17 · cited 1×
“A similar and very recent work by Rebanal et al. [210] proposed an interactive approach called XAIgo, which uses question-answering to explain deterministic algorithms to non-expert users.”
ResultGenerating User-friendly Explanations for Loan Denials using GANsPreprint
Srinivasan, R., Chander, A., & Pezeshkpour, P. (2019) · arXiv (Cornell University) · doi:10.48550/arxiv.1906.10244 · Cited by 16 · cited 2×
“Out of these, we will discuss the works of Srinivasan et al. [219] and Holzinger et al. [178] since they are the only ones capable of handling tabular data—the focus of our survey.”
MethodSupport vector machines with symbolic interpretation
Nunez, H., Ángulo, C., & Catalá, A. (2003) · Brazilian Symposium on Neural Networks (SBRN) · doi:10.1109/sbrn.2002.1181456 · Cited by 15 · cited 1×
“- [138] 2002 SVM Group prototype vectors for each class by using clustering.”
MethodGraphical Explanation in Belief Networks
Madigan, D., Mosurski, K., & Almond, R. G. (1997) · Journal of Computational and Graphical Statistics · doi:10.2307/1390929 · Cited by 15
GoldenEye++: A Closer Look into the Black Box
Henelius, A., Puolamäki, K., Karlsson, I., Zhao, J., Asker, L., Boström, H., & Papapetrou, P. (2015) · Lecture notes in computer science · doi:10.1007/978-3-319-17091-6_5 · Cited by 14 · cited 1×
“A year later, Henelius et al. [118] proposed a refined version of GoldenEye called GoldenEye++, which utilises a more sensitive grouping metric.”
BackgroundThe Impact of Explanations on AI Competency Prediction in VQA
Alipour, K., Ray, A., Lin, X., Schulze, J. P., Yao, Y., & Burachas, G. (2020) · doi:10.1109/hccai49649.2020.00010 · Cited by 14
Explainable AI: Classification of MRI Brain Scans Orders for Quality Improvement
Zhang, A. Y., Lam, S. S. W., Ong, M. E. H., Tang, P. H., & Chan, L. L. (2019) · IEEE/ACM International Conference on Big Data Computing, Applications and Technologies (BDCAT) · doi:10.1145/3365109.3368791 · Cited by 12
Walambe, R. A., Kolhatkar, A., Ojha, M., Kademani, A., Pandya, M., Kathote, S., & Kotecha, K. V. (2021) · Communications in computer and information science · doi:10.1007/978-981-16-0404-1_5 · Cited by 12 · cited 1×
“Walambe et al. [184] also proposed a similar blockchain-based XAI system for credit risk assessment.”
BackgroundHolzinger, A., Carrington, A., & Müller, H. (2019) · arXiv · doi:10.48550/arxiv.1912.09024 · Cited by 11
Explainable AI as a Social Microscope: A Case Study on Academic Performance
Sargsyan, A., Karapetyan, A., Woon, W. L., & Alshamsi, A. (2020) · Lecture notes in computer science · doi:10.1007/978-3-030-64583-0_24 · Cited by 10 · cited 2×
“Finally, we mention the work of Sargsyan et al. [192], who classified students based on their LIME coefficient.”
BackgroundMethodInterpretable Machine Learning for COVID-19 Diagnosis Through Clinical Variables
Thimoteo, L. M., Vellasco, M. M. B. R., do Amaral, J. M., Figueiredo, K., Yokoyama, C. L., & Marques, E. (2020) · Congresso Brasileiro de Automática · doi:10.48011/asba.v2i1.1590 · Cited by 10 · cited 1×
“Thimoteo et al. [195] conducted a study whose goal is to help Brazil fight the COVID-19 pandemic more effectively.”
BackgroundSamuel, S. S., Abdullah, N. N. B., & Raj, A. K. (2020) · Lecture notes in computer science · doi:10.1007/978-3-030-57321-8_14 · Cited by 8
Peña, A., Serna, I., Morales, A., & Fiérrez, J. (2020) · INTERNATIONAL CONFERENCE ON MULTIMODAL INTERACTION · doi:10.1145/3382507.3421165 · Cited by 8 · cited 1×
“Several applications of multimodal AI were proposed in the literature [215], [216], but despite their outstanding performance, there is a lack of social acceptance due to their black-box nature [217].”
BackgroundImproving VQA and its Explanations \\ by Comparing Competing Explanations
Wu, J., Chen, L., & Mooney, R. J. (2020) · arXiv (Cornell University) · doi:10.48550/arxiv.2006.15631 · Cited by 8 · cited 1×
“Recently, some research was conducted for explaining multi-modal AI systems [178], [218]–[222].”
BackgroundExtracting symbolic rules from trained neural network ensembles
ZhouZhi-Hua, JiangYuan, & ChenShi-Fu (2003) · AI Communications · doi:10.5555/859130.859132 · Cited by 5
A Machine Learning Evaluation of the COMPAS Dataset
Yoon, H. (2018) · IEEE International Conference on Big Data (BigData) · doi:10.1109/bigdata.2018.8622343 · Cited by 2 · cited 1×
“More the authors used the COMPAS recidivism data set [202] and proposed a novel scaffolding technique capable of hiding the biases of any given classifier by allowing an adversarial entity to craft an arbitrary desired explanation.”
MethodExplainable AI for Interpretable Credit ScoringPreprint
Demajo, L. M., Vella, V., & Dingli, A. (2020) · RePEc: Research Papers in Economics · doi:10.48550/arxiv.2012.03749 · cited 1×
“XAI has been used across a wide range of domains, including healthcare [175]–[181] (Section VI-A), finance [182]–[186] (Section VI-B), criminal justice [187]–[190] (Section VI-C) and other domains [191], [192] (Section VI-D).”
BackgroundOpening the Black Box of Deep Neural Networks via Information
Shwartz-Ziv, R., & Tishby, N. (2017) · arXiv · doi:10.48550/arxiv.1703.00810 · cited 2×
“Schwartz-Ziv and Tishby [93] extended this idea, which provides a better understanding of the training dynamics, learning processes, and internal representations of deep learning.”
Background
Research works printed but not linked: 6
- T. Wang, C. Rudin, F. Doshi-Velez, Y. Liu, E. Klampfl, and P. MacNeille, "A Bayesian framework for learning rule sets for interpretable classifica- tion," Journal of Machine Learning Research, vol. 18, no. 1, pp. 2357- 2393, 2017.
- C. Molnar, "Interpretable machine learning: A guide for making black box models explainable.(2019)," URL https://christophm. github. io/interpretable-ml-book, 2019.
- "Providing explainable ai through advanced knowledge graphs." https: //kyndi.com/wp-content/uploads/2018/03/Cognilytica-Briefing-Note_ Kyndi.pdf. Accessed: 18.07.2021.
- 225"Explainable machine learning challenge." https://community.fico.com/ s/explainable-machine-learning-challenge. Accessed: 06.07.2021.
- H. A. Chipman, E. I. George, and R. E. McCulloh, "Making sense of a forest of trees," Computing Science and Statistics, pp. 84-92, 1998.
- J. Angwin, J. Larson, S. Mattu, and L. Kirchner, "Machine bias: There's software used across the country to predict future crimi- nals. And it's biased against blacks." https://www.propublica.org/article/ machine-bias-risk-assessments-in-criminal-sentencing, 2016.
Cited by
Deep Neural Networks and Tabular Data: A Survey
Borisov, V., Leemann, T., Seßler, K., Haug, J., Pawelczyk, M., & Kasneci, G. (2024) · IEEE Transactions on Neural Networks and Learning Systems · doi:10.1109/tnnls.2022.3229161 · Cited by 1,025
“[50] summarizes explanation techniques in the context of tabular data.”
BackgroundMethodInfluentialExplainable Artificial Intelligence Applications in Cyber Security: State-of-the-Art in Research
Zhang, Z., Hamadi, H. A., Damiani, E., Yeun, C. Y., & Taher, F. (2022) · IEEE Access · doi:10.1109/access.2022.3204051 · Cited by 450
“On the other hand, cyber security developers 77 have sometimes sought higher accuracy at the price of inter78 pretability, making their models more intricate and difficult to 79 grasp [10].”
BackgroundMethodA., S., & R., S. (2023) · Decision Analytics Journal · doi:10.1016/j.dajour.2023.100230 · Cited by 432
Explainable Artificial Intelligence in CyberSecurity: A Survey
Capuano, N., Fenza, G., Loia, V., & Stanzione, C. (2022) · IEEE Access · doi:10.1109/access.2022.3204171 · Cited by 330
“In [35] 408 a survey of XAI methods in deployment is made, and [36] 409 which considers the XAI for tabular data.”
BackgroundExplainable AI for clinical and remote health applications: A survey on tabular and time series data
Di Martino, F., & Delmastro, F. (2023) · Artificial Intelligence Review · doi:10.1007/s10462-022-10304-3 · Cited by 216
“However, several existing XAI methods are currently not suitable for tabular data due to the unique characteristics that distinguish them from images (and also text records), such as the potential interactions between features and the coexistence of continuous and categorical predictors [10].”
Metadata
- Authors
- Sahakyan, M., Aung, Z., & Rahwan, T.
- Affiliations
- New York University Abu Dhabi (AE)
- Khalifa University of Science and Technology (AE)
- Venue
- IEEE Access
- Published
- 2021
- Volume
- 9
- Pages
- 135392-135422
- ISSN
- 2169-3536 (ISSN-L)
- OpenAlex
- W3201854521
- Cited by
- 135
- References
- 241
- Citations by year
- 2026: 17 · 2025: 37 · 2024: 43 · 2023: 20 · 2022: 18
- FWCI
- 7.16
- Type
- journal article
- Language
- en
- Open access
- gold
- doi.org
- Licence
- Locations
- IEEE Access (publishedVersion, cc-by-nc-nd)
- DOAJ (DOAJ: Directory of Open Access Journals) (submittedVersion, cc-by-sa)
- Funders
- Khalifa University, Abu Dhabi, UAE, by providing a Ph.D. Scholarship and Research Facilities
- Topics
- Physical Sciences › Computer Science › Artificial Intelligence › Explainable Artificial Intelligence (XAI)
- Physical Sciences › Computer Science › Artificial Intelligence › Privacy-Preserving Technologies in Data
- Physical Sciences › Computer Science › Artificial Intelligence › Machine Learning and Data Classification
- Keywords
- explainable AI, tabular data, black box problem, model interpretability, explanation methods, model types
About these checks
Registry, retraction, Cites and statistics results are computed, not judged, with one exception: a printed reference that no index lists is read once by a model before it counts as a citation error. Claims are extracted by a model and kept only when their quote appears verbatim in the text; each cited source is then checked, with a model’s help, for whether it says what the claim relies on. Those verdicts can be wrong — read the claim’s quote and the cited source before relying on one.
Statistics and arithmetic are recomputed, not judged.
Confidence bands are shown only for fields calibrated on our annotated test set. None is calibrated yet, so no band is shown.
What counts as a claim ›How we measure confidence ›How we check this ›
Are you an author, or do you see a problem with this page? Request a review
Data sources
Bibliographic data: Semantic Scholar, OpenAlex, Crossref.
Contains information from the Semantic Scholar Academic Graph Datasets, made available under the ODC Attribution License (ODC-BY 1.0).
Semantic Scholar’s data is described in: Kinney, R., et al. (2023). The Semantic Scholar Open Data Platform. arXiv:2301.10140.
