Cited by 40

The DOI matches its Crossref record; 1 of the 1 references it cites were found in a registry or an index.

Non‐invasive, ratiometric determination of intracellular pH in Pseudomonas species using a novel genetically encoded indicator

Arce‐Rodríguez, Alejandro, Volke, Daniel C., Bense, Sarina, Häussler, Susanne, Nikel, Pablo I.·2019·Microbial Biotechnology

Abstract

Summary: The ability of Pseudomonas species to thrive in all major natural environments (i.e. terrestrial, freshwater and marine) is based on its exceptional capability to adapt to physicochemical changes. Thus, environmental bacteria have to tightly control the maintenance of numerous physiological traits across different conditions. The intracellular pH ( pH i ) homoeostasis is a particularly important feature, since the pH i influences a large portion of the biochemical processes in the cell. Despite its importance, relatively few reliable, easy‐to‐implement tools have been designed for quantifying in vivo pH i changes in Gram‐negative bacteria with minimal manipulations. Here we describe a convenient, non‐invasive protocol for the quantification of the pH i in bacteria, which is based on the ratiometric fluorescent indicator protein PHP ( pH indicator for P seudomonas ). The DNA sequence encoding PHP was thoroughly adapted to guarantee optimal transcription and translation of the indicator in Pseudomonas species. Our PHP ‐based quantification method demonstrated that pH i is tightly regulated over a narrow range of pH values not only in Pseudomonas , but also in other Gram‐negative bacterial species such as Escherichia coli . The maintenance of the cytoplasmic pH homoeostasis in vivo could also be observed upon internal (e.g. redirection of glucose consumption pathways in P . putida ) and external (e.g. antibiotic exposure in P . aeruginosa ) perturbations, and the PHP indicator was also used to follow dynamic changes in the pH i upon external pH shifts. In summary, our work describes a reliable method for measuring pH i in Pseudomonas , allowing for the detailed investigation of bacterial pH i homoeostasis and its regulation.

Overview

The claims and statistics of this paper haven’t been checked yet.

Run the check — free, no account needed. It reads the open-access text and checks the sources it cites.

A few free checks a day · papers already verified open instantly · results are public

Integrity signals

Registry

Crossref · 10.1111/1751-7915.13439

Cites

1 of 1 references verified0 citation errors · 0 not checkable

Statistics

Figures

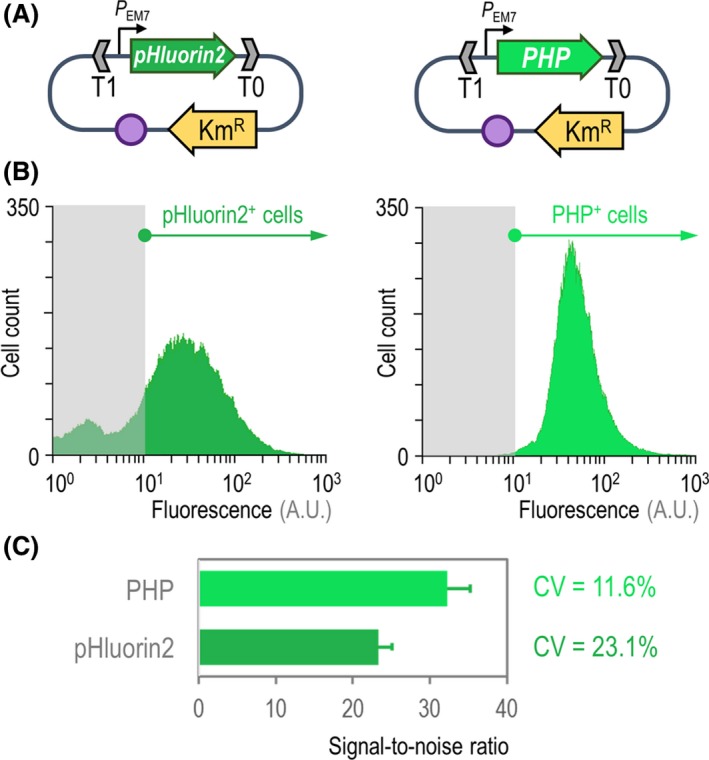
Figure 1 Benchmarking of the PHP indicator for the assessment of intracellular pH. A. Two separate expression plasmids were constructed for the calibrated expression of the synthetic genes encoding the pHluorin2 or PHP indicators. In both cases, the expression of the genes is driven by the constitutive PEM 7 promoter, and the backbone used for these constructs (vector pSEVA2513) carries the oriV(RSF1010) origin of replication, indicated in the scheme as a purple circle. The kanamycin‐resistance (KmR) determinant and the T1 and T0 transcriptional terminators are likewise highlighted in the plasmid maps. B. Flow cytometry exploration of the pHluorin2 and PHP indicators. Plasmid pS2513·pHluorin2 or pS2513·PHP was transformed in P. putida KT2440, and the cells were grown in LB medium until the mid‐exponential phase of growth. Cells were processed as indicated in Experimental Procedures , and the histograms show the distribution of fluorescence (in arbitrary units, A.U.) stemming from pHluorin2 or PHP (the bacterial populations positive for the indicators are indicated in each case). The light grey rectangle in each plot identifies the region considered negative for the fluorescence signal, which was assessed with P. putida carrying the empty pSEVA2513 vector and grown under the same conditions. C. Key performance parameters of the pH indicators. The signal‐to‐noise ratio was calculated from flow cytometry measurements of P. putida KT2440 carrying either plasmid pS2513·pHluorin2 or pS2513·PHP as indicated above. The bars represent the signal‐to‐noise ratio for each sensor and the 95% confidence interval calculated from four independent experiments. The coefficient of variation (CV) of the fluorescence signal was also calculated from these measurements.
Figure 1 Benchmarking of the PHP indicator for the assessment of intracellular pH. A. Two separate expression plasmids were constructed for the calibrated expression of the synthetic genes encoding the pHluorin2 or PHP indicators. In both cases, the expression of the genes is driven by the constitutive PEM 7 promoter, and the backbone used for these constructs (vector pSEVA2513) carries the oriV(RSF1010) origin of replication, indicated in the scheme as a purple circle. The kanamycin‐resistance (KmR) determinant and the T1 and T0 transcriptional terminators are likewise highlighted in the plasmid maps. B. Flow cytometry exploration of the pHluorin2 and PHP indicators. Plasmid pS2513·pHluorin2 or pS2513·PHP was transformed in P. putida KT2440, and the cells were grown in LB medium until the mid‐exponential phase of growth. Cells were processed as indicated in Experimental Procedures , and the histograms show the distribution of fluorescence (in arbitrary units, A.U.) stemming from pHluorin2 or PHP (the bacterial populations positive for the indicators are indicated in each case). The light grey rectangle in each plot identifies the region considered negative for the fluorescence signal, which was assessed with P. putida carrying the empty pSEVA2513 vector and grown under the same conditions. C. Key performance parameters of the pH indicators. The signal‐to‐noise ratio was calculated from flow cytometry measurements of P. putida KT2440 carrying either plasmid pS2513·pHluorin2 or pS2513·PHP as indicated above. The bars represent the signal‐to‐noise ratio for each sensor and the 95% confidence interval calculated from four independent experiments. The coefficient of variation (CV) of the fluorescence signal was also calculated from these measurements.CC BY · PubMed Central
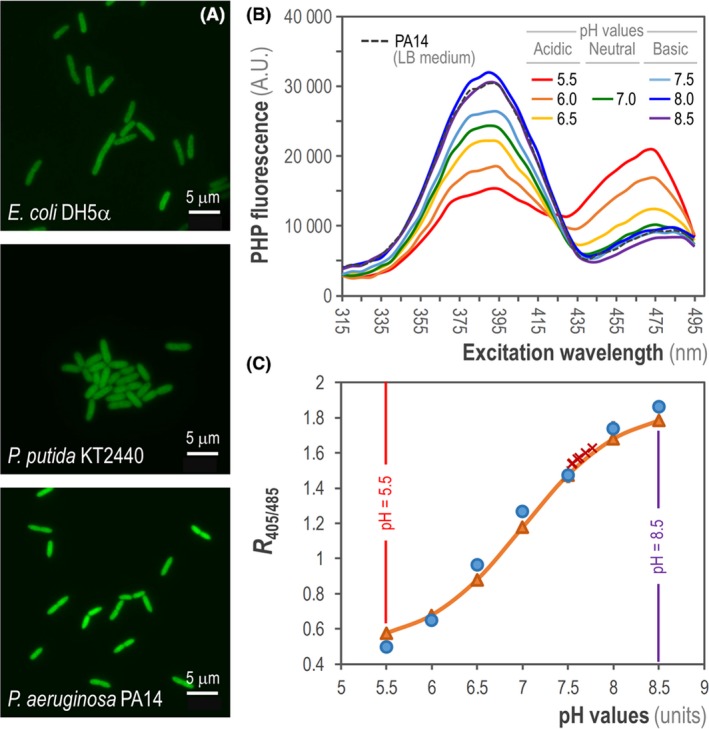
Figure 2 Assessment of intracellular pH (pH i) in different Gram‐negative bacteria. A. Fluorescent microscopy from exponentially growing cultures of E. coli DH5α, P. putida KT2440 and P. aeruginosa PA14 transformed with plasmid pS2513·PHP and grown in LB medium. Scale bars are indicated in each case. B. Fluorescence excitation spectrum of the PHP indicator in P. aeruginosa PA14/pS2513·PHP cultured in LB medium. The intracellular pH (pH i) of the cells was collapsed to the extracellular pH as outlined in Experimental Procedures . The mean values obtained from three independent experiments are shown. A.U., arbitrary units. C. Calibration curve of the PHP indicator in P. aeruginosa PA14/pS2513·PHP cells cultured in LB medium supplemented with 20 μM carbonyl cyanide m‐chlorophenyl hydrazine (CCCP). The data for the calibration curve were obtained as the ratio between the excitation peaks at λexcitation = 405 nm and 485 nm (R 405/485) plotted against the pH values of equilibrated cells (blue circles). These values were fitted using the Boltzmann sigmoid best‐fitting curve to obtain the calibration curve (orange triangles), which was used to calculate the pH i values in P. aeruginosa PA14 during exponential growth (red crosses). The lowest and highest pH values tested (pH = 5.5 and 8.5) are highlighted. Data points are representative of independent triplicates, and the red crosses (corresponding to six individual determinations) are shown in the curve to indicate the narrow dispersion of experimentally calculated pH i values.
Figure 2 Assessment of intracellular pH (pH i) in different Gram‐negative bacteria. A. Fluorescent microscopy from exponentially growing cultures of E. coli DH5α, P. putida KT2440 and P. aeruginosa PA14 transformed with plasmid pS2513·PHP and grown in LB medium. Scale bars are indicated in each case. B. Fluorescence excitation spectrum of the PHP indicator in P. aeruginosa PA14/pS2513·PHP cultured in LB medium. The intracellular pH (pH i) of the cells was collapsed to the extracellular pH as outlined in Experimental Procedures . The mean values obtained from three independent experiments are shown. A.U., arbitrary units. C. Calibration curve of the PHP indicator in P. aeruginosa PA14/pS2513·PHP cells cultured in LB medium supplemented with 20 μM carbonyl cyanide m‐chlorophenyl hydrazine (CCCP). The data for the calibration curve were obtained as the ratio between the excitation peaks at λexcitation = 405 nm and 485 nm (R 405/485) plotted against the pH values of equilibrated cells (blue circles). These values were fitted using the Boltzmann sigmoid best‐fitting curve to obtain the calibration curve (orange triangles), which was used to calculate the pH i values in P. aeruginosa PA14 during exponential growth (red crosses). The lowest and highest pH values tested (pH = 5.5 and 8.5) are highlighted. Data points are representative of independent triplicates, and the red crosses (corresponding to six individual determinations) are shown in the curve to indicate the narrow dispersion of experimentally calculated pH i values.CC BY · PubMed Central
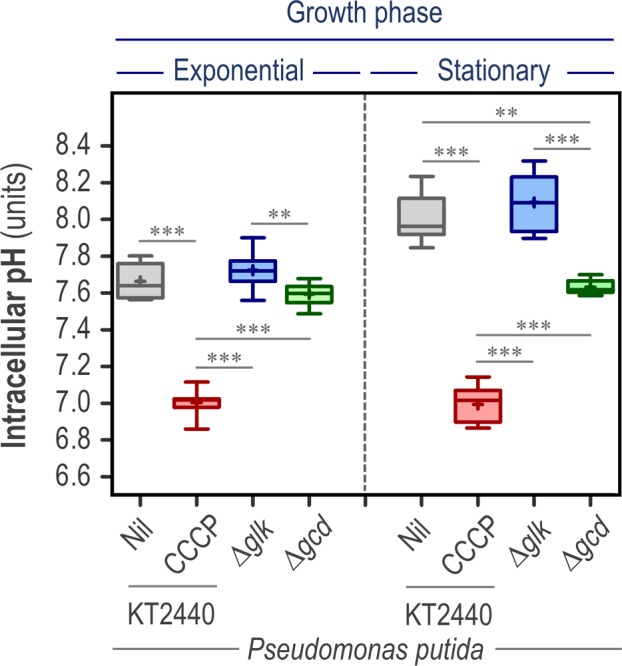
Figure 3 The cytoplasmic pH of P. putida is altered by the pathway used for glucose consumption. Wild‐type P. putida KT2440 and its isogenic mutants in the enzymes glucokinase (Δglk) and glucose 2‐dehydrogenase (Δglk) were transformed with plasmid pS2513·PHP and grown in M9 minimal medium supplemented with glucose at 20 mM as the sole carbon source. The intracellular pH (pH i) was investigated during the exponential and stationary (24 h post‐inoculation) phase of growth. The pH i of wild‐type cells cultured in the presence of 20 μM carbonyl cyanide m‐chlorophenyl hydrazine (CCCP) is also shown in the figure. Independent triplicates of the experiments were carried out, and the level of statistical significance in the pairwise comparisons indicated in the comparisons across experimental conditions is indicated as ** P < 0.01 and *** P < 0.001 (ANOVA).
Figure 3 The cytoplasmic pH of P. putida is altered by the pathway used for glucose consumption. Wild‐type P. putida KT2440 and its isogenic mutants in the enzymes glucokinase (Δglk) and glucose 2‐dehydrogenase (Δglk) were transformed with plasmid pS2513·PHP and grown in M9 minimal medium supplemented with glucose at 20 mM as the sole carbon source. The intracellular pH (pH i) was investigated during the exponential and stationary (24 h post‐inoculation) phase of growth. The pH i of wild‐type cells cultured in the presence of 20 μM carbonyl cyanide m‐chlorophenyl hydrazine (CCCP) is also shown in the figure. Independent triplicates of the experiments were carried out, and the level of statistical significance in the pairwise comparisons indicated in the comparisons across experimental conditions is indicated as ** P < 0.01 and *** P < 0.001 (ANOVA).CC BY · PubMed Central
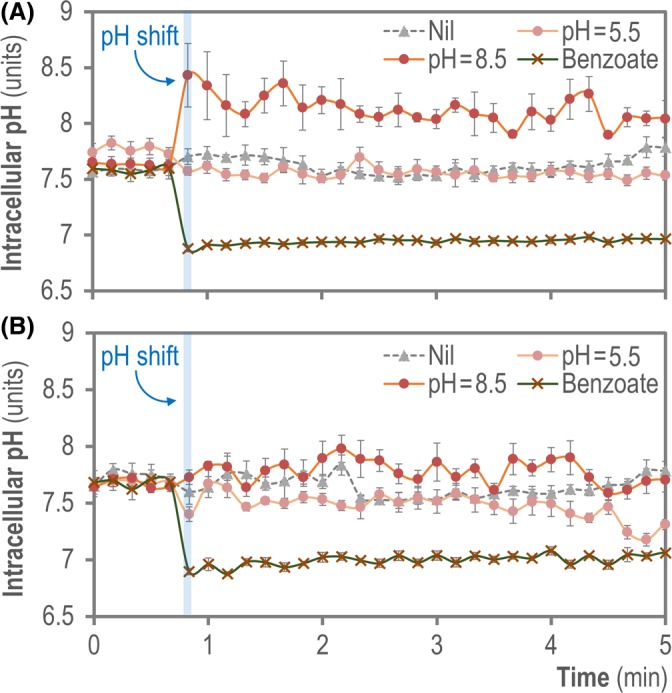
Figure 4 Monitoring the dynamic changes of cytoplasmic pH upon external pH shifts. Exponentially growing cells of (A) E. coli MG1655/pS2513·PHP or (B) P. putida KT2440/pS2513·PHP cultured in M9 minimal medium containing 20 mM glucose were aliquoted into a 96‐well microtiter plate and the cytoplasmic pH was continuously monitored, before and after a shift in the extracellular pH was induced by the addition of the same culture medium buffered at pH = 5.5 or pH = 8.5 as indicated in the Experimental Procedures , or sodium benzoate (permeant acid). Changes in cytoplasmic pH were monitored every 10 s during the first 5 min of incubation. Data shown in each case indicate mean values from independent triplicates ± SD.
Figure 4 Monitoring the dynamic changes of cytoplasmic pH upon external pH shifts. Exponentially growing cells of (A) E. coli MG1655/pS2513·PHP or (B) P. putida KT2440/pS2513·PHP cultured in M9 minimal medium containing 20 mM glucose were aliquoted into a 96‐well microtiter plate and the cytoplasmic pH was continuously monitored, before and after a shift in the extracellular pH was induced by the addition of the same culture medium buffered at pH = 5.5 or pH = 8.5 as indicated in the Experimental Procedures , or sodium benzoate (permeant acid). Changes in cytoplasmic pH were monitored every 10 s during the first 5 min of incubation. Data shown in each case indicate mean values from independent triplicates ± SD.CC BY · PubMed Central
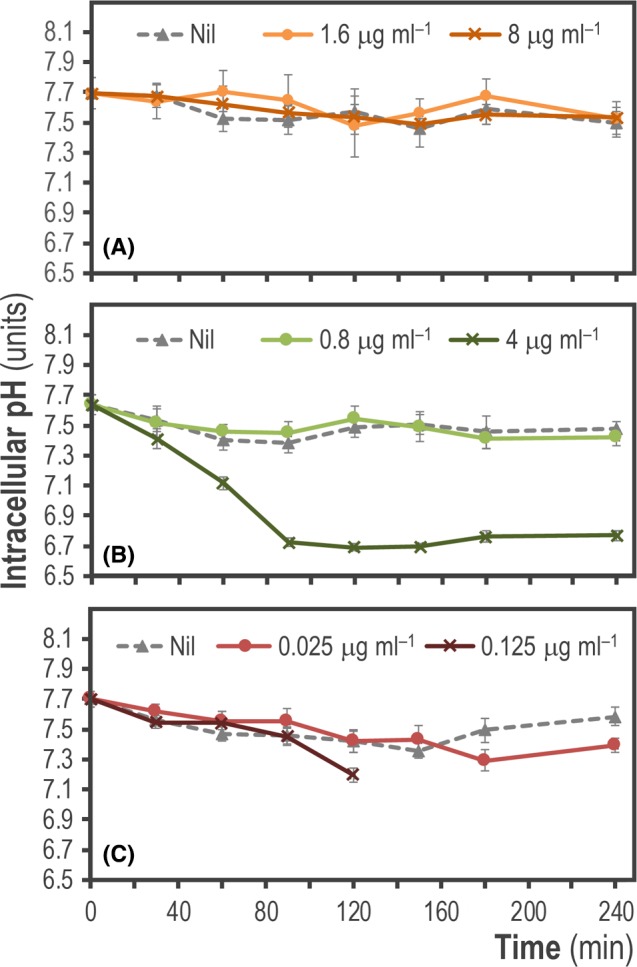
Figure 5 Monitoring the changes of intracellular pH (pH i) in P. aeruginosa PA14 upon treatment with different antibiotics. Exponentially growing cultures of P. aeruginosa PA14 transformed with plasmid pS2513·PHP and grown in LB medium were challenged with one‐fifth (0.2×) and full (1×) minimal inhibitory concentrations of (A) ceftazidime (CAZ), (B) amikacin (AMK) and (C) ciprofloxacin (CIP) as indicated in the graphs. The data shown in each case indicate mean values of pH i from independent triplicates ± SD.
Figure 5 Monitoring the changes of intracellular pH (pH i) in P. aeruginosa PA14 upon treatment with different antibiotics. Exponentially growing cultures of P. aeruginosa PA14 transformed with plasmid pS2513·PHP and grown in LB medium were challenged with one‐fifth (0.2×) and full (1×) minimal inhibitory concentrations of (A) ceftazidime (CAZ), (B) amikacin (AMK) and (C) ciprofloxacin (CIP) as indicated in the graphs. The data shown in each case indicate mean values of pH i from independent triplicates ± SD.CC BY · PubMed Central
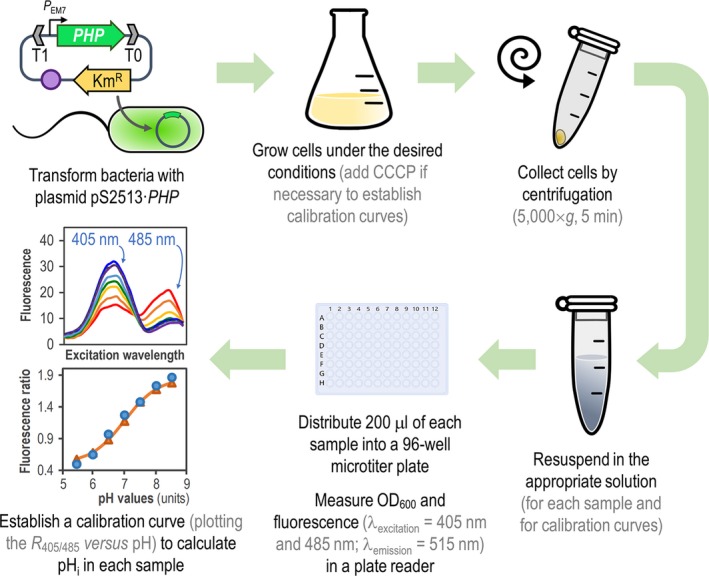
Figure 6 General procedure for in vivo assessment of intracellular pH (pH i) in Pseudomonas species by means of the PHP indicator. Plasmid pS2513·PHP is introduced into the bacteria of interest by chemical transformation, mating or electroporation. The expression of PHP is driven by the constitutive PEM 7 promoter, and vector pSEVA2513 carries the oriV(RSF1010) origin of replication, indicated as a purple circle. The kanamycin‐resistance (KmR) determinant and the T1 and T0 transcriptional terminators are likewise highlighted in the plasmid. Cells are grown in the appropriate culture medium, and a small culture sample is harvested by centrifugation. The cell pellet is resuspended in M9 medium salts to a final optical density at 600 nm (OD 600) = 0.4–0.5. To establish the calibration curve, a second culture is prepared in the same culture medium supplemented with carbonyl cyanide m‐chlorophenyl hydrazine (CCCP). Cells from this culture are also harvested by centrifugation and equilibrated in M9 medium salts adjusted to different pH values (ranging from pH = 5.5–8.5, see Experimental Procedures ) to a final OD 600 = 0.4–0.5. A 200‐μl aliquot of each cell suspension is transferred into a 96‐well microtiter plate, and OD 600 and fluorescence (λexcitation = 405 nm and 485 nm; λemission = 515 nm) are measured in a plate reader. Finally, the R 405/485 values are plotted versus the pH values of pH‐equilibrated cells (calibration curve), and the pH i is calculated using a Boltzmann sigmoid best‐fitting equation.
Figure 6 General procedure for in vivo assessment of intracellular pH (pH i) in Pseudomonas species by means of the PHP indicator. Plasmid pS2513·PHP is introduced into the bacteria of interest by chemical transformation, mating or electroporation. The expression of PHP is driven by the constitutive PEM 7 promoter, and vector pSEVA2513 carries the oriV(RSF1010) origin of replication, indicated as a purple circle. The kanamycin‐resistance (KmR) determinant and the T1 and T0 transcriptional terminators are likewise highlighted in the plasmid. Cells are grown in the appropriate culture medium, and a small culture sample is harvested by centrifugation. The cell pellet is resuspended in M9 medium salts to a final optical density at 600 nm (OD 600) = 0.4–0.5. To establish the calibration curve, a second culture is prepared in the same culture medium supplemented with carbonyl cyanide m‐chlorophenyl hydrazine (CCCP). Cells from this culture are also harvested by centrifugation and equilibrated in M9 medium salts adjusted to different pH values (ranging from pH = 5.5–8.5, see Experimental Procedures ) to a final OD 600 = 0.4–0.5. A 200‐μl aliquot of each cell suspension is transferred into a 96‐well microtiter plate, and OD 600 and fluorescence (λexcitation = 405 nm and 485 nm; λemission = 515 nm) are measured in a plate reader. Finally, the R 405/485 values are plotted versus the pH values of pH‐equilibrated cells (calibration curve), and the pH i is calculated using a Boltzmann sigmoid best‐fitting equation.CC BY · PubMed Central

Verification

Claims the paper makes

The claims and statistics of this paper haven’t been checked yet.

Run the check — free, no account needed. It reads the open-access text and checks the sources it cites.

A few free checks a day · papers already verified open instantly · results are public

Claims other papers make about this one

Each is checked against this paper’s own text: does it say what the citing paper says it does?

Self-check

Percentages, sums and reported differences re-computed from the paper’s own numbers.

The self-check needs the paper’s full text.

Citations

Cites

Show all 1 references

Research works printed but not linked: 89

  1. 10.1128/jb.171.12.6782-6790.1989 · DOI
  2. 10.1128/mBio.01512-18 · DOI · Paper page
  3. 10.1006/bbrc.2001.6004 · DOI
  4. 10.1016/0378-1119(81)90080-9 · DOI
  5. 10.1128/mSphere.00176-16 · DOI
  6. 10.7573/dic.212527 · DOI
  7. 10.1111/1462-2920.13230 · DOI · Paper page
  8. 10.3390/s131216736 · DOI
  9. 10.1016/j.ymben.2015.11.004 · DOI
  10. 10.1007/s00253-016-7832-x · DOI
  11. 10.1093/emboj/17.20.6061 · DOI
  12. 10.1128/mr.49.4.359-378.1985 · DOI
  13. 10.1128/aem.62.1.178-183.1996 · DOI
  14. 10.1111/1751-7915.13292 · DOI
  15. 10.1038/nrm2820 · DOI · Paper page
  16. 10.1128/JB.00203-07 · DOI
  17. 10.1007/978-3-319-32189-9_6 · DOI
  18. 10.1111/j.1365-2958.2004.04155.x · DOI
  19. 10.1371/journal.pone.0144650 · DOI
  20. 10.1128/MMBR.51.3.341-350.1987 · DOI
  21. 10.1128/AAC.37.11.2506 · DOI
  22. 10.1007/BF01871715 · DOI
  23. 10.1128/AAC.28.2.200 · DOI
  24. 10.1016/j.biotechadv.2017.08.001 · DOI
  25. 10.3390/antibiotics8020037 · DOI
  26. 10.1021/bi8009482 · DOI
  27. 10.1002/biot.201800439 · DOI
  28. 10.1046/j.1365-2958.2003.03877.x · DOI
  29. 10.1128/JB.187.5.1581-1590.2005 · DOI
  30. 10.1021/acs.est.6b00288 · DOI
  31. Ghoul M., 1989, Effect of carbonyl cyanide m‐chlorophenylhydrazone on Escherichia coli halotolerance, Appl Environ Microbiol, 55, 1040, 10.1128/aem.55.4.1040-1043.1989 · DOI
  32. 10.1002/cyto.a.23250 · DOI
  33. Green M.R., 2012, Molecular Cloning: A Laboratory Manual
  34. 10.1016/B978-0-12-420138-5.00023-9 · DOI
  35. 10.1021/cr900249z · DOI
  36. 10.1038/373663b0 · DOI
  37. 10.1093/nar/gky895 · DOI
  38. 10.1128/AEM.71.5.2501-2510.2005 · DOI
  39. 10.1038/nrmicro2549 · DOI · Paper page
  40. 10.1111/j.1462-2920.2005.00913.x · DOI
  41. Lambert P.A., 2002, Mechanisms of antibiotic resistance in Pseudomonas aeruginosa, J Roy Soc Med, 95, 22
  42. 10.1128/jb.179.23.7595-7599.1997 · DOI
  43. 10.3389/fcimb.2017.00059 · DOI
  44. 10.1128/JB.182.17.4764-4772.2000 · DOI
  45. 10.1073/pnas.95.12.6803 · DOI
  46. 10.4236/abb.2011.23021 · DOI
  47. 10.1073/pnas.82.23.8129 · DOI
  48. 10.1128/AEM.00354-12 · DOI
  49. 10.1021/bi047581f · DOI
  50. 10.1038/28190 · DOI
  51. 10.1016/0304-4165(91)90014-8 · DOI
  52. 10.3389/fmicb.2013.00422 · DOI
  53. Nikel P.I., 2016, Hydrocarbon and Lipid Microbiology Protocols–Synthetic and Systems Biology–Tools, 39
  54. 10.1016/j.ymben.2012.09.006 · DOI
  55. 10.1016/j.nbt.2014.02.006 · DOI
  56. 10.1016/j.ymben.2018.05.005 · DOI · Paper page
  57. 10.1159/000111992 · DOI
  58. 10.1074/jbc.M115.687749 · DOI
  59. 10.1111/1462-2920.13434 · DOI
  60. 10.1021/es990646v · DOI
  61. 10.1128/AAC.44.4.827-834.2000 · DOI
  62. 10.1128/mBio.00500-17 · DOI
  63. 10.1128/AEM.68.8.4145-4147.2002 · DOI
  64. 10.1016/j.bbamem.2005.09.010 · DOI
  65. 10.1038/s41598-018-30367-z · DOI
  66. 10.1128/JB.00101-06 · DOI · Paper page
  67. 10.1023/A:1018492217623 · DOI
  68. 10.1111/j.1745-6584.2006.00199.x · DOI
  69. 10.1021/bi00522a006 · DOI
  70. 10.1016/j.jbiotec.2017.05.006 · DOI
  71. 10.1021/acssynbio.6b00230 · DOI
  72. 10.1016/j.ymben.2019.04.005 · DOI
  73. 10.1038/nmeth.2019 · DOI · Paper page
  74. 10.1016/j.micres.2005.06.002 · DOI
  75. 10.1128/JB.01368-07 · DOI
  76. Sharrow S.O., 2001, Analysis of flow cytometry data, Curr Protoc Immunol, 5, 5.2.1‐5.2.10
  77. 10.1128/AAC.00784-19 · DOI
  78. 10.1002/(SICI)1097-0290(19961005)52:1<176::AID-BIT18>3.0.CO;2-M · DOI
  79. 10.1093/nar/gks1119 · DOI
  80. Slonczewski J.L., 2009, Cytoplasmic pH measurement and homeostasis in bacteria and archaea, Adv Microb Physiol, 55, 799
  81. 10.1007/978-3-319-43676-0_57-1 · DOI
  82. 10.1128/mSphere.00276-17 · DOI
  83. 10.1111/1751-7915.13383 · DOI
  84. 10.1016/bs.ampbs.2018.06.002 · DOI
  85. 10.1038/nprot.2007.521 · DOI · Paper page
  86. 10.1111/1751-7915.13396 · DOI
  87. 10.1128/jb.152.2.636-642.1982 · DOI
  88. 10.1038/nprot.2011.432 · DOI
  89. 10.1371/journal.pone.0135198 · DOI

Cited by

Sorted by citations

See all 40

Metadata

Authors
Arce‐Rodríguez, A., Volke, D. C., Bense, S., Häussler, S., & Nikel, P. I.
Affiliations
  • Department of Molecular Bacteriology Helmholtz Centre for Infection Research 38124 Braunschweig Germany
  • The Novo Nordisk Foundation Center for Biosustainability Technical University of Denmark 2800 Kongens Lyngby Denmark
Venue
Microbial Biotechnology
Publisher
Wiley
Published
2019-06-04
Volume
12
Issue
4
Pages
799-813
ISSN
1751-7915
Cited by
40
References
1
Language
en
Funders
  • Novo Nordisk Fonden (NNF10CC1016517)
  • Horizon 2020 Framework Programme (814418)
  • Communities Foundation of Texas (SRC 017)
  • H2020 European Research Council (COMBAT 724290)

About these checks

Registry, retraction, Cites and statistics results are computed, not judged, with one exception: a printed reference that no index lists is read once by a model before it counts as a citation error. Claims are extracted by a model and kept only when their quote appears verbatim in the text; each cited source is then checked, with a model’s help, for whether it says what the claim relies on. Those verdicts can be wrong — read the claim’s quote and the cited source before relying on one.

Statistics and arithmetic are recomputed, not judged.

Confidence bands are shown only for fields calibrated on our annotated test set. None is calibrated yet, so no band is shown.

What counts as a claim ›How we measure confidence ›How we check this ›

Are you an author, or do you see a problem with this page? Request a review

How to cite

Cite CoChat for the checks on this page, and the paper for its own findings.

This page
CoChat. (2026). Citation check: Non‐invasive, ratiometric determination of intracellular pH in Pseudomonas species using a novel genetically encoded indicator. https://app.cochat.ai/papers/10.1111/1751-7915.13439
The paper
Arce‐Rodríguez, A., Volke, D. C., Bense, S., Häussler, S., & Nikel, P. I. (2019). Non‐invasive, ratiometric determination of intracellular pH in Pseudomonas species using a novel genetically encoded indicator. Microbial Biotechnology. https://doi.org/10.1111/1751-7915.13439