Cited by 74

The DOI matches its Crossref record; 3 of the 3 references it cites were found in a registry or an index.

Collagenase-resistant collagen promotes mouse aging and vascular cell senescence

Vafaie, Faran, Yin, Hao, O'Neil, Caroline, Nong, Zengxuan, Watson, Alanna, Arpino, John‐Michael, Chu, Michael W. A., Wayne Holdsworth, David, Gros, Robert, Pickering, J. Geoffrey·2014·Aging Cell

Abstract

Summary: Collagen fibrils become resistant to cleavage over time. We hypothesized that resistance to type I collagen proteolysis not only marks biological aging but also drives it. To test this, we followed mice with a targeted mutation (Col1a1 r/r) that yields collagenase‐resistant type I collagen. Compared with wild‐type littermates, Col1a1 r/r mice had a shortened lifespan and developed features of premature aging including kyphosis, weight loss, decreased bone mineral density, and hypertension. We also found that vascular smooth muscle cells (SMC s) in the aortic wall of Col1a1 r/r mice were susceptible to stress‐induced senescence, displaying senescence‐associated ß‐galactosidase (SA‐ßG al) activity and upregulated p16 INK4A in response to angiotensin II infusion. To elucidate the basis of this pro‐aging effect, vascular SMC s from twelve patients undergoing coronary artery bypass surgery were cultured on collagen derived from Col1a1 r/r or wild‐type mice. This revealed that mutant collagen directly reduced replicative lifespan and increased stress‐induced SA‐ßG al activity, p16 INK4A expression, and p21 CIP1 expression. The pro‐senescence effect of mutant collagen was blocked by vitronectin, a ligand for αvß3 integrin that is presented by denatured but not native collagen. Moreover, inhibition of αvß3 with echistatin or with αvß3‐blocking antibody increased senescence of SMC s on wild‐type collagen. These findings reveal a novel aging cascade whereby resistance to collagen cleavage accelerates cellular aging. This interplay between extracellular and cellular compartments could hasten mammalian aging and the progression of aging‐related diseases.

Overview

The claims and statistics of this paper haven’t been checked yet.

Run the check — free, no account needed. It reads the open-access text and checks the sources it cites.

A few free checks a day · papers already verified open instantly · results are public

Integrity signals

Registry

Crossref · 10.1111/acel.12155

Cites

3 of 3 references verified0 citation errors · 0 not checkable

Statistics

Figures

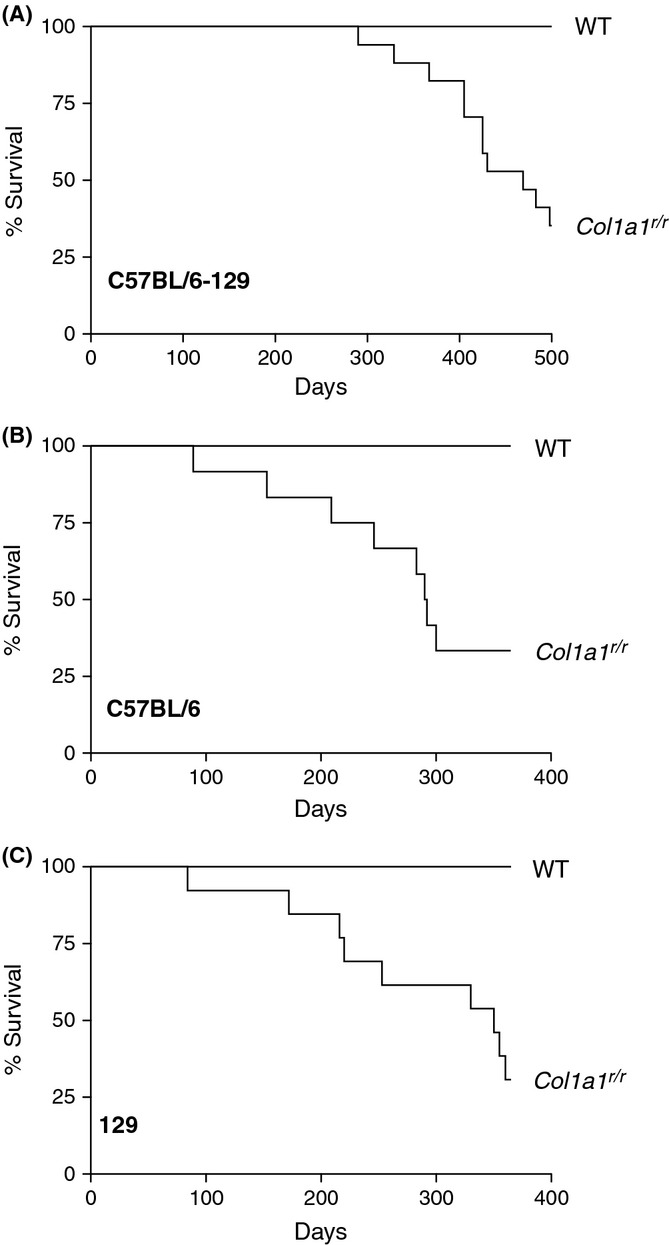
Figure 1 Col1a1r/r mice have shortened lifespan. Kaplan–Meier survival curves of male wild-type (WT) and Col1a1r/r mice on three different genetic backgrounds. (A) Survival of mixed C57BL/6-129 mice; n = 16 and 17 for WT and Col1a1r/r mice, respectively. P < 0.001. (B) Survival of C57BL/6 mice; n = 11 and 12 for WT and Col1a1r/r mice, respectively. P = 0.001. (C) Survival of 129 mice; n = 13 and 14 for WT and Col1a1r/r mice, respectively. P = 0.005.
Figure 1 Col1a1r/r mice have shortened lifespan. Kaplan–Meier survival curves of male wild-type (WT) and Col1a1r/r mice on three different genetic backgrounds. (A) Survival of mixed C57BL/6-129 mice; n = 16 and 17 for WT and Col1a1r/r mice, respectively. P < 0.001. (B) Survival of C57BL/6 mice; n = 11 and 12 for WT and Col1a1r/r mice, respectively. P = 0.001. (C) Survival of 129 mice; n = 13 and 14 for WT and Col1a1r/r mice, respectively. P = 0.005.CC BY · PubMed Central
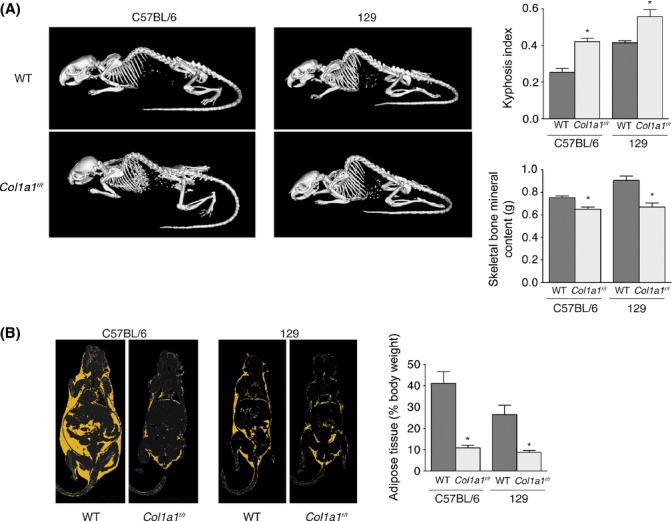
Figure 2 Col1a1r/r mice exhibit premature aging phenotypes. (A) Three-dimensional surface renderings of micro-CT images of 15.5-month-old C57BL/6 mice and 17-month-old 129 mice. Wild-type and Col1a1r/r littermates are shown and illustrate increased dorsal kyphosis in the mutant mice. The average kyphotic index of mice at 7–17 months of age (n = 7 WT, 8 mutant) is shown in the bar graph on the right. *P = 0.011 for C57BL/6 mice, P = 0.007 for 129 mice. Skeletal bone mineral content is reduced in Col1a1r/r 129 mice, as shown in the graph. *P < 0.001. (B) Micro-CT image depicting adipose tissue (yellow) of wild-type and Col1a1r/r littermate pairs of C57BL/6 and 129 mice. The bar graph shows the average proportion of adipose tissue (% body weight) of wild-type and Col1a1r/r mice. *P = 0.006 for mice on the C57BL/6 background, P = 0.004 for mice on the 129 background.
Figure 2 Col1a1r/r mice exhibit premature aging phenotypes. (A) Three-dimensional surface renderings of micro-CT images of 15.5-month-old C57BL/6 mice and 17-month-old 129 mice. Wild-type and Col1a1r/r littermates are shown and illustrate increased dorsal kyphosis in the mutant mice. The average kyphotic index of mice at 7–17 months of age (n = 7 WT, 8 mutant) is shown in the bar graph on the right. *P = 0.011 for C57BL/6 mice, P = 0.007 for 129 mice. Skeletal bone mineral content is reduced in Col1a1r/r 129 mice, as shown in the graph. *P < 0.001. (B) Micro-CT image depicting adipose tissue (yellow) of wild-type and Col1a1r/r littermate pairs of C57BL/6 and 129 mice. The bar graph shows the average proportion of adipose tissue (% body weight) of wild-type and Col1a1r/r mice. *P = 0.006 for mice on the C57BL/6 background, P = 0.004 for mice on the 129 background.CC BY · PubMed Central
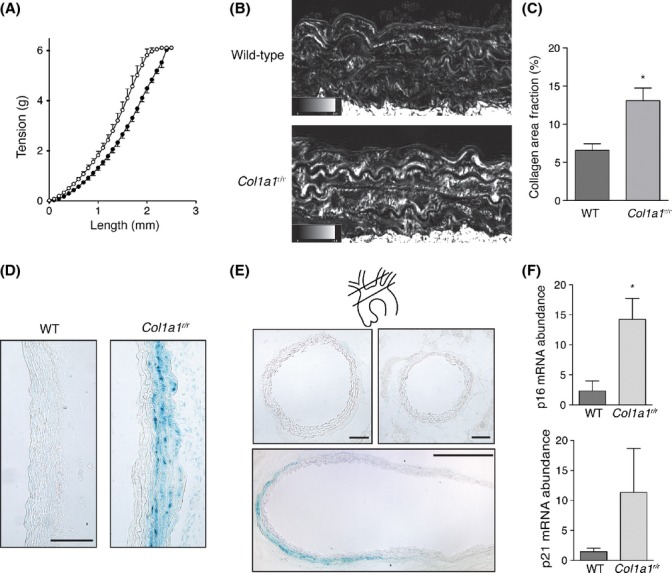
Figure 3 Aortic mechanics, fibrillar collagen content, and susceptibility to smooth muscle cell (SMC) senescence in Col1a1r/r mice. (A) Length–tension relationships of thoracic aortic ring segments from wild-type (closed circles, n = 4) and Col1a1r/r (open circles, n = 5) 13-month-old mice. P < 0.001. (B) Microscopic images of sections of the descending thoracic aorta from 15-month-old mice stained with picrosirius red and imaged with circularly polarized light. Birefringent collagen fibrils appear bright. The area fraction of birefringent collagen within the media is depicted in the graph in (C) Data in the graph are from three littermate pairs. *P = 0.010. (D) Light micrographs of the ascending aorta of wild-type and Col1a1r/r 13-month-old mice, harvested after 28 days of Ang II infusion and stained for senescence-associated ß-galactosidase (SA-ßGal) activity. Intense staining is evident in the outer medial layers of Col1a1r/r mice, but not in the aorta of wild-type mice. Bar, 100 μm. (E) Micrographs of sections of the brachiocephalic artery (upper left; bar, 100 μm), left carotid artery (upper right; bar, 100 μm), and a composite of the aortic arch (lower; bar, 500 μm). SA-ßGal activity is present in the outer medial layers of the aortic arch, with no activity in the proximal brachiocephalic or left carotid arteries. Section planes are depicted in the schematic. (F) Graphs depicting quantitative PCR assays for mRNA abundance of p16INK4A (upper) and p21CIP1 (lower) in thoracic aorta from Ang II-infused mice. Data are from 3 experiments. *P = 0.036.
Figure 3 Aortic mechanics, fibrillar collagen content, and susceptibility to smooth muscle cell (SMC) senescence in Col1a1r/r mice. (A) Length–tension relationships of thoracic aortic ring segments from wild-type (closed circles, n = 4) and Col1a1r/r (open circles, n = 5) 13-month-old mice. P < 0.001. (B) Microscopic images of sections of the descending thoracic aorta from 15-month-old mice stained with picrosirius red and imaged with circularly polarized light. Birefringent collagen fibrils appear bright. The area fraction of birefringent collagen within the media is depicted in the graph in (C) Data in the graph are from three littermate pairs. *P = 0.010. (D) Light micrographs of the ascending aorta of wild-type and Col1a1r/r 13-month-old mice, harvested after 28 days of Ang II infusion and stained for senescence-associated ß-galactosidase (SA-ßGal) activity. Intense staining is evident in the outer medial layers of Col1a1r/r mice, but not in the aorta of wild-type mice. Bar, 100 μm. (E) Micrographs of sections of the brachiocephalic artery (upper left; bar, 100 μm), left carotid artery (upper right; bar, 100 μm), and a composite of the aortic arch (lower; bar, 500 μm). SA-ßGal activity is present in the outer medial layers of the aortic arch, with no activity in the proximal brachiocephalic or left carotid arteries. Section planes are depicted in the schematic. (F) Graphs depicting quantitative PCR assays for mRNA abundance of p16INK4A (upper) and p21CIP1 (lower) in thoracic aorta from Ang II-infused mice. Data are from 3 experiments. *P = 0.036.CC BY · PubMed Central
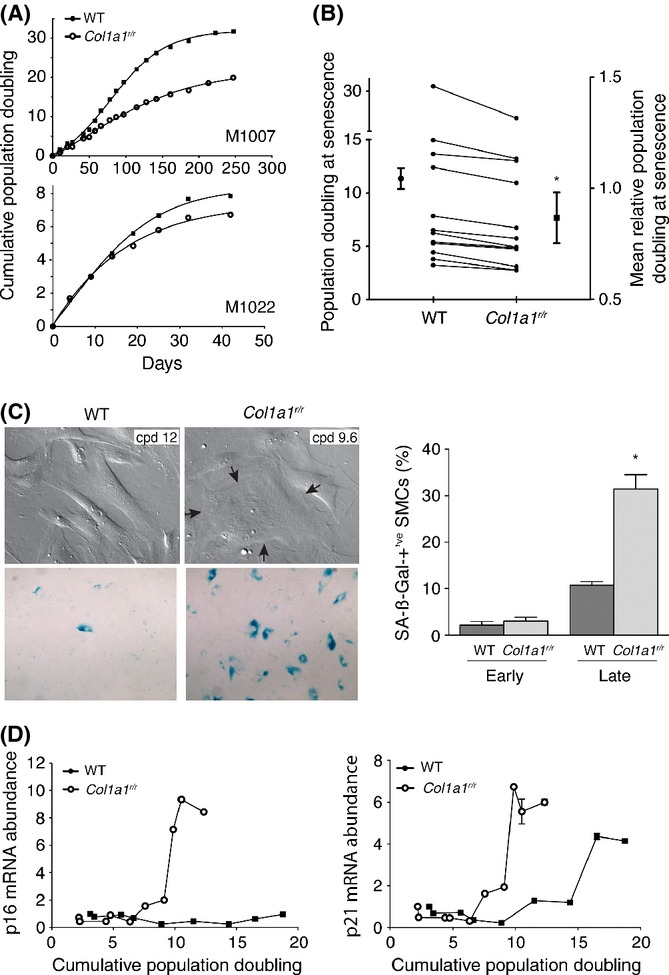
Figure 4 Effect of collagenase-resistant collagen on longevity and replicative senescence of human smooth muscle cells (SMCs). Human vascular SMCs were derived from the internal thoracic artery of patients undergoing coronary bypass surgery. Replicative lifespan and development of senescence was determined for SMCs cultured on mouse tail collagen isolated from wild-type or Col1a1r/r mice. (A) Cumulative population doubling curves of a long-lived (M1007) and short-lived (M1022) SMC line showing reduced longevity imposed by mutant collagen. (B) Individual and averaged data for SMCs from 12 patients showing replicative lifespan on wild-type and Col1a1r/r collagen. The mean relative population doubling at senescence was expressed in terms of the lifespan on wild-type collagen for each line. P < 0.001. (C) Hoffmann-modulated contrast images (upper panels) showing the emergence of highly spread SMCs on Col1a1r/r collagen, at relatively early cumulative population doubling compared with those plated on wild-type collagen. A large SMC with thick microfilament bundles and two nuclei is demarcated by the arrows. Light microscope images of parallel cultures stained for SA-ßGal activity (lower panels) show abundant SA-ßGal activity in SMCs on mutant collagen. Quantitative data for the proportion of SA-ßgal-positive SMCs at early (0–5 population doublings) and late (8–13 population doublings) replicative age is shown on the right. *P = 0.003 vs. late-age SMCs on wild-type collagen. (D) Transcript abundance of p16INK4A and p21CIP1, quantified by real-time PCR, was serially tracked for SMCs on wild-type or Col1a1r/r collagen. P < 0.001 for both targets.
Figure 4 Effect of collagenase-resistant collagen on longevity and replicative senescence of human smooth muscle cells (SMCs). Human vascular SMCs were derived from the internal thoracic artery of patients undergoing coronary bypass surgery. Replicative lifespan and development of senescence was determined for SMCs cultured on mouse tail collagen isolated from wild-type or Col1a1r/r mice. (A) Cumulative population doubling curves of a long-lived (M1007) and short-lived (M1022) SMC line showing reduced longevity imposed by mutant collagen. (B) Individual and averaged data for SMCs from 12 patients showing replicative lifespan on wild-type and Col1a1r/r collagen. The mean relative population doubling at senescence was expressed in terms of the lifespan on wild-type collagen for each line. P < 0.001. (C) Hoffmann-modulated contrast images (upper panels) showing the emergence of highly spread SMCs on Col1a1r/r collagen, at relatively early cumulative population doubling compared with those plated on wild-type collagen. A large SMC with thick microfilament bundles and two nuclei is demarcated by the arrows. Light microscope images of parallel cultures stained for SA-ßGal activity (lower panels) show abundant SA-ßGal activity in SMCs on mutant collagen. Quantitative data for the proportion of SA-ßgal-positive SMCs at early (0–5 population doublings) and late (8–13 population doublings) replicative age is shown on the right. *P = 0.003 vs. late-age SMCs on wild-type collagen. (D) Transcript abundance of p16INK4A and p21CIP1, quantified by real-time PCR, was serially tracked for SMCs on wild-type or Col1a1r/r collagen. P < 0.001 for both targets.CC BY · PubMed Central
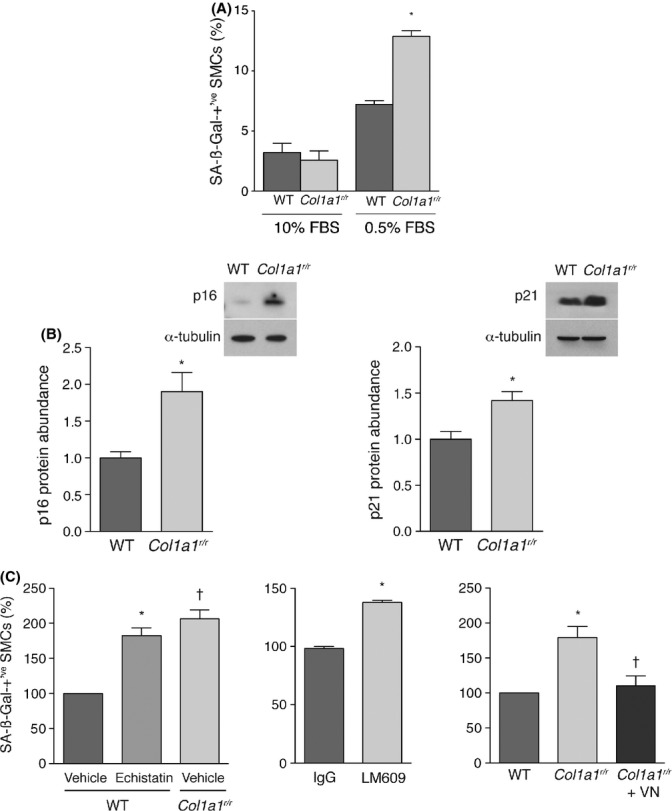
Figure 5 Col1a1r/r collagen promotes stress-induced premature senescence of smooth muscle cells (SMCs) through insufficient engagement of αvß3 integrin. (A) Graph showing the proportion of SMCs on wild-type or Col1a1r/r collagen with SA-ßGal activity. Cells were cultured with 10% FBS which was either replenished (n = 3) or switched to 0.5% FBS for 3 days to impart to low-serum stress (n = 11). *P < 0.001. (B) Representative Western blots and summary graphs showing p16INK4A and p21CIP1 mRNA abundance in SMCs on the designated collagen substrate after 3 days of low-serum stress. Data in the graph are from four separate experiments *P = 0.017 for p16INK4A, *P = 0.031 for p21CIP1. (C) Graphs showing the effects of echistatin (100 nm, left panel), αvβ3 integrin-blocking antibody LM609 (50 μg mL−1, middle panel), and vitronectin (50 ng cm−2, right panel) on the relative proportion of SMCs in low-serum conditions that displayed SA-ßGal activity. Data are from 3–7 experiments. *P < 0.001 vs. vehicle, †P < 0.001 vs. vehicle (left graph); *P = 0.004 (middle graph); *P = 0.015 vs. wild-type collagen, †P = 0.003 vs. SMCs on Col1a1r/r collagen (right graph).
Figure 5 Col1a1r/r collagen promotes stress-induced premature senescence of smooth muscle cells (SMCs) through insufficient engagement of αvß3 integrin. (A) Graph showing the proportion of SMCs on wild-type or Col1a1r/r collagen with SA-ßGal activity. Cells were cultured with 10% FBS which was either replenished (n = 3) or switched to 0.5% FBS for 3 days to impart to low-serum stress (n = 11). *P < 0.001. (B) Representative Western blots and summary graphs showing p16INK4A and p21CIP1 mRNA abundance in SMCs on the designated collagen substrate after 3 days of low-serum stress. Data in the graph are from four separate experiments *P = 0.017 for p16INK4A, *P = 0.031 for p21CIP1. (C) Graphs showing the effects of echistatin (100 nm, left panel), αvβ3 integrin-blocking antibody LM609 (50 μg mL−1, middle panel), and vitronectin (50 ng cm−2, right panel) on the relative proportion of SMCs in low-serum conditions that displayed SA-ßGal activity. Data are from 3–7 experiments. *P < 0.001 vs. vehicle, †P < 0.001 vs. vehicle (left graph); *P = 0.004 (middle graph); *P = 0.015 vs. wild-type collagen, †P = 0.003 vs. SMCs on Col1a1r/r collagen (right graph).CC BY · PubMed Central
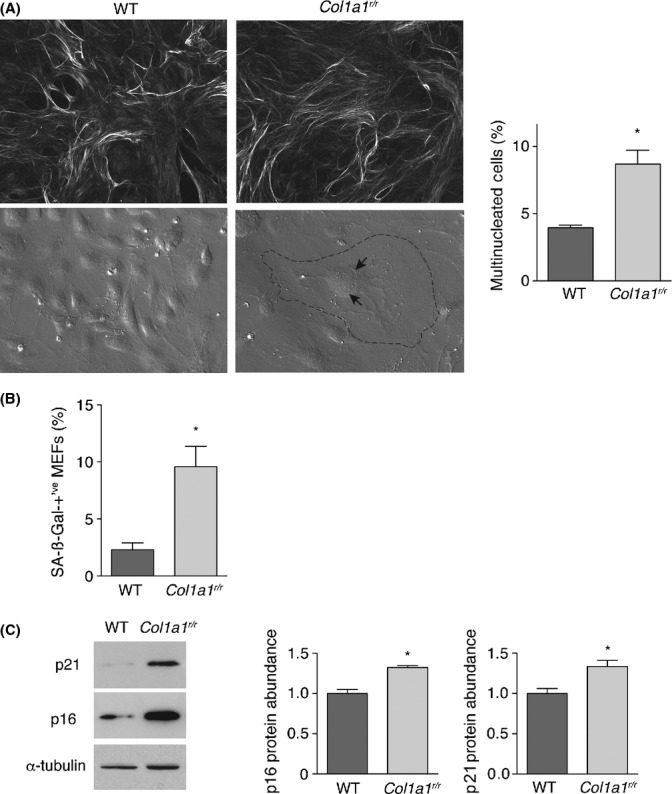
Figure 6 Mouse embryonic fibroblasts (MEFs) from Col1a1r/r mice exhibit enhanced senescence. (A) Top Circular polarization microscopy images of collagen fibril networks elaborated over 14 days by wild-type and Col1a1r/r MEFs, showing elaborate networks in both cases. Cultures were stained with picosirius red. Bottom Hoffman-modulated contrast images of 6th passage wild-type and Col1a1r/r MEFs, illustrating emergence of large (dashed perimeter line), multinucleated (arrows) Col1a1r/r MEFs. The proportions of multinucleated MEFs from 3 separate MEF lines from both mouse strains are shown on the right. *P = 0.011. (B) Graph showing the proportion of wild-type and Col1a1r/r MEFs that display SA-ßGal activity. *P = 0.018. (C) Western blots showing the relative abundance of p16INK4A and p21CIP1 in wild-type and Col1a1r/r MEFs at passage 6, with quantitative data from 3 lines from each mouse strain harvested at passage 5 or 6 shown in the graphs. *P = 0.005 for p16INK4A; P = 0.014 for p21CIP1.
Figure 6 Mouse embryonic fibroblasts (MEFs) from Col1a1r/r mice exhibit enhanced senescence. (A) Top Circular polarization microscopy images of collagen fibril networks elaborated over 14 days by wild-type and Col1a1r/r MEFs, showing elaborate networks in both cases. Cultures were stained with picosirius red. Bottom Hoffman-modulated contrast images of 6th passage wild-type and Col1a1r/r MEFs, illustrating emergence of large (dashed perimeter line), multinucleated (arrows) Col1a1r/r MEFs. The proportions of multinucleated MEFs from 3 separate MEF lines from both mouse strains are shown on the right. *P = 0.011. (B) Graph showing the proportion of wild-type and Col1a1r/r MEFs that display SA-ßGal activity. *P = 0.018. (C) Western blots showing the relative abundance of p16INK4A and p21CIP1 in wild-type and Col1a1r/r MEFs at passage 6, with quantitative data from 3 lines from each mouse strain harvested at passage 5 or 6 shown in the graphs. *P = 0.005 for p16INK4A; P = 0.014 for p21CIP1.CC BY · PubMed Central

Verification

Claims the paper makes

The claims and statistics of this paper haven’t been checked yet.

Run the check — free, no account needed. It reads the open-access text and checks the sources it cites.

A few free checks a day · papers already verified open instantly · results are public

Claims other papers make about this one

Each is checked against this paper’s own text: does it say what the citing paper says it does?

Self-check

Percentages, sums and reported differences re-computed from the paper’s own numbers.

The self-check needs the paper’s full text.

Citations

Cites

Show all 3 references

Research works printed but not linked: 42

  1. 10.1083/jcb.147.3.619 · DOI
  2. 10.1111/j.1749-6632.2012.06493.x · DOI
  3. 10.1126/science.1064829 · DOI · Paper page
  4. 10.1016/0006-291X(92)91834-D · DOI
  5. 10.1021/bi00680a034 · DOI
  6. 10.1074/jbc.M400711200 · DOI
  7. 10.1161/CIRCRESAHA.108.187302 · DOI
  8. 10.1038/nbt.1845 · DOI
  9. 10.1152/japplphysiol.00016.2010 · DOI
  10. 10.1016/0005-2795(71)90226-1 · DOI
  11. 10.1016/0531-5565(72)90061-7 · DOI
  12. 10.1161/CIRCRESAHA.107.158626 · DOI
  13. 10.1016/j.febslet.2009.08.031 · DOI
  14. 10.1016/1050-1738(94)90037-X · DOI
  15. 10.1161/CIRCULATIONAHA.106.626606 · DOI · Paper page
  16. 10.1038/36285 · DOI · Paper page
  17. 10.1074/jbc.M005139200 · DOI
  18. 10.1083/jcb.130.1.227 · DOI
  19. 10.1007/978-1-4684-3734-8_4 · DOI
  20. 10.1161/01.CIR.0000093274.82929.22 · DOI
  21. 10.1161/01.RES.79.4.821 · DOI
  22. 10.1196/annals.1333.061 · DOI
  23. 10.1073/pnas.91.19.8856 · DOI
  24. 10.1016/j.ajpath.2011.07.017 · DOI
  25. 10.1161/CIRCRESAHA.109.212837 · DOI
  26. 10.1016/0735-1097(92)90259-P · DOI
  27. 10.1016/S0002-9149(96)00384-0 · DOI
  28. 10.1161/01.RES.80.5.627 · DOI
  29. 10.1161/CIRCRESAHA.110.221846 · DOI
  30. 10.1161/01.ATV.21.1.40 · DOI
  31. 10.1152/physrev.00012.2007 · DOI
  32. 10.1097/00004872-200107000-00009 · DOI
  33. 10.1074/jbc.C700018200 · DOI
  34. 10.1042/bj1810639 · DOI
  35. 10.1097/MNH.0b013e3283361c0b · DOI
  36. 10.1007/BF00788278 · DOI
  37. 10.1073/pnas.87.15.5888 · DOI
  38. 10.1002/0471142727.mb2801s70 · DOI
  39. 10.1111/j.1474-9726.2007.00274.x · DOI
  40. 10.1196/annals.1395.038 · DOI
  41. 10.1172/JCI5481 · DOI
  42. 10.3181/00379727-152-39397 · DOI

Cited by

Sorted by citations

Metadata

Authors
Vafaie, F., Yin, H., O'Neil, C., Nong, Z., Watson, A., Arpino, J., Chu, M. W. A., Wayne Holdsworth, D., Gros, R., & Pickering, J. G.
Affiliations
  • Robarts Research Institute Western University London ON Canada
  • Department of Surgery Western University London ON Canada
Venue
Aging Cell
Publisher
Wiley
Published
2013-09-19
Volume
13
Issue
1
Pages
121-130
ISSN
  • 1474-9718
  • 1474-9726
Cited by
74
References
3
Language
en

About these checks

Registry, retraction, Cites and statistics results are computed, not judged, with one exception: a printed reference that no index lists is read once by a model before it counts as a citation error. Claims are extracted by a model and kept only when their quote appears verbatim in the text; each cited source is then checked, with a model’s help, for whether it says what the claim relies on. Those verdicts can be wrong — read the claim’s quote and the cited source before relying on one.

Statistics and arithmetic are recomputed, not judged.

Confidence bands are shown only for fields calibrated on our annotated test set. None is calibrated yet, so no band is shown.

What counts as a claim ›How we measure confidence ›How we check this ›

Are you an author, or do you see a problem with this page? Request a review