

The DOI matches its Crossref record; 88 of the 88 references it cites were found in a registry or an index.
Determinants of accelerated metabolomic and epigenetic aging in a UK cohort
Open accessPublished version of a preprint
Abstract
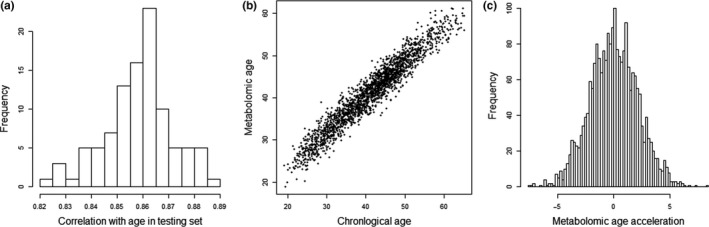
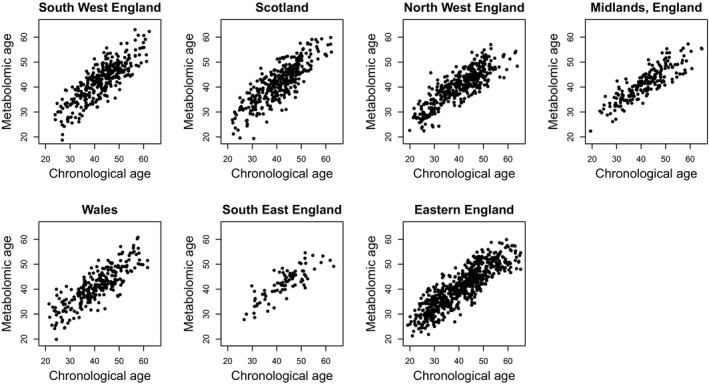
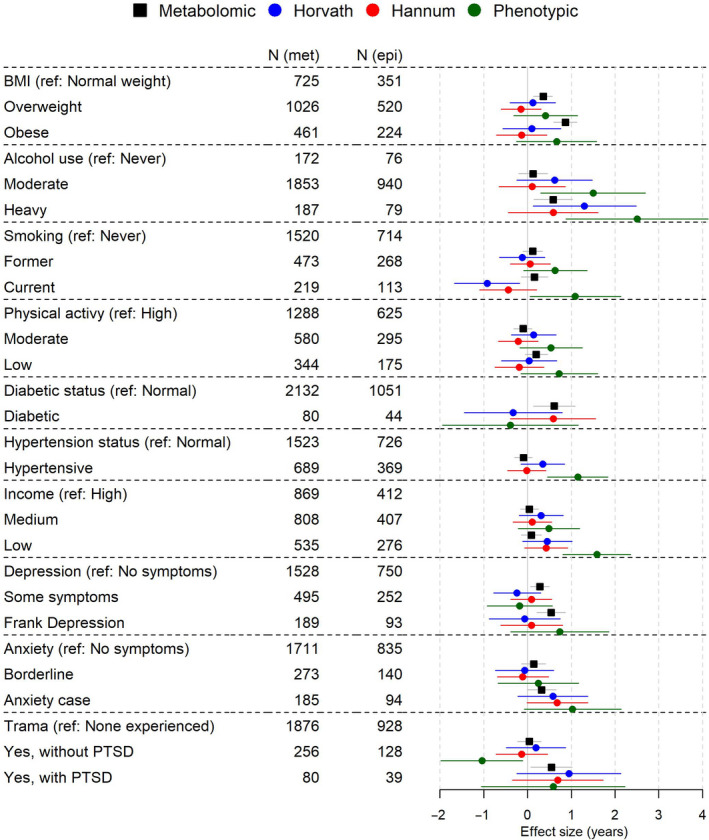
Markers of biological aging have potential utility in primary care and public health. We developed a model of age based on untargeted metabolic profiling across multiple platforms, including nuclear magnetic resonance spectroscopy and liquid chromatography–mass spectrometry in urine and serum, within a large sample ( N = 2,239) from the UK Airwave cohort. We validated a subset of model predictors in a Finnish cohort including repeat measurements from 2,144 individuals. We investigated the determinants of accelerated aging, including lifestyle and psychological risk factors for premature mortality. The metabolomic age model was well correlated with chronological age (mean r = .86 across independent test sets). Increased metabolomic age acceleration (mAA) was associated after false discovery rate (FDR) correction with overweight/obesity, diabetes, heavy alcohol use and depression. DNA methylation age acceleration measures were uncorrelated with mAA. Increased DNA methylation phenotypic age acceleration ( N = 1,110) was associated after FDR correction with heavy alcohol use, hypertension and low income. In conclusion, metabolomics is a promising approach for the assessment of biological age and appears complementary to established epigenetic clocks.
Overview
The claims and statistics of this paper haven’t been checked yet.
Run the check — free, no account needed. It reads the open-access text and checks the sources it cites.
Integrity signals
Registry
Cites
Statistics
Figures
Verification
Claims the paper makes
The claims and statistics of this paper haven’t been checked yet.
Run the check — free, no account needed. It reads the open-access text and checks the sources it cites.
Claims other papers make about this one
Each is checked against this paper’s own text: does it say what the citing paper says it does?
The cited source says what the claim attributes to it.
In the citing paper
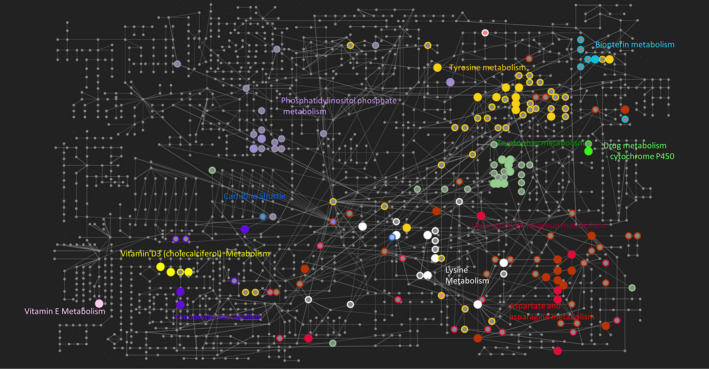
“Robinson et al.120 additionally assessed mass spectrometry metabolomic ageing clocks for the enrichment of biological pathways and identified enrichments for the metabolism of several vitamins, amino acids and xenobiotics.”
From Measuring biological age using omics data (2022) · cites this paper as [120]
In the citing paper
“Metabolomic age acceleration correlated with triglyceride levels, obesity, heavy drinking, diabetes mellitus, depressive symptoms, depression, anxiety and post-traumatic stress disorder.”
From Measuring biological age using omics data (2022) · cites this paper as [120]
In the citing paper
“Furthermore, metabolomic clocks have demonstrated lower age prediction accuracy than other omics data types despite training on extremely large sample sizes, and effect sizes for ageing traits have been modest113,116–121.”
From Measuring biological age using omics data (2022) · cites this paper as [120]
In the citing paper
“and Robinson et al.’s metabolomic age gap had no correlation with the Horvath, Hannum and PhenoAge clocks in the same cohort, yet there was some overlap in the correlation between age gap and phenotypes tested120.”
From Measuring biological age using omics data (2022) · cites this paper as [120]
In the citing paper
“This study compared multiple untargeted metabolomic methods for developing ageing clocks”
From Measuring biological age using omics data (2022) · cites this paper as [120]
In the citing paper
“and additionally assessed their relationship to health traits and to the Horvath, Hannum and PhenoAge epigenetic ageing clocks.”
From Measuring biological age using omics data (2022) · cites this paper as [120]
Self-check
Percentages, sums and reported differences re-computed from the paper’s own numbers.
The self-check needs the paper’s full text.
Citations
Cites
Controlling the False Discovery Rate: A Practical and Powerful Approach to Multiple Testing
Benjamini, Y., & Hochberg, Y. (1995) · Journal of the Royal Statistical Society Series B: Statistical Methodology · doi:10.1111/j.2517-6161.1995.tb02031.x · Cited by 109,482
The Hospital Anxiety and Depression Scale
Zigmond, A. S., & Snaith, R. P. (1983) · Acta Psychiatrica Scandinavica · doi:10.1111/j.1600-0447.1983.tb09716.x · Cited by 47,139
The PHQ-9: Validity of a brief depression severity measure
Kroenke, K., Spitzer, R. L., & Williams, J. B. W. (2001) · Journal of General Internal Medicine · doi:10.1046/j.1525-1497.2001.016009606.x · Cited by 44,910
Regularization and Variable Selection Via the Elastic Net
Zou, H., & Hastie, T. (2005) · Journal of the Royal Statistical Society Series B: Statistical Methodology · doi:10.1111/j.1467-9868.2005.00503.x · Cited by 20,957
Regularization Paths for Generalized Linear Models via Coordinate Descent
Friedman, J., Hastie, T., & Tibshirani, R. (2010) · Journal of Statistical Software · doi:10.18637/jss.v033.i01 · Cited by 19,927
López-Otín, C., Blasco, M. A., Partridge, L., Serrano, M., & Kroemer, G. (2013) · Cell · doi:10.1016/j.cell.2013.05.039 · Cited by 14,982
Depression and quality of life in older persons: A review
Sivertsen, H., Bjørkløf, G. H., Engedal, K., Selbæk, G., & Helvik, A.-S. (2015) · Dementia and Geriatric Cognitive Disorders · doi:10.1159/000437299 · Cited by 14,152
DNA methylation age of human tissues and cell types
Horvath, S. (2013) · Genome Biology · doi:10.1186/gb-2013-14-10-r115 · Cited by 7,075
Adherence to a Mediterranean diet and survival in a Greek population
Trichopoulou, A., Costacou, T., Bamia, C., & Trichopoulos, D. (2003) · New England Journal of Medicine · doi:10.1056/nejmoa025039 · Cited by 4,397
Genome-wide methylation profiles reveal quantitative views of human aging rates
Hannum, G., Guinney, J., Zhao, L., Zhang, L., Hughes, G., Sadda, S., Klotzle, B., Bibikova, M., Fan, J.-B., Gao, Y., et al. (2013) · Molecular Cell · doi:10.1016/j.molcel.2012.10.016 · Cited by 4,270
Research works printed but not linked: 2
- 10.1017/S0007125000161896 · DOI · Paper page
- World Health Organisation, 2013, Global action plan for the prevention and control of noncommunicable diseases 2013–2020
Cited by
Sorted by citations
Measuring biological age using omics data
Rutledge, J., Oh, H., & Wyss-Coray, T. (2022) · Nature Reviews Genetics · doi:10.1038/s41576-022-00511-7 · Cited by 570
Higgins-Chen, A. T., Thrush, K. L., Wang, Y., Minteer, C. J., Kuo, P.-L., Wang, M., Niimi, P., Sturm, G., Lin, J., Moore, A. Z., et al. (2022) · Nature Aging · doi:10.1038/s43587-022-00248-2 · Cited by 502
Bao, H., Cao, J., Chen, M., Min, C., Chen, W., Chen, X., Chen, Y., Chen, Y., Chen, Y., Chen, Z., et al. (2023) · Science China Life Sciences · doi:10.1007/s11427-023-2305-0 · Cited by 402
Vineis, P., Robinson, O., Chadeau‐Hyam, M., Dehghan, A., Mudway, I., & Dagnino, S. (2020) · Environment International · doi:10.1016/j.envint.2020.105887 · Cited by 324
Self-citationAssociations between alcohol consumption and gray and white matter volumes in the UK Biobank
Daviet, R., Aydogan, G., Jagannathan, K., Spilka, N. H., Koellinger, P., Kranzler, H. R., Nave, G., & Wetherill, R. R. (2022) · Nature Communications · doi:10.1038/s41467-022-28735-5 · Cited by 250
Metadata
- Authors
- Robinson, O., Chadeau Hyam, M., Karaman, I., Climaco Pinto, R., Ala-Korpela, M., Handakas, E., Fiorito, G., Gao, H., Heard, A., Jarvelin, M., Lewis, M., Pazoki, R., Polidoro, S., Tzoulaki, I., Wielscher, M., Elliott, P., & Vineis, P.
- Affiliations
- MRC Centre for Environment and Health (GB)
- MRC Centre for Environment and Health Department of Epidemiology and Biostatistics School of Public Health Imperial College London London UK
- Computational Medicine, Faculty of Medicine University of Oulu and Biocenter Oulu Oulu Finland
- University of Sassari (IT)
- Imperial College London (GB)
- Italian institute for Genomic Medicine (IT)
- Corresponding author
- Robinson, Oliver
- ORCID
- Venue
- Aging Cell
- Publisher
- Wiley
- Published
- 2020-05-03
- Volume
- 19
- Issue
- 6
- Pages
- e13149-e13149
- ISSN
- 1474-9718 (ISSN-L)
- 1474-9726
- PMC
- PMC7294785
- OpenAlex
- W3021249782
- Cited by
- 205
- References
- 87
- Citations by year
- 2026: 42 · 2025: 30 · 2024: 49 · 2023: 33 · 2022: 23 · 2021: 18 · 2020: 9
- FWCI
- 6.70
- Type
- journal article
- Language
- en
- Open access
- gold
- doi.org
- Licence
- Locations
- Aging Cell (publishedVersion, cc-by)
- bioRxiv (Cold Spring Harbor Laboratory) (acceptedVersion, cc-by-nc-nd)
- PubMed Central (publishedVersion, cc-by)
- PubMed (publishedVersion)
- Brunel University Research Archive (BURA) (Brunel University London) (submittedVersion, cc-by)
- UnissResearch (Università degli Studi di Sassari) (submittedVersion)
- Spiral (Imperial College London) (submittedVersion, cc-by)
- Funders
- Horizon 2020 Framework Programme (633666, 633595, 733206)
- Topics
- Life Sciences › Biochemistry, Genetics and Molecular Biology › Molecular Biology › Metabolomics and Mass Spectrometry Studies
- Life Sciences › Biochemistry, Genetics and Molecular Biology › Molecular Biology › Epigenetics and DNA Methylation
- Life Sciences › Biochemistry, Genetics and Molecular Biology › Aging › Genetics, Aging, and Longevity in Model Organisms
- Keywords
- biological aging, DNA methylation age, accelerated aging, untargeted metabolomics, lifestyle risk factors, alcohol consumption, depression, obesity, diabetes mellitus, hypertension, socioeconomic status, epigenetic clocks, cross-cohort validation
- MeSH terms
- Adult, Aged, Aging, Female, United Kingdom, Humans, Male, Middle Aged, Cohort Studies, DNA Methylation, Metabolomics, Young Adult, Epigenomics
About these checks
Registry, retraction, Cites and statistics results are computed, not judged, with one exception: a printed reference that no index lists is read once by a model before it counts as a citation error. Claims are extracted by a model and kept only when their quote appears verbatim in the text; each cited source is then checked, with a model’s help, for whether it says what the claim relies on. Those verdicts can be wrong — read the claim’s quote and the cited source before relying on one.
Statistics and arithmetic are recomputed, not judged.
Confidence bands are shown only for fields calibrated on our annotated test set. None is calibrated yet, so no band is shown.
What counts as a claim ›How we measure confidence ›How we check this ›
Are you an author, or do you see a problem with this page? Request a review
