

The DOI matches its Crossref record; 8 of the 8 references it cites were found in a registry or an index.
The antagonistic pleiotropy of insulin-like growth factor 1
Abstract
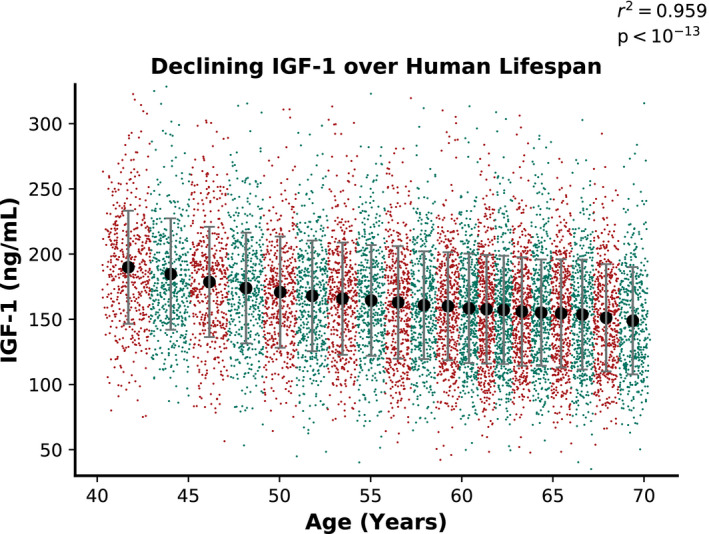
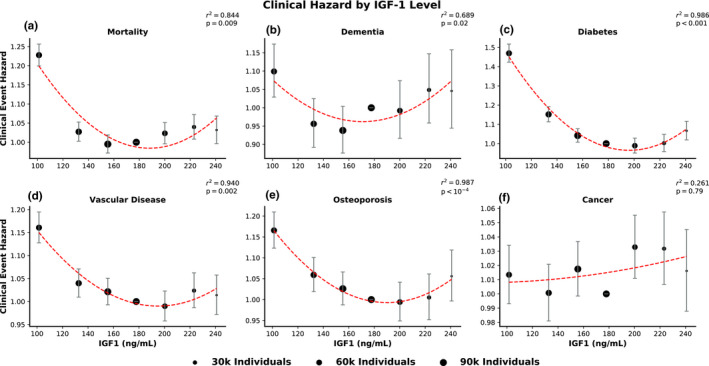
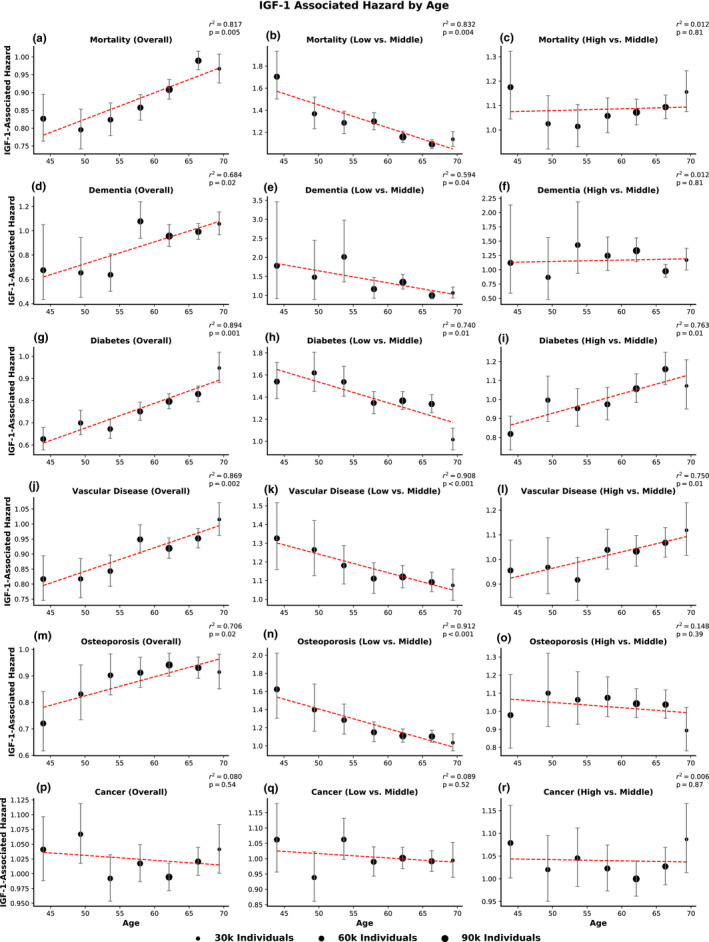
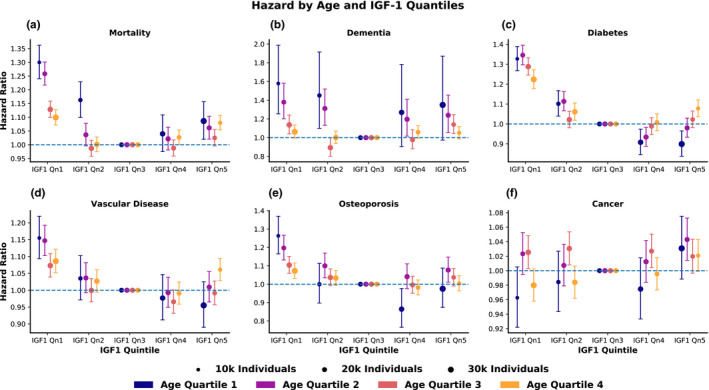
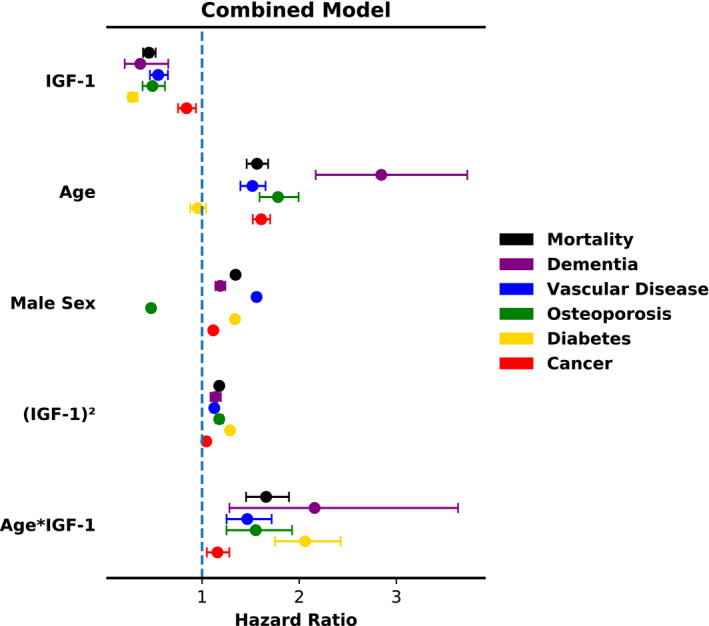
While insulin‐like growth factor‐1 (IGF‐1) is a well‐established modulator of aging and longevity in model organisms, its role in humans has been controversial. In this study, we used the UK Biobank ( n = 440,185) to resolve previous ambiguities in the relationship between serum IGF‐1 levels and clinical disease. We examined prospective associations of serum IGF‐1 with mortality, dementia, vascular disease, diabetes, osteoporosis, and cancer, finding two generalized patterns: First, IGF‐1 interacts with age to modify risk in a manner consistent with antagonistic pleiotropy; younger individuals with high IGF‐1 are protected from disease, while older individuals with high IGF‐1 are at increased risk for incident disease or death. Second, the association between IGF‐1 and risk is generally U‐shaped, indicating that both high and low levels of IGF‐1 may be detrimental. With the exception of a more uniformly positive relationship between IGF‐1 and cancer, these effects were remarkably consistent across a wide range of conditions, providing evidence for a unifying pathway that determines risk for most age‐associated diseases. These data suggest that IGF‐1 signaling could be harmful in older adults, who may actually benefit from the attenuation of biological growth pathways.
Overview
The claims and statistics of this paper haven’t been checked yet.
Run the check — free, no account needed. It reads the open-access text and checks the sources it cites.
Integrity signals
Registry
Cites
Statistics
Figures
Verification
Claims the paper makes
The claims and statistics of this paper haven’t been checked yet.
Run the check — free, no account needed. It reads the open-access text and checks the sources it cites.
Claims other papers make about this one
Each is checked against this paper’s own text: does it say what the citing paper says it does?
The cited source says what the claim attributes to it.
In the citing paper
“Moreover, in a large cohort from the UK Biobank, significant positive correlations were noted between the hazard associated with high IGF-1 and age for dementia, diabetes, vascular disease, osteoporosis and overall mortality 144 .”
From Hallmarks of aging: An expanding universe (2023) · cites this paper as [144]
Self-check
Percentages, sums and reported differences re-computed from the paper’s own numbers.
The self-check needs the paper’s full text.
Citations
Cites
López-Otín, C., Blasco, M. A., Partridge, L., Serrano, M., & Kroemer, G. (2013) · Cell · doi:10.1016/j.cell.2013.05.039 · Cited by 14,982
Geroscience: Linking Aging to Chronic Disease
Kennedy, B. K., Berger, S. L., Brunet, A., Campisi, J., Cuervo, A. M., Epel, E. S., Franceschi, C., Lithgow, G. J., Morimoto, R. I., Pessin, J. E., et al. (2014) · Cell · doi:10.1016/j.cell.2014.10.039 · Cited by 2,764
Critical nodes in signalling pathways: insights into insulin action
Taniguchi, C. M., Emanuelli, B., & Kahn, C. R. (2006) · Nature Reviews Molecular Cell Biology · doi:10.1038/nrm1837 · Cited by 2,760
Ageing as a Risk Factor for Disease
Niccoli, T., & Partridge, L. (2012) · Current Biology · doi:10.1016/j.cub.2012.07.024 · Cited by 1,831
Genetics of 35 blood and urine biomarkers in the UK Biobank
Sinnott-Armstrong, N., Tanigawa, Y., Amar, D., Mars, N., Benner, C., Aguirre, M., Venkataraman, G. R., Wainberg, M., Ollila, H. M., Kiiskinen, T., et al. (2021) · Nature Genetics · doi:10.1038/s41588-020-00757-z · Cited by 744
Functionally significant insulin-like growth factor I receptor mutations in centenarians
Suh, Y., Atzmon, G., Cho, M.-O., Hwang, D., Liu, B., Leahy, D. J., Barzilai, N., & Cohen, P. (2008) · Proceedings of the National Academy of Sciences · doi:10.1073/pnas.0705467105 · Cited by 703
Self-citationSelman, C., Lingard, S., Choudhury, A. I., Batterham, R. L., Claret, M., Clements, M., Ramadani, F., Okkenhaug, K., Schuster, E., Blanc, E., et al. (2008) · The FASEB Journal · doi:10.1096/fj.07-9261com · Cited by 532
Milman, S., Huffman, D. M., & Barzilai, N. (2016) · Cell Metabolism · doi:10.1016/j.cmet.2016.05.014 · Cited by 150
Self-citation
Research works printed but not linked: 36
- 10.1111/nyas.14305 · DOI
- 10.1530/EJE-08-0452 · DOI
- 10.1210/jc.2014-3968 · DOI
- 10.1073/pnas.0405775102 · DOI · Paper page
- 10.1038/384033a0 · DOI
- 10.1210/jc.2011-1377 · DOI
- 10.1038/s41586-018-0579-z · DOI · Paper page
- 10.1210/er.2002-0022 · DOI
- 10.1007/s11357-019-00065-3 · DOI
- 10.1210/jc.2008-2138 · DOI
- 10.1530/JME-18-0093 · DOI
- 10.1126/scitranslmed.3001845 · DOI
- 10.1093/gerona/glp017 · DOI
- 10.1016/S1096-6374(03)00038-8 · DOI
- 10.1038/366461a0 · DOI · Paper page
- 10.1038/270301a0 · DOI
- 10.1016/j.ghir.2015.08.004 · DOI
- 10.1007/s00125-020-05190-9 · DOI
- 10.1016/j.molmet.2018.01.013 · DOI
- 10.1073/pnas.0400337101 · DOI · Paper page
- 10.1038/s41467-018-04805-5 · DOI · Paper page
- 10.1111/acel.12213 · DOI
- 10.1038/sj.ijo.0800412 · DOI
- 10.1093/gerona/gls065 · DOI
- 10.12688/f1000research.17196.1 · DOI
- 10.1111/j.1474-9726.2009.00493.x · DOI
- 10.1111/j.1365-2265.1991.tb03495.x · DOI
- 10.1016/j.cell.2011.07.030 · DOI · Paper page
- 10.1093/gerona/glaa282 · DOI
- 10.1016/j.celrep.2016.01.044 · DOI
- 10.1210/jc.2012-2329 · DOI
- 10.1093/cvr/cvr321 · DOI
- 10.18632/aging.100841 · DOI
- 10.1016/j.jalz.2018.02.016 · DOI · Paper page
- 10.1111/j.1558-5646.1957.tb02911.x · DOI · Paper page
- 10.3390/cells9061368 · DOI · Paper page
Cited by
Sorted by citations
Hallmarks of aging: An expanding universe
López-Otín, C., Blasco, M. A., Partridge, L., Serrano, M., & Kroemer, G. (2023) · Cell · doi:10.1016/j.cell.2022.11.001 · Cited by 6,549
From geroscience to precision geromedicine: Understanding and managing aging
Kroemer, G., Maier, A. B., Cuervo, A. M., Gladyshev, V. N., Ferrucci, L., Gorbunova, V., Kennedy, B. K., Rando, T. A., Seluanov, A., Sierra, F., et al. (2025) · Cell · doi:10.1016/j.cell.2025.03.011 · Cited by 395
Fekete, M., Szarvas, Z., Fazekas-Pongor, V., Feher, A., Csipo, T., Forrai, J., Dosa, N., Peterfi, A., Lehoczki, A., Tarantini, S., et al. (2022) · Nutrients · doi:10.3390/nu15010047 · Cited by 137
Aging conundrum: A perspective for ovarian aging
Wu, J., Liu, Y., Song, Y., Wang, L., Ai, J., & Li, K. (2022) · Frontiers in Endocrinology · doi:10.3389/fendo.2022.952471 · Cited by 73
Metadata
- Authors
- Zhang, W. B., Ye, K., Barzilai, N., & Milman, S.
- Affiliations
- Department of Medicine Albert Einstein College of Medicine Bronx New York USA
- Department of Epidemiology and Population Health Albert Einstein College of Medicine Bronx New York USA
- ORCID
- Zhang, William B.
- Venue
- Aging Cell
- Publisher
- Wiley
- Published
- 2021-08-07
- Volume
- 20
- Issue
- 9
- ISSN
- 1474-9718
- 1474-9726
- PMC
- PMC8441393
- Cited by
- 62
- References
- 8
- Language
- en
- Funders
- National Institute on Aging (K23AG051148, R01AG061155, T32AG023475‐18)
- American Federation for Aging Research
About these checks
Registry, retraction, Cites and statistics results are computed, not judged, with one exception: a printed reference that no index lists is read once by a model before it counts as a citation error. Claims are extracted by a model and kept only when their quote appears verbatim in the text; each cited source is then checked, with a model’s help, for whether it says what the claim relies on. Those verdicts can be wrong — read the claim’s quote and the cited source before relying on one.
Statistics and arithmetic are recomputed, not judged.
Confidence bands are shown only for fields calibrated on our annotated test set. None is calibrated yet, so no band is shown.
What counts as a claim ›How we measure confidence ›How we check this ›
Are you an author, or do you see a problem with this page? Request a review
How to cite
Cite CoChat for the checks on this page, and the paper for its own findings.
- This page
- CoChat. (2026). Citation check: The antagonistic pleiotropy of insulin-like growth factor 1. https://app.cochat.ai/papers/10.1111/acel.13443
- The paper
- Zhang, W. B., Ye, K., Barzilai, N., & Milman, S. (2021). The antagonistic pleiotropy of insulin-like growth factor 1. Aging Cell. https://doi.org/10.1111/acel.13443
