

The DOI matches its Crossref record; 49 of the 51 references it cites were found in a registry or an index; none of the 75 sources its claims cite is checked for support yet.
Senolytic drugs, dasatinib and quercetin, attenuate adipose tissue inflammation, and ameliorate metabolic function in old age
Open accessAbstract
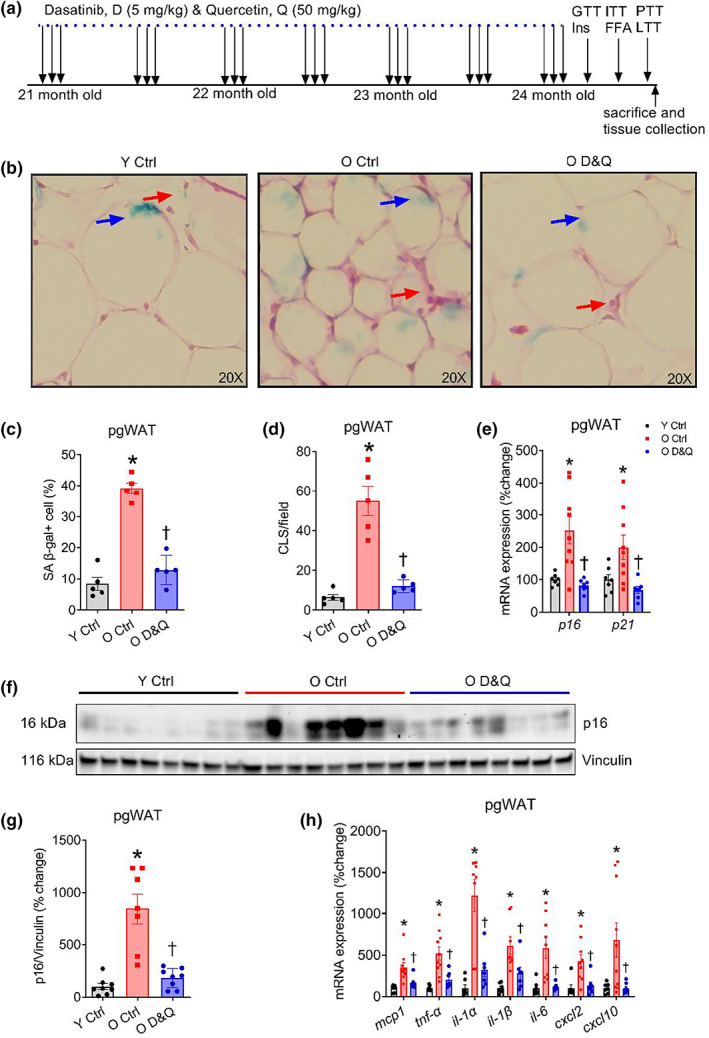
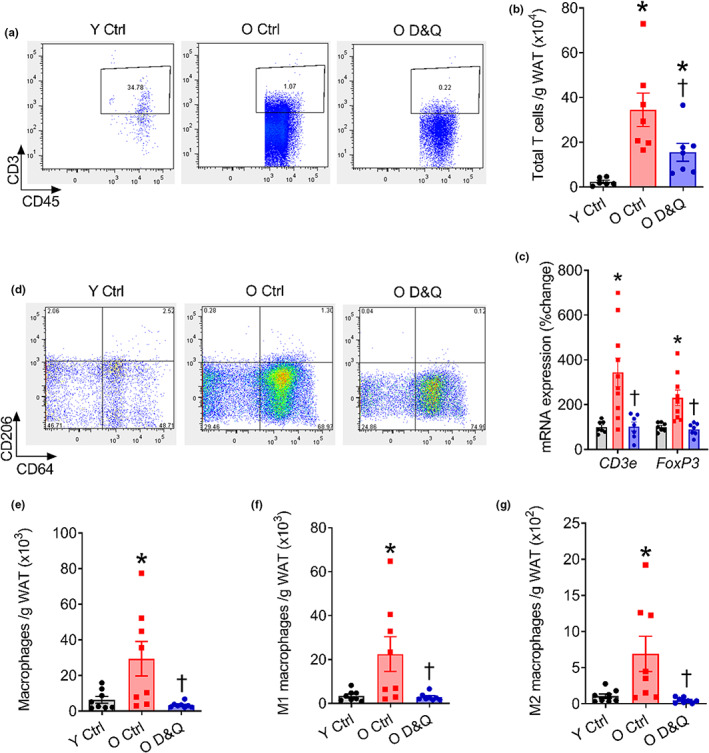
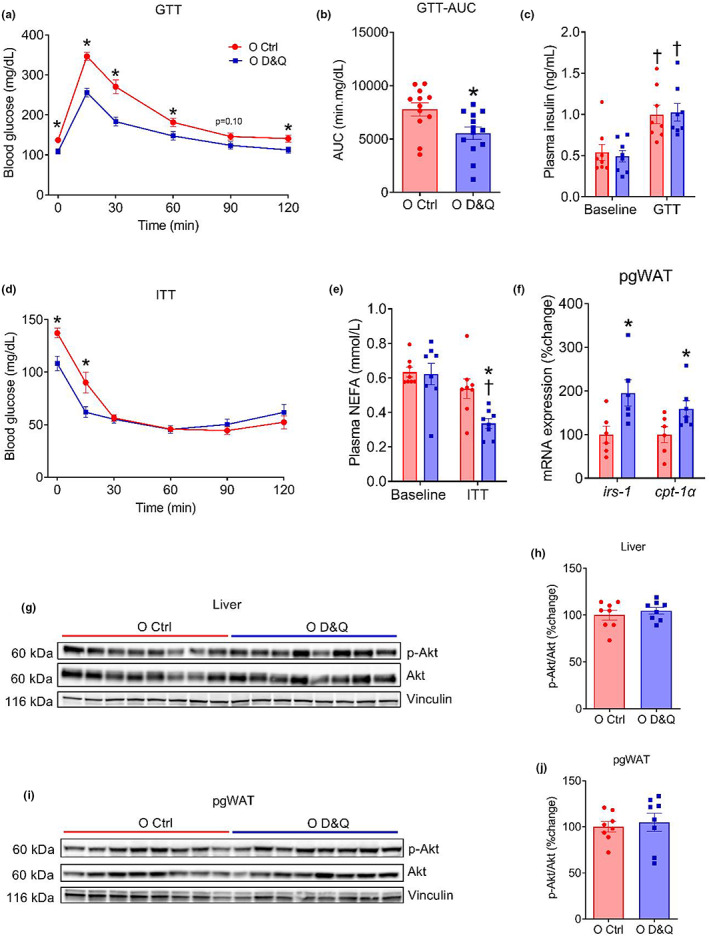
Aging results in an elevated burden of senescent cells, senescence‐associated secretory phenotype (SASP), and tissue infiltration of immune cells contributing to chronic low‐grade inflammation and a host of age‐related diseases. Recent evidence suggests that the clearance of senescent cells alleviates chronic inflammation and its associated dysfunction and diseases. However, the effect of this intervention on metabolic function in old age remains poorly understood. Here, we demonstrate that dasatinib and quercetin (D&Q) have senolytic effects, reducing age‐related increase in senescence‐associated β‐galactosidase, expression of p16 and p21 gene and P16 protein in perigonadal white adipose tissue (pgWAT; all p ≤ 0.04). This treatment also suppressed age‐related increase in the expression of a subset of pro‐inflammatory SASP genes ( mcp1, tnf‐α, il‐1α, il‐1β, il‐6, cxcl2, and cxcl10 ), crown‐like structures, abundance of T cells and macrophages in pgWAT (all p ≤ 0.04). In the liver and skeletal muscle, we did not find a robust effect of D&Q on senescence and inflammatory SASP markers. Although we did not observe an age‐related difference in glucose tolerance, D&Q treatment improved fasting blood glucose ( p = 0.001) and glucose tolerance ( p = 0.007) in old mice that was concomitant with lower hepatic gluconeogenesis. Additionally, D&Q improved insulin‐stimulated suppression of plasma NEFAs ( p = 0.01), reduced fed and fasted plasma triglycerides (both p ≤ 0.04), and improved systemic lipid tolerance ( p = 0.006). Collectively, results from this study suggest that D&Q attenuates adipose tissue inflammation and improves systemic metabolic function in old age. These findings have implications for the development of therapeutic agents to combat metabolic dysfunction and diseases in old age.
Overview
AI snapshot
Written from the paper’s full text.
TL;DR
In old male C57BL/6 mice, intermittent dasatinib plus quercetin (D&Q) reduced senescence and inflammatory markers in perigonadal white adipose tissue and improved systemic glucose and lipid metabolism. Improved glucose tolerance was linked to suppressed hepatic gluconeogenesis and was independent of pancreatic beta-cell function or peripheral insulin sensitivity.
Key findings
- In pgWAT, D&Q reduced age-related SA β-gal+ cells, crown-like structures, p16 and p21 gene expression, and P16 protein (all p ≤ 0.04), and lowered SASP genes mcp1, tnf-α, il-1α, il-1β, il-6, cxcl2, and cxcl10 (all p ≤ 0.03). It also reduced T cells and total, M1, and M2 macrophages in pgWAT (all p ≤ 0.04 or p ≤ 0.01).
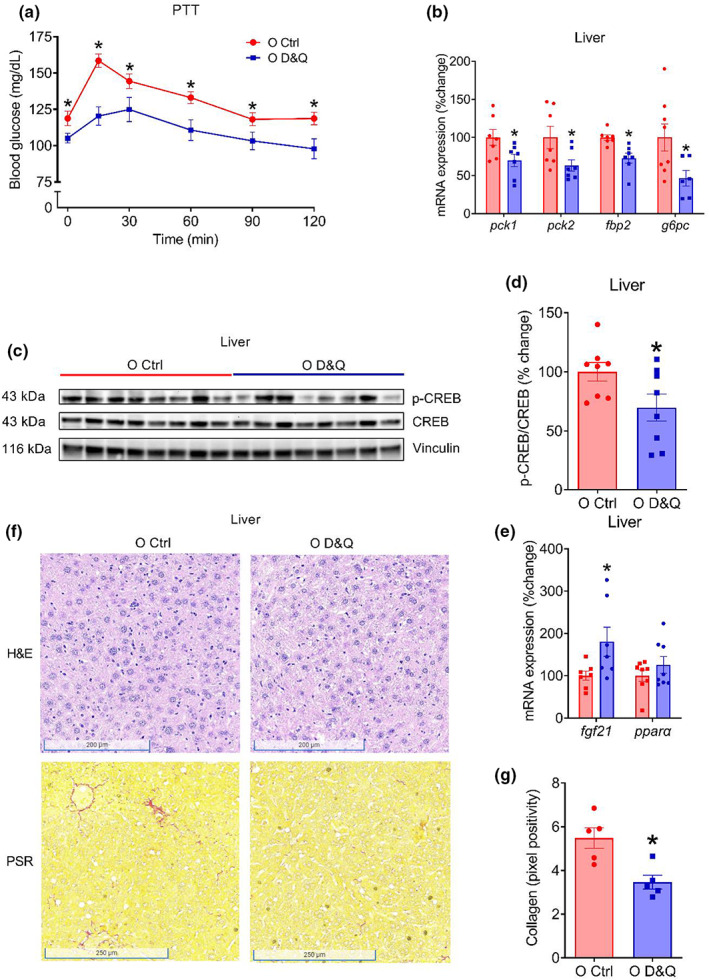
- D&Q reduced fasting blood glucose (p = 0.002) and improved glucose tolerance (interaction p ≤ 0.0001; AUC p = 0.0004) in old mice. Pyruvate tolerance improved (interaction p = 0.012; treatment p = 0.004), with lower hepatic gluconeogenic gene expression (pck1, pck2, fbp2, g6pc; all p ≤ 0.04) and lower p-CREB/CREB ratio (p = 0.047).
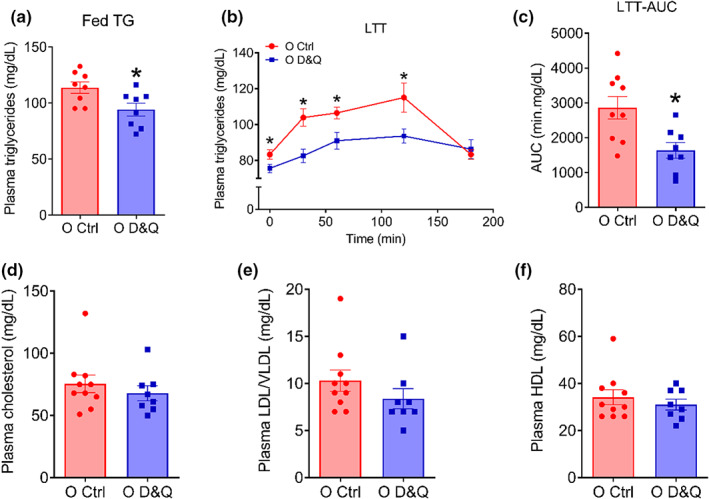
- D&Q improved insulin-stimulated suppression of plasma NEFAs (p = 0.009), reduced fed and fasted plasma triglycerides (both p ≤ 0.04), and improved lipid tolerance (interaction p = 0.014; treatment p = 0.006; AUC p = 0.006), without altering plasma cholesterol, LDL/VLDL, or HDL (p ≥ 0.62).
- Effects were tissue-specific: liver p16 gene expression was reduced (p ≤ 0.003) but P16 protein was not altered by D&Q (p = 0.83); liver mcp1 was reduced (p = 0.04) but tnf-α and il-1β were not (p ≥ 0.31); gastrocnemius senescence/inflammatory markers were unchanged (p ≥ 0.19). Liver collagen deposition was reduced by D&Q (p = 0.007).
Methods
- Male C57BL/6 mice: young controls and 21-month-old old mice received D&Q (dasatinib 5 mg/kg, quercetin 50 mg/kg) by oral gavage on 3 consecutive days every 2 weeks for 3 months, or vehicle (10% polyethylene glycol 4000). Group sizes were N = 5–8/group for many assays; Table 1 reports N = 8 young control, 15 old control, 17 old D&Q.
- Outcomes included glucose, insulin, pyruvate, and intralipid tolerance tests; glucose-stimulated insulin; insulin-stimulated NEFA suppression; plasma triglycerides and cholesterols; flow cytometry for pgWAT T cells and macrophages; qPCR and western blots for senescence, SASP, gluconeogenic, and insulin-signaling markers; and SA β-gal, H&E, and picrosirius red histology.
- Statistics used one-way or two-way ANOVA, repeated-measures ANOVA, and Student’s t tests, with significance set at p < 0.05.
Limitations
- Stated: young and old control mice did not differ in fasting glucose, glucose tolerance, pyruvate tolerance, or lipid tolerance; the C57BL/6 model may not recapitulate all human metabolic dysfunction; human aging includes diet, lifestyle, and microbiota confounders absent in mice; mouse cholesterol metabolism differs from humans; mechanisms and the relative contribution of senescence in individual tissues/cell types require further investigation.
- Evident: only male mice were studied, so sex differences are not addressed. Several assays used small group sizes (N = 5–8/group), and D&Q effects were not robust in liver or skeletal muscle, limiting conclusions about those tissues.
Model-written summary. Check it against the paper before relying on it.
Integrity signals
Registry
Cites
Statistics
Figures
Verification
Claims the paper makes
83 Own result · 44 Not checked yet · 25 Own interpretation · 2 Own method · 1 No basis given
A result the paper reports from its own data — it cites no other source for it, so there is none to check. The quote shows it is in the paper.
In the paper
“P16 protein in perigonadal white adipose tissue (pgWAT; all p ≤ 0.04)”
- Also stated in: § Advanced age and D&Q treatment demonstrated differential impacts on senescence and inflammatory markers in pgWAT, liver, and muscle · plain
“Advanced age also increased P16 protein expression and D&Q treatment reduced P16 (both p ≤ 0.001; Figure 1f,g).”
§ Senolytic drugs, dasatinib and quercetin, attenuate adipose tissue inflammation, and ameliorate metabolic function in old age > Abstract
plaindirect- Asserted: passes — The authors put it forward as true.
- Checkable: passes — It can be checked against evidence.
- Load-bearing: passes — The paper’s conclusions depend on it.
- Based: passes — The paper gives a reason why it holds.
- Also stated in: § Advanced age and D&Q treatment demonstrated differential impacts on senescence and inflammatory markers in pgWAT, liver, and muscle · plain
A result the paper reports from its own data — it cites no other source for it, so there is none to check. The quote shows it is in the paper.
In the paper
“reduced fed and fasted plasma triglycerides (both p ≤ 0.04)”
§ Senolytic drugs, dasatinib and quercetin, attenuate adipose tissue inflammation, and ameliorate metabolic function in old age > Abstract
plaindirect- Asserted: passes — The authors put it forward as true.
- Checkable: passes — It can be checked against evidence.
- Load-bearing: passes — The paper’s conclusions depend on it.
- Based: passes — The paper gives a reason why it holds.
A result the paper reports from its own data — it cites no other source for it, so there is none to check. The quote shows it is in the paper.
In the paper
“reducing age‐related increase in senescence‐associated β‐galactosidase”
- Also stated in: § Advanced age and D&Q treatment demonstrated differential impacts on senescence and inflammatory markers in pgWAT, liver, and muscle · plain
“Aging increased senescence‐associated β‐galactosidase (SA β‐gal) + cells and crown‐like structures (CLS) in pgWAT, and these were lower in pgWAT of D&Q‐treated old mice (all p ≤ 0.001; Figure 1b–d).”
§ Senolytic drugs, dasatinib and quercetin, attenuate adipose tissue inflammation, and ameliorate metabolic function in old age > Abstract
plaindirect- Asserted: passes — The authors put it forward as true.
- Checkable: passes — It can be checked against evidence.
- Load-bearing: passes — The paper’s conclusions depend on it.
- Based: passes — The paper gives a reason why it holds.
- Also stated in: § Advanced age and D&Q treatment demonstrated differential impacts on senescence and inflammatory markers in pgWAT, liver, and muscle · plain
A result the paper reports from its own data — it cites no other source for it, so there is none to check. The quote shows it is in the paper.
In the paper
“This treatment also suppressed age‐related increase in the expression of a subset of pro‐inflammatory SASP genes (mcp1, tnf‐α, il‐1α, il‐1β, il‐6, cxcl2, and cxcl10)”
- Also stated in: § Advanced age and D&Q treatment demonstrated differential impacts on senescence and inflammatory markers in pgWAT, liver, and muscle · plain
“Gene expression of a subset of inflammatory SASP markers such as mcp1, tnf‐α, il‐1α, il‐1β, il‐6, cxcl2, and cxcl10 was higher in pgWAT from old compared with young mice and D&Q treatment reduced these markers in pgWAT from old mice (all p ≤ 0.03; Figure 1h).”
§ Senolytic drugs, dasatinib and quercetin, attenuate adipose tissue inflammation, and ameliorate metabolic function in old age > Abstract
plaindirect- Asserted: passes — The authors put it forward as true.
- Checkable: passes — It can be checked against evidence.
- Load-bearing: passes — The paper’s conclusions depend on it.
- Based: passes — The paper gives a reason why it holds.
- Also stated in: § Advanced age and D&Q treatment demonstrated differential impacts on senescence and inflammatory markers in pgWAT, liver, and muscle · plain
A result the paper reports from its own data — it cites no other source for it, so there is none to check. The quote shows it is in the paper.
In the paper
“crown‐like structures”
- Also stated in: § Advanced age and D&Q treatment demonstrated differential impacts on senescence and inflammatory markers in pgWAT, liver, and muscle · plain
“Aging increased senescence‐associated β‐galactosidase (SA β‐gal) + cells and crown‐like structures (CLS) in pgWAT, and these were lower in pgWAT of D&Q‐treated old mice (all p ≤ 0.001; Figure 1b–d).”
§ Senolytic drugs, dasatinib and quercetin, attenuate adipose tissue inflammation, and ameliorate metabolic function in old age > Abstract
plaindirect- Asserted: passes — The authors put it forward as true.
- Checkable: passes — It can be checked against evidence.
- Load-bearing: passes — The paper’s conclusions depend on it.
- Based: passes — The paper gives a reason why it holds.
- Also stated in: § Advanced age and D&Q treatment demonstrated differential impacts on senescence and inflammatory markers in pgWAT, liver, and muscle · plain
A result the paper reports from its own data — it cites no other source for it, so there is none to check. The quote shows it is in the paper.
In the paper
“and glucose tolerance (p = 0.007) in old mice”
- Also stated in: § D&Q reduced fasting blood glucose and improved glucose tolerance in old mice · plain
“improved glucose tolerance in old mice (interaction, p ≤ 0.0001; treatment, p ≤ 0.0001; Figure 3a)”
§ Senolytic drugs, dasatinib and quercetin, attenuate adipose tissue inflammation, and ameliorate metabolic function in old age > Abstract
plaindirect- Asserted: passes — The authors put it forward as true.
- Checkable: passes — It can be checked against evidence.
- Load-bearing: passes — The paper’s conclusions depend on it.
- Based: passes — The paper gives a reason why it holds.
- Also stated in: § D&Q reduced fasting blood glucose and improved glucose tolerance in old mice · plain
A result the paper reports from its own data — it cites no other source for it, so there is none to check. The quote shows it is in the paper.
In the paper
“Although we did not observe an age‐related difference in glucose tolerance”
- Also stated in: § D&Q reduced fasting blood glucose and improved glucose tolerance in old mice · plain
“Although advanced age did not alter fasting blood glucose (p = 0.74) and glucose tolerance (interaction, p = 0.21; age, p = 0.18; Figure S3a)”
§ Senolytic drugs, dasatinib and quercetin, attenuate adipose tissue inflammation, and ameliorate metabolic function in old age > Abstract
plain- Asserted: passes — The authors put it forward as true.
- Checkable: passes — It can be checked against evidence.
- Load-bearing: unclear — It is unclear whether the paper’s conclusions depend on it.
- Based: passes — The paper gives a reason why it holds.
- Also stated in: § D&Q reduced fasting blood glucose and improved glucose tolerance in old mice · plain
A result the paper reports from its own data — it cites no other source for it, so there is none to check. The quote shows it is in the paper.
In the paper
“treatment with D&Q improved blood glucose response during the PTT (interaction, p = 0.012, treatment, p = 0.004; Figure 4a)”
§ Senolytic drugs, dasatinib and quercetin, attenuate adipose tissue inflammation, and ameliorate metabolic function in old age > RESULTS > Improved glucose tolerance was associated with reduced hepatic gluconeogenesis
plaindirect- Asserted: passes — The authors put it forward as true.
- Checkable: passes — It can be checked against evidence.
- Load-bearing: passes — The paper’s conclusions depend on it.
- Based: passes — The paper gives a reason why it holds.
A result the paper reports from its own data — it cites no other source for it, so there is none to check. The quote shows it is in the paper.
In the paper
“In the liver and skeletal muscle, we did not find a robust effect of D&Q on senescence and inflammatory SASP markers.”
- Also stated in: § Advanced age and D&Q treatment demonstrated differential impacts on senescence and inflammatory markers in pgWAT, liver, and muscle · plain
“Treatment with D&Q reduces age‐related increases in senescence and inflammatory burden in the adipose tissue and demonstrates no major effects in the liver and skeletal muscle.”
§ Senolytic drugs, dasatinib and quercetin, attenuate adipose tissue inflammation, and ameliorate metabolic function in old age > Abstract
plain- Asserted: passes — The authors put it forward as true.
- Checkable: passes — It can be checked against evidence.
- Load-bearing: passes — The paper’s conclusions depend on it.
- Based: passes — The paper gives a reason why it holds.
- Also stated in: § Advanced age and D&Q treatment demonstrated differential impacts on senescence and inflammatory markers in pgWAT, liver, and muscle · plain
A result the paper reports from its own data — it cites no other source for it, so there is none to check. The quote shows it is in the paper.
In the paper
“expression of p16 and p21 gene”
- Also stated in: § Advanced age and D&Q treatment demonstrated differential impacts on senescence and inflammatory markers in pgWAT, liver, and muscle · plain
“aging increased the gene expression of p16 and p21 in pgWAT, which was reduced by D&Q treatment (all p ≤ 0.04; Figure 1e).”
§ Senolytic drugs, dasatinib and quercetin, attenuate adipose tissue inflammation, and ameliorate metabolic function in old age > Abstract
plaindirect- Asserted: passes — The authors put it forward as true.
- Checkable: passes — It can be checked against evidence.
- Load-bearing: passes — The paper’s conclusions depend on it.
- Based: passes — The paper gives a reason why it holds.
- Also stated in: § Advanced age and D&Q treatment demonstrated differential impacts on senescence and inflammatory markers in pgWAT, liver, and muscle · plain
- It may state two separate claims as one. 34
- Probably not a substantial claim. 26
A result the paper reports from its own data — it cites no other source for it, so there is none to check. The quote shows it is in the paper.
In the paper
“During the GTT, we observed an expected increase in plasma insulin concentration in both old control and old D&Q‐treated mice (both p ≤ 0.01); however, no difference in plasma insulin at baseline or during GTT was observed between the groups (both p ≥ 0.69; Figure 3c).”
§ Senolytic drugs, dasatinib and quercetin, attenuate adipose tissue inflammation, and ameliorate metabolic function in old age > RESULTS > D&Q reduced fasting blood glucose and improved glucose tolerance in old mice
plain- Asserted: passes — The authors put it forward as true.
- Checkable: passes — It can be checked against evidence.
- Load-bearing: unclear — It is unclear whether the paper’s conclusions depend on it.
- Based: passes — The paper gives a reason why it holds.
It may state two separate claims as one.
A result the paper reports from its own data — it cites no other source for it, so there is none to check. The quote shows it is in the paper.
In the paper
“we found a difference in blood glucose at baseline and at 15 min during ITT (both p ≤ 0.02; Figure 3d), but no difference in later time points (all p ≥ 0.37) or overall time response curve between the groups (interaction, p˂0.0001; treatment, p = 0.19; Figure 3d).”
§ Senolytic drugs, dasatinib and quercetin, attenuate adipose tissue inflammation, and ameliorate metabolic function in old age > RESULTS > D&Q reduced fasting blood glucose and improved glucose tolerance in old mice
plain- Asserted: passes — The authors put it forward as true.
- Checkable: passes — It can be checked against evidence.
- Load-bearing: unclear — It is unclear whether the paper’s conclusions depend on it.
- Based: passes — The paper gives a reason why it holds.
It may state two separate claims as one.
A result the paper reports from its own data — it cites no other source for it, so there is none to check. The quote shows it is in the paper.
In the paper
“Kidney mass was higher in old compared with young mice (p = 0.02; Table 1) and D&Q did not alter kidney mass in old mice (p = 0.53; Table 1).”
§ Senolytic drugs, dasatinib and quercetin, attenuate adipose tissue inflammation, and ameliorate metabolic function in old age > RESULTS > Effects of advanced age and D&Q on body and tissue mass
plain- Asserted: passes — The authors put it forward as true.
- Checkable: passes — It can be checked against evidence.
- Load-bearing: fails — The paper’s conclusions may not depend on it.
- Based: passes — The paper gives a reason why it holds.
Probably not a substantial claim. The paper’s conclusions may not depend on it.
A result the paper reports from its own data — it cites no other source for it, so there is none to check. The quote shows it is in the paper.
In the paper
“Although age did not alter heart mass (p = 0.97; Table 1), D&Q increased heart mass in old mice (p = 0.05; Table 1).”
§ Senolytic drugs, dasatinib and quercetin, attenuate adipose tissue inflammation, and ameliorate metabolic function in old age > RESULTS > Effects of advanced age and D&Q on body and tissue mass
plain- Asserted: passes — The authors put it forward as true.
- Checkable: passes — It can be checked against evidence.
- Load-bearing: fails — The paper’s conclusions may not depend on it.
- Based: passes — The paper gives a reason why it holds.
Probably not a substantial claim. The paper’s conclusions may not depend on it.
A result the paper reports from its own data — it cites no other source for it, so there is none to check. The quote shows it is in the paper.
In the paper
“Although age did not alter heart mass (p = 0.97; Table 1), D&Q increased heart mass in old mice (p = 0.05; Table 1).”
§ Senolytic drugs, dasatinib and quercetin, attenuate adipose tissue inflammation, and ameliorate metabolic function in old age > RESULTS > Effects of advanced age and D&Q on body and tissue mass
plaindirect- Asserted: passes — The authors put it forward as true.
- Checkable: passes — It can be checked against evidence.
- Load-bearing: fails — The paper’s conclusions may not depend on it.
- Based: passes — The paper gives a reason why it holds.
Probably not a substantial claim. The paper’s conclusions may not depend on it.
A result the paper reports from its own data — it cites no other source for it, so there is none to check. The quote shows it is in the paper.
In the paper
“Kidney mass was higher in old compared with young mice (p = 0.02; Table 1) and D&Q did not alter kidney mass in old mice (p = 0.53; Table 1).”
§ Senolytic drugs, dasatinib and quercetin, attenuate adipose tissue inflammation, and ameliorate metabolic function in old age > RESULTS > Effects of advanced age and D&Q on body and tissue mass
plaincorrelational- Asserted: passes — The authors put it forward as true.
- Checkable: passes — It can be checked against evidence.
- Load-bearing: fails — The paper’s conclusions may not depend on it.
- Based: passes — The paper gives a reason why it holds.
Probably not a substantial claim. The paper’s conclusions may not depend on it.
A result the paper reports from its own data — it cites no other source for it, so there is none to check. The quote shows it is in the paper.
In the paper
“Despite no difference in systemic insulin sensitivity, insulin‐stimulated suppression of plasma NEFAs was better in D&Q‐treated compared with control mice.”
§ Senolytic drugs, dasatinib and quercetin, attenuate adipose tissue inflammation, and ameliorate metabolic function in old age > DISCUSSION
plaindirect- Asserted: passes — The authors put it forward as true.
- Checkable: passes — It can be checked against evidence.
- Load-bearing: unclear — It is unclear whether the paper’s conclusions depend on it.
- Based: passes — The paper gives a reason why it holds.
It may state two separate claims as one.
A result the paper reports from its own data — it cites no other source for it, so there is none to check. The quote shows it is in the paper.
In the paper
“but reduced HDL and increased LDL/VLDL (both p ≤ 0.004; Figure S4g)”
§ Senolytic drugs, dasatinib and quercetin, attenuate adipose tissue inflammation, and ameliorate metabolic function in old age > RESULTS > D&Q lowered fed and fasting plasma triglycerides and improved lipid tolerance but did not alter plasma cholesterols
plaindirect- Asserted: passes — The authors put it forward as true.
- Checkable: passes — It can be checked against evidence.
- Load-bearing: unclear — It is unclear whether the paper’s conclusions depend on it.
- Based: passes — The paper gives a reason why it holds.
It may state two separate claims as one.
A result the paper reports from its own data — it cites no other source for it, so there is none to check. The quote shows it is in the paper.
In the paper
“D&Q administration reduced fasting glucose and improved glucose tolerance in old mice.”
§ Senolytic drugs, dasatinib and quercetin, attenuate adipose tissue inflammation, and ameliorate metabolic function in old age > DISCUSSION
plaindirect- Asserted: passes — The authors put it forward as true.
- Checkable: passes — It can be checked against evidence.
- Load-bearing: passes — The paper’s conclusions depend on it.
- Based: passes — The paper gives a reason why it holds.
It may state two separate claims as one.
A result the paper reports from its own data — it cites no other source for it, so there is none to check. The quote shows it is in the paper.
In the paper
“However, blood glucose response during a pyruvate tolerance test, phosphorylation of c‐AMP‐response element‐binding protein, and gluconeogenic gene expression was lower in D&Q‐treated compared with control mice.”
§ Senolytic drugs, dasatinib and quercetin, attenuate adipose tissue inflammation, and ameliorate metabolic function in old age > DISCUSSION
plaindirect- Asserted: passes — The authors put it forward as true.
- Checkable: passes — It can be checked against evidence.
- Load-bearing: passes — The paper’s conclusions depend on it.
- Based: passes — The paper gives a reason why it holds.
It may state two separate claims as one.
A result the paper reports from its own data — it cites no other source for it, so there is none to check. The quote shows it is in the paper.
In the paper
“Plasma insulin during the glucose tolerance, blood glucose response during an insulin tolerance test, and insulin‐stimulated Akt phosphorylation did not differ between D&Q‐treated and control mice.”
§ Senolytic drugs, dasatinib and quercetin, attenuate adipose tissue inflammation, and ameliorate metabolic function in old age > DISCUSSION
plain- Asserted: passes — The authors put it forward as true.
- Checkable: passes — It can be checked against evidence.
- Load-bearing: passes — The paper’s conclusions depend on it.
- Based: passes — The paper gives a reason why it holds.
It may state two separate claims as one.
A result the paper reports from its own data — it cites no other source for it, so there is none to check. The quote shows it is in the paper.
In the paper
“Despite no difference in fasting blood glucose, glucose‐, pyruvate‐, and lipid tolerance between young and old mice, we demonstrate that the administration of D&Q improved metabolic function in old mice.”
§ Senolytic drugs, dasatinib and quercetin, attenuate adipose tissue inflammation, and ameliorate metabolic function in old age > DISCUSSION
boosteddirect- Asserted: passes — The authors put it forward as true.
- Checkable: passes — It can be checked against evidence.
- Load-bearing: passes — The paper’s conclusions depend on it.
- Based: passes — The paper gives a reason why it holds.
It may state two separate claims as one.
A result the paper reports from its own data — it cites no other source for it, so there is none to check. The quote shows it is in the paper.
In the paper
“our study demonstrates that the improvement in glucose tolerance was accompanied by suppressed hepatic gluconeogenesis and was independent of increased systemic insulin sensitivity or pancreatic beta cell function.”
§ Senolytic drugs, dasatinib and quercetin, attenuate adipose tissue inflammation, and ameliorate metabolic function in old age > DISCUSSION
boostedcorrelational- Asserted: passes — The authors put it forward as true.
- Checkable: passes — It can be checked against evidence.
- Load-bearing: passes — The paper’s conclusions depend on it.
- Based: passes — The paper gives a reason why it holds.
It may state two separate claims as one.
None of the sources cited for this claim have been checked yet.
In the paper
“Aging results in an elevated burden of senescent cells, senescence‐associated secretory phenotype (SASP), and tissue infiltration of immune cells contributing to chronic low‐grade inflammation and a host of age‐related diseases.”
- Also stated in: § INTRODUCTION · plain
“Senescent cells and the SASP result in a chronic sterile inflammation with advancing age and contribute to numerous age‐related pathologies”
§ Senolytic drugs, dasatinib and quercetin, attenuate adipose tissue inflammation, and ameliorate metabolic function in old age > Abstract
What the sources say
- Not checked yetcites Borghesan et al., 2020
- Not checked yetcites Gorgoulis et al., 2019
plaindirect- Asserted: passes — The authors put it forward as true.
- Checkable: passes — It can be checked against evidence.
- Load-bearing: passes — The paper’s conclusions depend on it.
- Based: passes — The paper gives a reason why it holds.
It may state two separate claims as one.
- Also stated in: § INTRODUCTION · plain
None of the sources cited for this claim have been checked yet.
In the paper
“Senescent cells accumulate in multiple tissues and organs with advancing age and act as a mediator of inflammation (Borghesan et al., 2020; Gorgoulis et al., 2019).”
§ Senolytic drugs, dasatinib and quercetin, attenuate adipose tissue inflammation, and ameliorate metabolic function in old age > INTRODUCTION
What the sources say
- Not checked yetcites Borghesan et al., 2020
- Not checked yetcites Gorgoulis et al., 2019
plaindirect- Asserted: passes — The authors put it forward as true.
- Checkable: passes — It can be checked against evidence.
- Load-bearing: passes — The paper’s conclusions depend on it.
- Based: passes — The paper gives a reason why it holds.
It may state two separate claims as one.
What the paper did — it cites no source for this, so there is none to check. The quote shows it is in the paper.
In the paper
“H&E‐stained slides were scanned and assessed by an examiner, typically a veterinary pathologist, blinded to the treatment condition.”
§ Senolytic drugs, dasatinib and quercetin, attenuate adipose tissue inflammation, and ameliorate metabolic function in old age > METHODS > Liver histology
plain- Asserted: passes — The authors put it forward as true.
- Checkable: passes — It can be checked against evidence.
- Load-bearing: fails — The paper’s conclusions may not depend on it.
- Based: passes — The paper gives a reason why it holds.
Probably not a substantial claim. The paper’s conclusions may not depend on it.
A conclusion the paper draws from its own results — it cites no other source for it, so there is none to check. The quote shows it is in the paper.
In the paper
“Collectively, results from this study suggest that D&Q attenuates adipose tissue inflammation and improves systemic metabolic function in old age.”
§ Senolytic drugs, dasatinib and quercetin, attenuate adipose tissue inflammation, and ameliorate metabolic function in old age > Abstract
hedgeddirect- Asserted: passes — The authors put it forward as true.
- Checkable: passes — It can be checked against evidence.
- Load-bearing: passes — The paper’s conclusions depend on it.
- Based: passes — The paper gives a reason why it holds.
It may state two separate claims as one.
What the paper did — it cites no source for this, so there is none to check. The quote shows it is in the paper.
In the paper
“SA β‐gal+ cells as a percent of all cells were quantified by an examiner blinded to the treatment group.”
§ Senolytic drugs, dasatinib and quercetin, attenuate adipose tissue inflammation, and ameliorate metabolic function in old age > METHODS > Adipose tissue histology
plain- Asserted: passes — The authors put it forward as true.
- Checkable: passes — It can be checked against evidence.
- Load-bearing: fails — The paper’s conclusions may not depend on it.
- Based: passes — The paper gives a reason why it holds.
Probably not a substantial claim. The paper’s conclusions may not depend on it.
None of the sources cited for this claim have been checked yet.
In the paper
“Senescent cells and the SASP result in a chronic sterile inflammation with advancing age and contribute to numerous age‐related pathologies (Borghesan et al., 2020; Gorgoulis et al., 2019).”
§ Senolytic drugs, dasatinib and quercetin, attenuate adipose tissue inflammation, and ameliorate metabolic function in old age > INTRODUCTION
What the sources say
- Not checked yetcites Borghesan et al., 2020
- Not checked yetcites Gorgoulis et al., 2019
plaindirect- Asserted: passes — The authors put it forward as true.
- Checkable: passes — It can be checked against evidence.
- Load-bearing: passes — The paper’s conclusions depend on it.
- Based: passes — The paper gives a reason why it holds.
It may state two separate claims as one.
In the paper
“The “fluorescence minus one” technique was used to establish gating, as described previously (Trott et al., 2018).”
§ Senolytic drugs, dasatinib and quercetin, attenuate adipose tissue inflammation, and ameliorate metabolic function in old age > METHODS > Flow cytometry
What the sources say
- Not checked yetcites Trott et al., 2018
plain- Asserted: passes — The authors put it forward as true.
- Checkable: passes — It can be checked against evidence.
- Load-bearing: fails — The paper’s conclusions may not depend on it.
- Based: passes — The paper gives a reason why it holds.
Probably not a substantial claim. The paper’s conclusions may not depend on it.
None of the sources cited for this claim have been checked yet.
In the paper
“Dasatinib and quercetin (D&Q) are two of the most studied senolytic drugs and have demonstrated promise in improving age‐related pathophysiological dysfunctions in human and mice (Hickson et al., 2019; Wissler Gerdes et al., 2020; Xu et al., 2018).”
§ Senolytic drugs, dasatinib and quercetin, attenuate adipose tissue inflammation, and ameliorate metabolic function in old age > INTRODUCTION
What the sources say
- Not checked yetcites Hickson et al., 2019
- Not checked yetcites Wissler Gerdes et al., 2020
- Not checked yetcites Xu et al., 2018
boostedconditional- Asserted: passes — The authors put it forward as true.
- Checkable: passes — It can be checked against evidence.
- Load-bearing: passes — The paper’s conclusions depend on it.
- Based: passes — The paper gives a reason why it holds.
It may state two separate claims as one.
In the paper
“genetic clearance of p16‐positive senescent cells prevents age‐related lipodystrophy (Xu, Palmer, et al., 2015).”
§ Senolytic drugs, dasatinib and quercetin, attenuate adipose tissue inflammation, and ameliorate metabolic function in old age > INTRODUCTION
What the sources say
- Not checked yetcites Xu, Palmer, et al., 2015
plaindirect- Asserted: passes — The authors put it forward as true.
- Checkable: passes — It can be checked against evidence.
- Load-bearing: passes — The paper’s conclusions depend on it.
- Based: passes — The paper gives a reason why it holds.
Probably not a substantial claim.
None of the sources cited for this claim have been checked yet.
In the paper
“Advancing age is accompanied by metabolic dysfunction such as an impairment in glucose and lipid metabolism (Chia et al., 2018; Petersen et al., 2017; Rines et al., 2016).”
§ Senolytic drugs, dasatinib and quercetin, attenuate adipose tissue inflammation, and ameliorate metabolic function in old age > INTRODUCTION
What the sources say
- Not checked yetcites Chia et al., 2018
- Not checked yetcites Petersen et al., 2017
- Not checked yetcites Rines et al., 2016
plaincorrelational- Asserted: passes — The authors put it forward as true.
- Checkable: passes — It can be checked against evidence.
- Load-bearing: passes — The paper’s conclusions depend on it.
- Based: passes — The paper gives a reason why it holds.
Probably not a substantial claim.
None of the sources cited for this claim have been checked yet.
In the paper
“Adipose tissue from both obese and old mice demonstrates elevated senescence burden and immune cell infiltration that is linked to impairments in glucose metabolism (Borghesan et al., 2020; Kalathookunnel Antony et al., 2018).”
§ Senolytic drugs, dasatinib and quercetin, attenuate adipose tissue inflammation, and ameliorate metabolic function in old age > INTRODUCTION
What the sources say
- Not checked yetcites Borghesan et al., 2020
- Not checked yetcites Kalathookunnel Antony et al., 2018
boostedcorrelational- Asserted: passes — The authors put it forward as true.
- Checkable: passes — It can be checked against evidence.
- Load-bearing: passes — The paper’s conclusions depend on it.
- Based: passes — The paper gives a reason why it holds.
It may state two separate claims as one.
A conclusion the paper draws from its own results — it cites no other source for it, so there is none to check. The quote shows it is in the paper.
In the paper
“Taken together, our findings indicate that the senolytic drug cocktail D&Q reduces fasting blood glucose and improves glucose tolerance in old age.”
§ Senolytic drugs, dasatinib and quercetin, attenuate adipose tissue inflammation, and ameliorate metabolic function in old age > RESULTS > D&Q reduced fasting blood glucose and improved glucose tolerance in old mice
hedgeddirect- Asserted: passes — The authors put it forward as true.
- Checkable: passes — It can be checked against evidence.
- Load-bearing: passes — The paper’s conclusions depend on it.
- Based: passes — The paper gives a reason why it holds.
It may state two separate claims as one.
A conclusion the paper draws from its own results — it cites no other source for it, so there is none to check. The quote shows it is in the paper.
In the paper
“Taken together, these findings suggest that D&Q treatment results in lower CREB phosphorylation, leading to attenuated transcription of gluconeogenic genes and hepatic gluconeogenesis.”
§ Senolytic drugs, dasatinib and quercetin, attenuate adipose tissue inflammation, and ameliorate metabolic function in old age > RESULTS > Improved glucose tolerance was associated with reduced hepatic gluconeogenesis
hedgeddirect- Asserted: passes — The authors put it forward as true.
- Checkable: passes — It can be checked against evidence.
- Load-bearing: passes — The paper’s conclusions depend on it.
- Based: passes — The paper gives a reason why it holds.
It may state two separate claims as one.
A conclusion the paper draws from its own results — it cites no other source for it, so there is none to check. The quote shows it is in the paper.
In the paper
“These data suggest that the D&Q treatment reduces age‐related increases in collagen deposition in the liver that may contribute to the improvement in metabolic function such as suppressed gluconeogenesis.”
§ Senolytic drugs, dasatinib and quercetin, attenuate adipose tissue inflammation, and ameliorate metabolic function in old age > RESULTS > Administration of D&Q reduced age‐related increase in collagen deposition in liver
hedgedconditional- Asserted: passes — The authors put it forward as true.
- Checkable: passes — It can be checked against evidence.
- Load-bearing: passes — The paper’s conclusions depend on it.
- Based: passes — The paper gives a reason why it holds.
It may state two separate claims as one.
A conclusion the paper draws from its own results — it cites no other source for it, so there is none to check. The quote shows it is in the paper.
In the paper
“Treatment with D&Q reduces age‐related increases in senescence and inflammatory burden in the adipose tissue and demonstrates no major effects in the liver and skeletal muscle.”
§ Senolytic drugs, dasatinib and quercetin, attenuate adipose tissue inflammation, and ameliorate metabolic function in old age > RESULTS > Advanced age and D&Q treatment demonstrated differential impacts on senescence and inflammatory markers in pgWAT, liver, and muscle
boosteddirect- Asserted: passes — The authors put it forward as true.
- Checkable: passes — It can be checked against evidence.
- Load-bearing: passes — The paper’s conclusions depend on it.
- Based: passes — The paper gives a reason why it holds.
It may state two separate claims as one.
A conclusion the paper draws from its own results — it cites no other source for it, so there is none to check. The quote shows it is in the paper.
In the paper
“Thus, our findings demonstrate that advanced age increases the numbers of T cells and macrophages in the pgWAT and treatment with D&Q reverses these age‐related increases in immune cells in the pgWAT.”
§ Senolytic drugs, dasatinib and quercetin, attenuate adipose tissue inflammation, and ameliorate metabolic function in old age > RESULTS > D&Q reduced the age‐related increase in the abundance of T lymphocyte and macrophages in pgWAT
boosteddirect- Asserted: passes — The authors put it forward as true.
- Checkable: passes — It can be checked against evidence.
- Load-bearing: passes — The paper’s conclusions depend on it.
- Based: passes — The paper gives a reason why it holds.
It may state two separate claims as one.
In the paper
“Induction of senescence in cutaneous fibroblasts in older adults resulted in infiltration of monocytes via SASP chemokine CCL2, demonstrating a direct role of senescent cells in recruiting immune cells (Chambers et al., 2021).”
§ Senolytic drugs, dasatinib and quercetin, attenuate adipose tissue inflammation, and ameliorate metabolic function in old age > DISCUSSION
What the sources say
- Not checked yetcites Chambers et al., 2021
boosteddirect- Asserted: passes — The authors put it forward as true.
- Checkable: passes — It can be checked against evidence.
- Load-bearing: fails — The paper’s conclusions may not depend on it.
- Based: passes — The paper gives a reason why it holds.
Probably not a substantial claim. The paper’s conclusions may not depend on it.
In the paper
“Shirakawa et al. (2016) report that high‐fat diet‐induced obesity, which is known to induce adipose tissue senescence, promotes adipose tissue accumulation of T cells and macrophages.”
§ Senolytic drugs, dasatinib and quercetin, attenuate adipose tissue inflammation, and ameliorate metabolic function in old age > DISCUSSION
What the sources say
- Not checked yetcites Shirakawa et al., 2016
boosteddirect- Asserted: passes — The authors put it forward as true.
- Checkable: passes — It can be checked against evidence.
- Load-bearing: fails — The paper’s conclusions may not depend on it.
- Based: passes — The paper gives a reason why it holds.
Probably not a substantial claim. The paper’s conclusions may not depend on it.
None of the sources cited for this claim have been checked yet.
In the paper
“When administered as a drug cocktail, D&Q has been demonstrated to be effective at inducing apoptosis and thus eliminating senescent cells and SASP burden in adipose tissue from both humans and mice (Hickson et al., 2019; Palmer et al., 2019; Wissler Gerdes et al., 2020).”
§ Senolytic drugs, dasatinib and quercetin, attenuate adipose tissue inflammation, and ameliorate metabolic function in old age > DISCUSSION
What the sources say
- Not checked yetcites Hickson et al., 2019
- Not checked yetcites Palmer et al., 2019
- Not checked yetcites Wissler Gerdes et al., 2020
boosteddirect- Asserted: passes — The authors put it forward as true.
- Checkable: passes — It can be checked against evidence.
- Load-bearing: passes — The paper’s conclusions depend on it.
- Based: passes — The paper gives a reason why it holds.
It may state two separate claims as one.
In the paper
“Advancing age results in elevated senescence and SASP burden across multiple organs and tissues (Yousefzadeh et al., 2020).”
§ Senolytic drugs, dasatinib and quercetin, attenuate adipose tissue inflammation, and ameliorate metabolic function in old age > DISCUSSION
What the sources say
- Not checked yetcites Yousefzadeh et al., 2020
plaindirect- Asserted: passes — The authors put it forward as true.
- Checkable: passes — It can be checked against evidence.
- Load-bearing: passes — The paper’s conclusions depend on it.
- Based: passes — The paper gives a reason why it holds.
Probably not a substantial claim.
A conclusion the paper draws from its own results — it cites no other source for it, so there is none to check. The quote shows it is in the paper.
In the paper
“Our findings support the investigation of D&Q to treat age‐related metabolic dysfunction in humans and have the potential for rapid translation.”
§ Senolytic drugs, dasatinib and quercetin, attenuate adipose tissue inflammation, and ameliorate metabolic function in old age > DISCUSSION
hedgedconditional- Asserted: passes — The authors put it forward as true.
- Checkable: fails — It may be too vague to check against evidence.
- Load-bearing: passes — The paper’s conclusions depend on it.
- Based: passes — The paper gives a reason why it holds.
Probably not a substantial claim. It may be too vague to check against evidence. It may state two separate claims as one.
None of the sources cited for this claim have been checked yet.
In the paper
“Elevated burden of cellular senescence and SASP as well as T‐cell mediated chronic sterile inflammation contributes to a host of age‐related pathologies (Chung et al., 2019; Wissler Gerdes et al., 2020).”
§ Senolytic drugs, dasatinib and quercetin, attenuate adipose tissue inflammation, and ameliorate metabolic function in old age > DISCUSSION
What the sources say
- Not checked yetcites Chung et al., 2019
- Not checked yetcites Wissler Gerdes et al., 2020
plaindirect- Asserted: passes — The authors put it forward as true.
- Checkable: passes — It can be checked against evidence.
- Load-bearing: passes — The paper’s conclusions depend on it.
- Based: passes — The paper gives a reason why it holds.
It may state two separate claims as one.
None of the sources cited for this claim have been checked yet.
In the paper
“quercetin inhibits anti‐apoptotic BCL‐xL, HIF‐1α, and other senescence‐associated anti‐apoptotic proteins and eliminates senescent endothelial cells by inducing apoptosis”
§ Senolytic drugs, dasatinib and quercetin, attenuate adipose tissue inflammation, and ameliorate metabolic function in old age > DISCUSSION
What the sources say
- Not checked yetcites Kirkland & Tchkonia, 2020
- Not checked yetcites Lindauer & Hochhaus, 2018
- Not checked yetcites Marunaka et al., 2017
plaindirect- Asserted: passes — The authors put it forward as true.
- Checkable: passes — It can be checked against evidence.
- Load-bearing: passes — The paper’s conclusions depend on it.
- Based: passes — The paper gives a reason why it holds.
It may state two separate claims as one.
A conclusion the paper draws from its own results — it cites no other source for it, so there is none to check. The quote shows it is in the paper.
In the paper
“Together, these results indicate that the improved glucose tolerance was primarily due to suppressed hepatic gluconeogenesis but was independent of improvements in pancreatic beta cell function or peripheral insulin sensitivity.”
§ Senolytic drugs, dasatinib and quercetin, attenuate adipose tissue inflammation, and ameliorate metabolic function in old age > DISCUSSION
hedgeddirect- Asserted: passes — The authors put it forward as true.
- Checkable: passes — It can be checked against evidence.
- Load-bearing: passes — The paper’s conclusions depend on it.
- Based: passes — The paper gives a reason why it holds.
It may state two separate claims as one.
None of the sources cited for this claim have been checked yet.
In the paper
“Dasatinib is a tyrosine kinase inhibitor that primarily targets senescent adipocyte progenitor cells”
§ Senolytic drugs, dasatinib and quercetin, attenuate adipose tissue inflammation, and ameliorate metabolic function in old age > DISCUSSION
What the sources say
- Not checked yetcites Kirkland & Tchkonia, 2020
- Not checked yetcites Lindauer & Hochhaus, 2018
- Not checked yetcites Marunaka et al., 2017
plaindirect- Asserted: passes — The authors put it forward as true.
- Checkable: passes — It can be checked against evidence.
- Load-bearing: passes — The paper’s conclusions depend on it.
- Based: passes — The paper gives a reason why it holds.
It may state two separate claims as one.
A conclusion the paper draws from its own results — it cites no other source for it, so there is none to check. The quote shows it is in the paper.
In the paper
“Taken together, our results are in agreement with previous reports and further demonstrate novel evidence that D&Q attenuates senescence and SASP burden in a tissue‐specific manner in old age.”
§ Senolytic drugs, dasatinib and quercetin, attenuate adipose tissue inflammation, and ameliorate metabolic function in old age > DISCUSSION
boosteddirect- Asserted: passes — The authors put it forward as true.
- Checkable: passes — It can be checked against evidence.
- Load-bearing: passes — The paper’s conclusions depend on it.
- Based: passes — The paper gives a reason why it holds.
It may state two separate claims as one.
In the paper
“cholesterol metabolism in mice is distinct from humans.”
§ Senolytic drugs, dasatinib and quercetin, attenuate adipose tissue inflammation, and ameliorate metabolic function in old age > DISCUSSION
What the sources say
- Not checked yetcites Emini Veseli et al., 2017
plain- Asserted: passes — The authors put it forward as true.
- Checkable: passes — It can be checked against evidence.
- Load-bearing: fails — The paper’s conclusions may not depend on it.
- Based: passes — The paper gives a reason why it holds.
Probably not a substantial claim. The paper’s conclusions may not depend on it.
None of the sources cited for this claim have been checked yet.
In the paper
“studies that demonstrate D&Q improved obesity‐associated glucose tolerance did not report any findings on hepatic gluconeogenesis and one study indicated that insulin sensitivity was improved (Palmer et al., 2019; Sierra‐Ramirez et al., 2020).”
§ Senolytic drugs, dasatinib and quercetin, attenuate adipose tissue inflammation, and ameliorate metabolic function in old age > DISCUSSION
What the sources say
- Not checked yetcites Palmer et al., 2019
- Not checked yetcites Sierra‐Ramirez et al., 2020
hedged- Asserted: passes — The authors put it forward as true.
- Checkable: passes — It can be checked against evidence.
- Load-bearing: passes — The paper’s conclusions depend on it.
- Based: passes — The paper gives a reason why it holds.
It may state two separate claims as one.
None of the sources cited for this claim have been checked yet.
In the paper
“Therefore, senescence and inflammation have emerged as potential targets for therapeutics aimed at treating a multitude of age‐related diseases, for example, diabetes, cardiovascular diseases, cancers, neurological disorders, and fibrotic diseases (Farr et al., 2017; Kirkland & Tchkonia, 2020; Palmer et al., 2019).”
§ Senolytic drugs, dasatinib and quercetin, attenuate adipose tissue inflammation, and ameliorate metabolic function in old age > DISCUSSION
What the sources say
- Not checked yetcites Farr et al., 2017
- Not checked yetcites Kirkland & Tchkonia, 2020
- Not checked yetcites Palmer et al., 2019
plain- Asserted: passes — The authors put it forward as true.
- Checkable: passes — It can be checked against evidence.
- Load-bearing: fails — The paper’s conclusions may not depend on it.
- Based: passes — The paper gives a reason why it holds.
Probably not a substantial claim. The paper’s conclusions may not depend on it.
In the paper
“One study examined the effects of pharmacological inhibition of activin A and found that this inhibition reduced plasma‐free fatty acids, but not triglycerides, in contrast to the effects of D&Q that we observed (Xu, Palmer, et al., 2015).”
§ Senolytic drugs, dasatinib and quercetin, attenuate adipose tissue inflammation, and ameliorate metabolic function in old age > DISCUSSION
What the sources say
- Not checked yetcites Xu, Palmer, et al., 2015
plaindirect- Asserted: passes — The authors put it forward as true.
- Checkable: passes — It can be checked against evidence.
- Load-bearing: fails — The paper’s conclusions may not depend on it.
- Based: passes — The paper gives a reason why it holds.
Probably not a substantial claim. The paper’s conclusions may not depend on it. It may state two separate claims as one.
In the paper
“genetic deletion of p16 positive cells prevented age‐related loss of adipose tissue by enhancing adipogenesis in old mice (Xu, Palmer, et al., 2015)”
§ Senolytic drugs, dasatinib and quercetin, attenuate adipose tissue inflammation, and ameliorate metabolic function in old age > DISCUSSION
What the sources say
- Not checked yetcites Xu, Palmer, et al., 2015
plaindirect- Asserted: passes — The authors put it forward as true.
- Checkable: passes — It can be checked against evidence.
- Load-bearing: fails — The paper’s conclusions may not depend on it.
- Based: passes — The paper gives a reason why it holds.
Probably not a substantial claim. The paper’s conclusions may not depend on it.
None of the sources cited for this claim have been checked yet.
In the paper
“the C57BL/6 mouse remains one of the most common models to study metabolic function in old age (Green et al., 2022; Martin‐Montalvo et al., 2013; Xu, Palmer, et al., 2015).”
§ Senolytic drugs, dasatinib and quercetin, attenuate adipose tissue inflammation, and ameliorate metabolic function in old age > DISCUSSION
What the sources say
- Not checked yetcites Green et al., 2022
- Not checked yetcites Martin‐Montalvo et al., 2013
- Not checked yetcites Xu, Palmer, et al., 2015
plain- Asserted: passes — The authors put it forward as true.
- Checkable: passes — It can be checked against evidence.
- Load-bearing: fails — The paper’s conclusions may not depend on it.
- Based: passes — The paper gives a reason why it holds.
Probably not a substantial claim. The paper’s conclusions may not depend on it.
In the paper
“Our previous work has revealed that aging results in increased infiltration of T cells in pgWAT and pharmacological depletion of T cells can improve metabolic function in old age (Trott et al., 2021).”
§ Senolytic drugs, dasatinib and quercetin, attenuate adipose tissue inflammation, and ameliorate metabolic function in old age > CONCLUSION AND FUTURE DIRECTIONS
What the sources say
- Not checked yetcites Trott et al., 2021
plaindirect- Asserted: passes — The authors put it forward as true.
- Checkable: passes — It can be checked against evidence.
- Load-bearing: unclear — It is unclear whether the paper’s conclusions depend on it.
- Based: passes — The paper gives a reason why it holds.
It may state two separate claims as one.
In the paper
“without genetic manipulation, mice do not demonstrate a robust change in plasma cholesterol with aging (Emini Veseli et al., 2017).”
§ Senolytic drugs, dasatinib and quercetin, attenuate adipose tissue inflammation, and ameliorate metabolic function in old age > DISCUSSION
What the sources say
- Not checked yetcites Emini Veseli et al., 2017
plain- Asserted: passes — The authors put it forward as true.
- Checkable: passes — It can be checked against evidence.
- Load-bearing: fails — The paper’s conclusions may not depend on it.
- Based: passes — The paper gives a reason why it holds.
Probably not a substantial claim. The paper’s conclusions may not depend on it.
In the paper
“inhibition of senescent adipocyte‐secreted product activin A using ruxolitinib improved glucose tolerance and insulin sensitivity in old mice (Xu, Palmer, et al., 2015)”
§ Senolytic drugs, dasatinib and quercetin, attenuate adipose tissue inflammation, and ameliorate metabolic function in old age > DISCUSSION
What the sources say
- Not checked yetcites Xu, Palmer, et al., 2015
plaindirect- Asserted: passes — The authors put it forward as true.
- Checkable: passes — It can be checked against evidence.
- Load-bearing: fails — The paper’s conclusions may not depend on it.
- Based: passes — The paper gives a reason why it holds.
Probably not a substantial claim. The paper’s conclusions may not depend on it.
In the paper
“Shirakawa et al. (2016), provides evidence that obesity results in the accumulation of adipose tissue senescent T cells.”
§ Senolytic drugs, dasatinib and quercetin, attenuate adipose tissue inflammation, and ameliorate metabolic function in old age > CONCLUSION AND FUTURE DIRECTIONS
What the sources say
- Not checked yetcites Shirakawa et al., 2016
plaindirect- Asserted: passes — The authors put it forward as true.
- Checkable: passes — It can be checked against evidence.
- Load-bearing: fails — The paper’s conclusions may not depend on it.
- Based: passes — The paper gives a reason why it holds.
Probably not a substantial claim. The paper’s conclusions may not depend on it.
A conclusion the paper draws from its own results — it cites no other source for it, so there is none to check. The quote shows it is in the paper.
In the paper
“Taken together, our study uncovers important insight into the effects of lowering senescence, SASP, and inflammation on systemic lipid metabolism.”
§ Senolytic drugs, dasatinib and quercetin, attenuate adipose tissue inflammation, and ameliorate metabolic function in old age > DISCUSSION
plaindirect- Asserted: passes — The authors put it forward as true.
- Checkable: passes — It can be checked against evidence.
- Load-bearing: passes — The paper’s conclusions depend on it.
- Based: passes — The paper gives a reason why it holds.
Probably not a substantial claim.
A conclusion the paper draws from its own results — it cites no other source for it, so there is none to check. The quote shows it is in the paper.
In the paper
“Our findings support these previous results and provide a more comprehensive picture of the mechanisms that underlie these improvements in metabolic function in old age after treatment with D&Q.”
§ Senolytic drugs, dasatinib and quercetin, attenuate adipose tissue inflammation, and ameliorate metabolic function in old age > DISCUSSION
plaindirect- Asserted: passes — The authors put it forward as true.
- Checkable: passes — It can be checked against evidence.
- Load-bearing: fails — The paper’s conclusions may not depend on it.
- Based: passes — The paper gives a reason why it holds.
Probably not a substantial claim. The paper’s conclusions may not depend on it. It may state two separate claims as one.
A conclusion the paper draws from its own results — it cites no other source for it, so there is none to check. The quote shows it is in the paper.
In the paper
“In summary, our study demonstrates that reduction in senescence and inflammatory SASP burden attenuates the abundance of immune cells in the pgWAT and improves metabolic function in old age.”
§ Senolytic drugs, dasatinib and quercetin, attenuate adipose tissue inflammation, and ameliorate metabolic function in old age > CONCLUSION AND FUTURE DIRECTIONS
boosteddirect- Asserted: passes — The authors put it forward as true.
- Checkable: passes — It can be checked against evidence.
- Load-bearing: passes — The paper’s conclusions depend on it.
- Based: passes — The paper gives a reason why it holds.
It may state two separate claims as one.
In the paper
“it was found that inhibition of activin A reduced hepatic triglyceride content and improved the gene expression of adipogenesis, triglyceride synthesis, and lipolysis (Xu, Palmer, et al., 2015)”
§ Senolytic drugs, dasatinib and quercetin, attenuate adipose tissue inflammation, and ameliorate metabolic function in old age > DISCUSSION
What the sources say
- Not checked yetcites Xu, Palmer, et al., 2015
plaindirect- Asserted: passes — The authors put it forward as true.
- Checkable: passes — It can be checked against evidence.
- Load-bearing: fails — The paper’s conclusions may not depend on it.
- Based: passes — The paper gives a reason why it holds.
Probably not a substantial claim. The paper’s conclusions may not depend on it. It may state two separate claims as one.
In the paper
“Beneficial effects of reducing senescent cells and inhibiting their secreted products on metabolic function in old age has been suggested by the literature.”
§ Senolytic drugs, dasatinib and quercetin, attenuate adipose tissue inflammation, and ameliorate metabolic function in old age > DISCUSSION
What the sources say
- Not checked yetcites Xu, Palmer, et al., 2015
hedgedconditional- Asserted: passes — The authors put it forward as true.
- Checkable: passes — It can be checked against evidence.
- Load-bearing: fails — The paper’s conclusions may not depend on it.
- Based: passes — The paper gives a reason why it holds.
Probably not a substantial claim. The paper’s conclusions may not depend on it.
In the paper
“while human plasma contains more LDL (considered detrimental) compared with HDL (considered beneficial), mice carry more HDL compared with LDL (Emini Veseli et al., 2017).”
§ Senolytic drugs, dasatinib and quercetin, attenuate adipose tissue inflammation, and ameliorate metabolic function in old age > DISCUSSION
What the sources say
- Not checked yetcites Emini Veseli et al., 2017
plaincorrelational- Asserted: passes — The authors put it forward as true.
- Checkable: passes — It can be checked against evidence.
- Load-bearing: fails — The paper’s conclusions may not depend on it.
- Based: passes — The paper gives a reason why it holds.
Probably not a substantial claim. The paper’s conclusions may not depend on it. It may state two separate claims as one.
The paper relies on this without support.
The effect of D&Q on metabolic function in old age remains poorly understood or unexplored.
“However, the effect of this intervention on metabolic function in old age remains poorly understood.”
“However, the effects of D&Q on metabolic function in old age remain unexplored.”
The paper relies on this without support.
The interactions between senescent cells and immune cells, and whether clearing senescent cells can attenuate the abundance of immune cells in adipose tissue, remain unknown.
“However, the interactions between senescent cells and immune cells, and particularly, if clearing senescent cells can attenuate the abundance of immune cells in the adipose tissue remains unknown.”
The paper relies on this without support.
A preclinical model that recapitulates every aspect of metabolic dysfunction observed in older humans is currently unavailable.
“However, a preclinical model that recapitulates every aspect of metabolic dysfunction that is observed in older human is currently unavailable.”
The paper relies on this without support.
The impact of D&Q on plasma cholesterol in old age has not been reported previously.
“The impact of D&Q on plasma cholesterol in old age has not been reported previously.”
Claims other papers make about this one
Each is checked against this paper’s own text: does it say what the citing paper says it does?
The cited source says what the claim attributes to it.
In the citing paper
“In several mouse experiments, the treatment alleviated inflammation342 and age-related diseases of the intestines343 and bone.344”
From Inflammation and aging: signaling pathways and intervention therapies (2023) · cites this paper as [342]
The cited source says what the claim attributes to it.
In the citing paper
“Recent publications indicate that treatments with D + Q in animal models reduce markers of inflammation associated with the pro-inflammatory SASP, including IL1β (as measured in intestinal and adipose tissue in mouse models) [110,111], which was also reduced in this trial.”
From Evaluation of exploratory fluid biomarkers from a phase 1 senolytic trial in mild Alzheimer's disease (2025) · cites this paper as [111]
Self-check
Percentages, sums and reported differences re-computed from the paper’s own numbers.
Each contradiction between two passages listed here was confirmed by an independent check.
Rated minor: it would not touch a result — a value no result rests on, a p-value that stays on the same side of the significance level, or a conflict that is clerical, resolved elsewhere in the paper, or outside its own findings.
In the paper
§ Senolytic drugs, dasatinib and quercetin, attenuate adipose tissue inflammation, and ameliorate metabolic function in old age > Abstract
“D&Q treatment improved fasting blood glucose (p = 0.001)”
§ Senolytic drugs, dasatinib and quercetin, attenuate adipose tissue inflammation, and ameliorate metabolic function in old age > RESULTS > D&Q reduced fasting blood glucose and improved glucose tolerance in old mice
“D&Q treatment reduced fasting blood glucose (p = 0.002)”
Citations
Cites
Cellular Senescence: Defining a Path Forward
Gorgoulis, V., Adams, P. D., Alimonti, A., Bennett, D. C., Bischof, O., Bishop, C., Campisi, J., Collado, M., Evangelou, K., Ferbeyre, G., et al. (2019) · Cell · doi:10.1016/j.cell.2019.10.005 · Cited by 3,225 · cited 5×
“For example, senescent cells secrete a host of inflammatory cytokines, chemokines, proteases, and tissue factors, that are collectively known as the senescence- associated secretory phenotype (SASP; Bloom et al., 2022; Borghesan et al., 2020; Gorgoulis et al., 2019).”
BackgroundInfluentialThe Achilles' heel of senescent cells: from transcriptome to senolytic drugs
Zhu, Y., Tchkonia, T., Pirtskhalava, T., Gower, A. C., Ding, H., Giorgadze, N., Palmer, A. K., Ikeno, Y., Hubbard, G. B., Lenburg, M., et al. (2015) · Aging Cell · doi:10.1111/acel.12344 · Cited by 2,584 · cited 2×
“Numerous studies have demonstrated that pharmacological agents, known as senolytics and senomorphics that respectively eliminate senescent cells and antagonize SASP, improve many age- related diseases (Borghesan et al., 2020; Xu et al., 2018; Zhu et al., 2015).”
BackgroundSenolytics improve physical function and increase lifespan in old age
Xu, M., Pirtskhalava, T., Farr, J. N., Weigand, B. M., Palmer, A. K., Weivoda, M. M., Inman, C. L., Ogrodnik, M. B., Hachfeld, C. M., Fraser, D. G., et al. (2018) · Nature Medicine · doi:10.1038/s41591-018-0092-9 · Cited by 2,287
Feuerer, M., Herrero, L., Cipolletta, D., Naaz, A., Wong, J., Nayer, A., Lee, J., Goldfine, A. B., Benoist, C., Shoelson, S., et al. (2009) · Nature Medicine · doi:10.1038/nm.2002 · Cited by 2,145
Metformin improves healthspan and lifespan in mice
Martin-Montalvo, A., Mercken, E. M., Mitchell, S. J., Palacios, H. H., Mote, P. L., Scheibye-Knudsen, M., Gomes, A. P., Ward, T. M., Minor, R. K., Blouin, M.-J., et al. (2013) · Nature Communications · doi:10.1038/ncomms3192 · Cited by 1,445
Hickson, L. J., Langhi Prata, L. G. P., Bobart, S. A., Evans, T. K., Giorgadze, N., Hashmi, S. K., Herrmann, S. M., Jensen, M. D., Jia, Q., Jordan, K. L., et al. (2019) · EBioMedicine · doi:10.1016/j.ebiom.2019.08.069 · Cited by 1,383 · cited 6×
“When administered as a drug cocktail, D&Q has been demonstrated to be effective at inducing apoptosis and thus eliminating senescent cells and SASP burden in adipose tissue from both humans and mice (Hickson et al., 2019; Palmer et al., 2019; Wissler Gerdes et al., 2020).”
BackgroundMethodInfluentialMechanisms and functions of cellular senescence
Herranz, N., & Gil, J. (2018) · Journal of Clinical Investigation · doi:10.1172/jci95148 · Cited by 1,232
Senolytic drugs: from discovery to translation
Kirkland, J. L., & Tchkonia, T. (2020) · Journal of Internal Medicine · doi:10.1111/joim.13141 · Cited by 1,227
Targeting cellular senescence prevents age-related bone loss in mice
Farr, J. N., Xu, M., Weivoda, M. M., Monroe, D. G., Fraser, D. G., Onken, J. L., Negley, B. A., Sfeir, J. G., Ogrodnik, M. B., Hachfeld, C. M., et al. (2017) · Nature Medicine · doi:10.1038/nm.4385 · Cited by 1,182
Regulation of hepatic glucose metabolism in health and disease
Petersen, M. C., Vatner, D. F., & Shulman, G. I. (2017) · Nature Reviews Endocrinology · doi:10.1038/nrendo.2017.80 · Cited by 1,155
Cited by
Sorted by citations
Inflammation and aging: signaling pathways and intervention therapies
Li, X., Li, C., Zhang, W., Wang, Y., Qian, P., & Huang, H. (2023) · Signal Transduction and Targeted Therapy · doi:10.1038/s41392-023-01502-8 · Cited by 1,443
Neuroprotective Potentials of Flavonoids: Experimental Studies and Mechanisms of Action
Bellavite, P. (2023) · Antioxidants · doi:10.3390/antiox12020280 · Cited by 233
Current and investigational medications for the treatment of sarcopenia
Rolland, Y., Dray, C., Vellas, B., & Barreto, P. D. S. (2023) · Metabolism · doi:10.1016/j.metabol.2023.155597 · Cited by 195
Immunosenescence: signaling pathways, diseases and therapeutic targets
Fu, Y., Wang, B., Alu, A., Hong, W., Hong, L., He, X., Shi, H., Cheng, P., & Yang, X. (2025) · Signal Transduction and Targeted Therapy · doi:10.1038/s41392-025-02371-z · Cited by 168
Cellular senescence in lung cancer: Molecular mechanisms and therapeutic interventions
Jha, S. K., Rubis, G. D., Devkota, S. R., Zhang, Y., Adhikari, R., Jha, L. A., Bhattacharya, K., Mehndiratta, S., Gupta, G., Singh, S. K., et al. (2024) · Ageing Research Reviews · doi:10.1016/j.arr.2024.102315 · Cited by 128
Metadata
- Authors
- Islam, M. T., Tuday, E., Allen, S., Kim, J., Trott, D. W., Holland, W. L., Donato, A. J., & Lesniewski, L. A.
- Affiliations
- University of Utah (US)
- VA Salt Lake City Healthcare System (US)
- The University of Texas at Arlington (US)
- Corresponding author
- Lesniewski, Lisa A.
- ORCID
- Venue
- Aging Cell
- Publisher
- Wiley
- Published
- 2023-01-13
- Volume
- 22
- Issue
- 2
- Pages
- e13767-e13767
- ISSN
- 1474-9718 (ISSN-L)
- 1474-9726
- PMC
- PMC9924942
- OpenAlex
- W4315928863
- Semantic Scholar
- 9694b1aab7ca7b2241690c441b27816970100487
- Cited by
- 313
- References
- 51
- Citations by year
- 2026: 94 · 2025: 128 · 2024: 68 · 2023: 23
- FWCI
- 55.58
- Type
- journal article
- Language
- en
- Open access
- gold
- doi.org
- Licence
- Locations
- Aging Cell (publishedVersion, cc-by)
- PubMed Central (publishedVersion, cc-by)
- PubMed (publishedVersion)
- Funders
- Biomedical Laboratory Research and Development, VA Office of Research and Development (BX004492)
- National Institute of Diabetes and Digestive and Kidney Diseases (T35 DK103596, DK112826, DK108833)
- National Institute on Aging (AG048366, AG050238, AG060395, K08AG070281)
- Topics
- Life Sciences › Biochemistry, Genetics and Molecular Biology › Cell Biology › Telomeres, Telomerase, and Senescence
- Health Sciences › Medicine › Physiology (medical) › Adipose Tissue and Metabolism
- Health Sciences › Medicine › Endocrinology, Diabetes and Metabolism › Adipokines, Inflammation, and Metabolic Diseases
- Keywords
- senolytics, dasatinib, quercetin, senescence-associated secretory phenotype, adipose tissue inflammation, white adipose tissue, aging, metabolic dysfunction, glucose tolerance, hepatic gluconeogenesis, triglycerides, free fatty acids, insulin sensitivity, macrophages, T cells, p16, p21, low-grade inflammation
- MeSH terms
- Dasatinib, Senotherapeutics, Adipose Tissue, Animals, Glucose, Inflammation, Quercetin, Cellular Senescence, Mice
About these checks
Registry, retraction, Cites and statistics results are computed, not judged, with one exception: a printed reference that no index lists is read once by a model before it counts as a citation error. Claims are extracted by a model and kept only when their quote appears verbatim in the text; each cited source is then checked, with a model’s help, for whether it says what the claim relies on. Those verdicts can be wrong — read the claim’s quote and the cited source before relying on one.
A language model drew the claims from the paper on 2026-10-10, under version 3 of the claim definition (model deepseek-v4.1-flash, prompt extract-v3).
A second model labelled each claim on 2026-10-10 (model jev-1.13-20260917, definition revision gold-guideline-v0.2).
Statistics and arithmetic are recomputed, not judged.
Confidence bands are shown only for fields calibrated on our annotated test set. None is calibrated yet, so no band is shown.
What counts as a claim ›How we measure confidence ›How we check this ›
Are you an author, or do you see a problem with this page? Request a review
