

The DOI matches its Crossref record; 29 of the 30 references it cites were found in a registry or an index.
Empagliflozin in posttransplantation diabetes mellitus: A prospective, interventional pilot study on glucose metabolism, fluid volume, and patient safety
Open accessAbstract
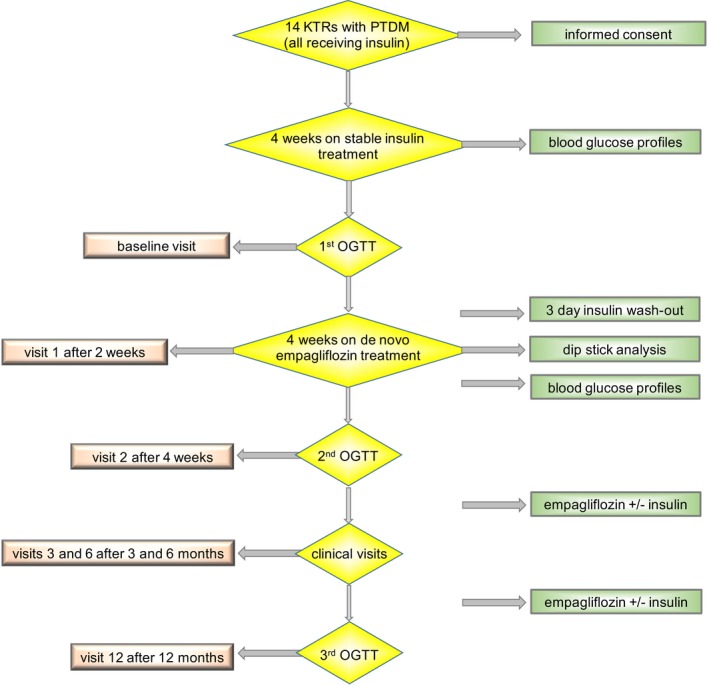
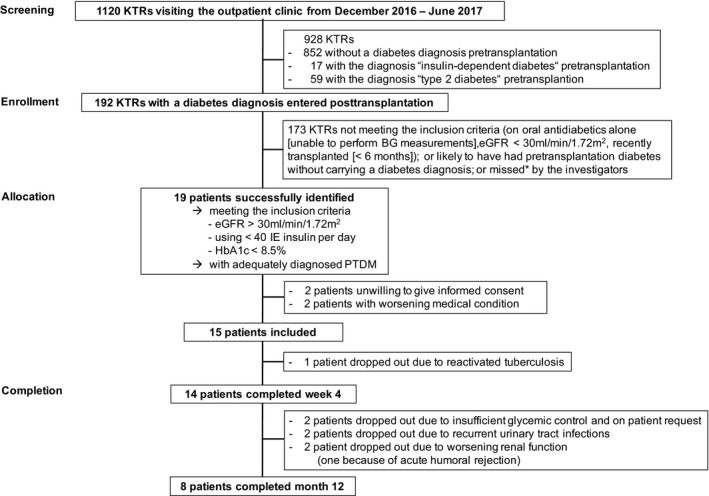
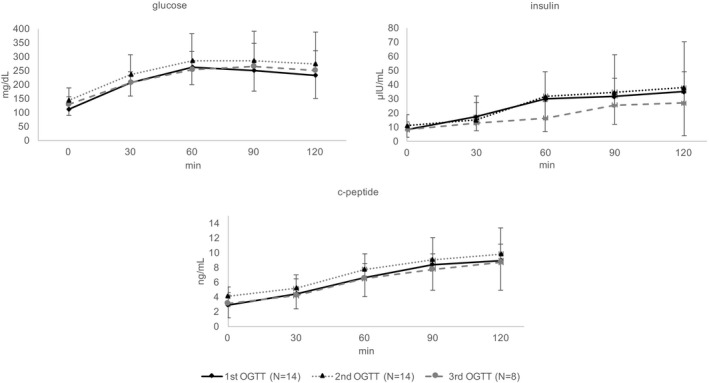
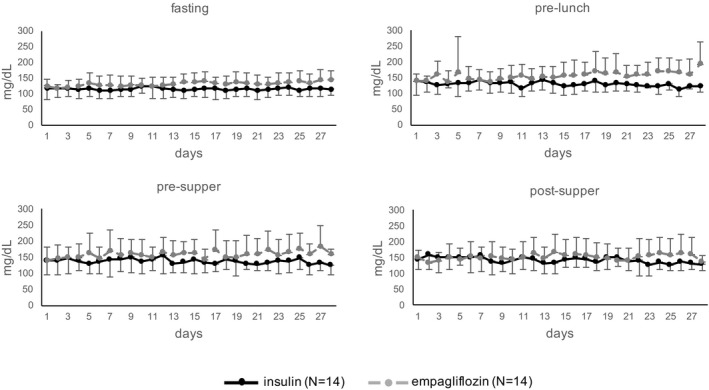
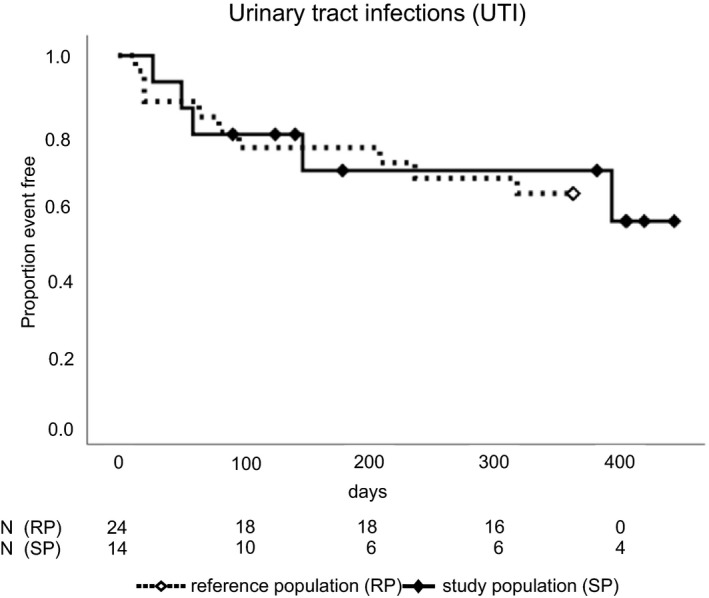
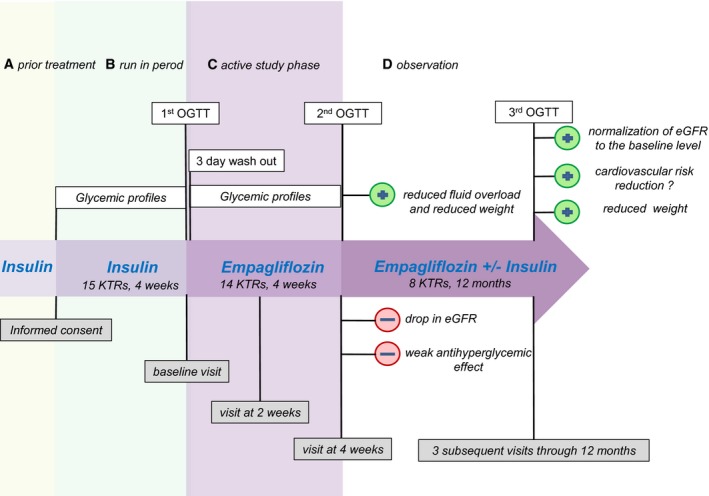
The safety and efficacy of sodium-glucose cotransporter 2 inhibitors in posttransplantation diabetes mellitus is unknown. We converted stable kidney transplant patients to 10 mg empagliflozin, aiming at replacing their insulin therapy (<40 IU/d). N = 14 participants (the required sample size) completed the study visits through 4 weeks and N = 8 through 12 months. Oral glucose tolerance test (OGTT)-derived 2-hour glucose (primary end point) increased from 232 ± 82 mg/dL (baseline) to 273 ± 116 mg/dL (4 weeks, P = .06) and to 251 ± 71 mg/dL (12 months, P = .41). Self-monitored blood glucose and hemoglobin A1c were also clinically inferior with empagliflozin monotherapy, such that insulin was reinstituted in 3 of 8 remaining participants. Five participants (2 of them dropouts) vs nine of 24 matched reference patients developed bacterial urinary tract infections (P = .81). In empagliflozin-treated participants, oral glucose insulin sensitivity decreased and beta-cell glucose sensitivity increased at the 4-week and 12-month OGTTs. Estimated glomerular filtration rate and bioimpedance spectroscopy-derived extracellular and total body fluid volumes decreased by 4 weeks, but recovered. All participants lost body weight. No participant developed ketoacidosis; 1 patient developed balanitis. In conclusion, although limited by sample size and therefore preliminary, these results suggest that empagliflozin can safely be used as add-on therapy, if posttransplant diabetes patients are monitored closely (NCT03113110).
Overview
The claims and statistics of this paper haven’t been checked yet.
Run the check — free, no account needed. It reads the open-access text and checks the sources it cites.
Integrity signals
Registry
Cites
Statistics
Figures
Verification
Claims the paper makes
The claims and statistics of this paper haven’t been checked yet.
Run the check — free, no account needed. It reads the open-access text and checks the sources it cites.
Claims other papers make about this one
Each is checked against this paper’s own text: does it say what the citing paper says it does?
The check wasn’t confident either way, so it gives no verdict — never disputed.
In the citing paper
“For T2D and posttransplant diabetes, it is reasonable to treat kidney transplant recipients with metformin according to eGFR, as for the broader population with T2D, because risks of metformin are related to kidney function (80–84).”
From Diabetes management in chronic kidney disease: a consensus report by the American Diabetes Association (ADA) and Kidney Disease: Improving Global Outcomes (KDIGO) (2022) · cites this paper as [84]
Experimental — accuracy not yet measured
Self-check
Percentages, sums and reported differences re-computed from the paper’s own numbers.
The self-check needs the paper’s full text.
Citations
Cites
Levey, A. S., Bosch, J. P., Lewis, J. B., Greene, T., Rogers, N., Roth, D., & for the Modification of Diet in Renal Disease Study Group* (1999) · Annals of Internal Medicine · doi:10.7326/0003-4819-130-6-199903160-00002 · Cited by 15,079
Empagliflozin, Cardiovascular Outcomes, and Mortality in Type 2 Diabetes
Zinman, B., Wanner, C., Lachin, J. M., Fitchett, D., Bluhmki, E., Hantel, S., Mattheus, M., Devins, T., Johansen, O. E., Woerle, H. J., et al. (2015) · New England Journal of Medicine · doi:10.1056/nejmoa1504720 · Cited by 12,315
Canagliflozin and Cardiovascular and Renal Events in Type 2 Diabetes
Neal, B., Perkovic, V., Mahaffey, K. W., de Zeeuw, D., Fulcher, G., Erondu, N., Shaw, W., Law, G., Desai, M., & Matthews, D. R. (2017) · New England Journal of Medicine · doi:10.1056/nejmoa1611925 · Cited by 7,830
Empagliflozin and Progression of Kidney Disease in Type 2 Diabetes
Wanner, C., Inzucchi, S. E., Lachin, J. M., Fitchett, D., von Eynatten, M., Mattheus, M., Johansen, O. E., Woerle, H. J., Broedl, U. C., & Zinman, B. (2016) · New England Journal of Medicine · doi:10.1056/nejmoa1515920 · Cited by 3,655
SGLT2 inhibition — a novel strategy for diabetes treatment
Chao, E. C., & Henry, R. R. (2010) · Nature Reviews Drug Discovery · doi:10.1038/nrd3180 · Cited by 834
Inzucchi, S. E., Zinman, B., Fitchett, D., Wanner, C., Ferrannini, E., Schumacher, M., Schmoor, C., Ohneberg, K., Johansen, O. E., George, J. T., et al. (2018) · Diabetes Care · doi:10.2337/dc17-1096 · Cited by 740
Rosenstock, J., & Ferrannini, E. (2015) · Diabetes Care · doi:10.2337/dc15-1380 · Cited by 664
Sharif, A., Hecking, M., de Vries, A. P. J., Porrini, E., Hornum, M., Rasoul-Rockenschaub, S., Berlakovich, G., Krebs, M., Kautzky-Willer, A., Schernthaner, G., et al. (2014) · American Journal of Transplantation · doi:10.1111/ajt.12850 · Cited by 532
Self-citationRoden, M., Weng, J., Eilbracht, J., Delafont, B., Kim, G., Woerle, H. J., & Broedl, U. C. (2013) · The Lancet Diabetes & Endocrinology · doi:10.1016/s2213-8587(13)70084-6 · Cited by 451
Canagliflozin slows progression of renal function decline independently of glycemic effects
Heerspink, H. J. L., Desai, M., Jardine, M., Balis, D., Meininger, G., & Perkovic, V. (2017) · Journal of the American Society of Nephrology · doi:10.1681/asn.2016030278 · Cited by 361
Cited by
Sorted by citations
de Boer, I. H., Khunti, K., Sadusky, T., Tuttle, K. R., Neumiller, J. J., Rhee, C. M., Rosas, S. E., Rossing, P., & Bakris, G. (2022) · Diabetes Care · doi:10.2337/dci22-0027 · Cited by 919
de Boer, I. H., Khunti, K., Sadusky, T., Tuttle, K. R., Neumiller, J. J., Rhee, C. M., Rosas, S. E., Rossing, P. R., & Bakris, G. L. (2022) · Kidney International · doi:10.1016/j.kint.2022.08.012 · Cited by 389
9. pharmacologic approaches to glycemic treatment: standards of care in diabetes—2026
American Diabetes Association Professional Practice Committee for Diabetes*, Bajaj, M., McCoy, R. G., Balapattabi, K., Bannuru, R. R., Bellini, N. J., Bennett, A. K., Beverly, E. A., Briggs Early, K., ChallaSivaKanaka, S., et al. (2026) · Diabetes Care · doi:10.2337/dc26-s009 · Cited by 263
Schork, A., Saynisch, J., Vosseler, A., Jaghutriz, B. A., Heyne, N., Peter, A., Häring, H., Stefan, N., Fritsche, A., & Artunç, F. (2019) · Cardiovascular Diabetology · doi:10.1186/s12933-019-0852-y · Cited by 241
Novel Insights into Diabetic Kidney Disease
Młynarska, E., Buławska, D., Czarnik, W., Hajdys, J., Majchrowicz, G., Prusinowski, F., Stabrawa, M., Rysz, J., & Franczyk, B. (2024) · International Journal of Molecular Sciences · doi:10.3390/ijms251810222 · Cited by 148
Metadata
- Authors
- Schwaiger, E., Burghart, L., Signorini, L., Ristl, R., Kopecky, C., Tura, A., Pacini, G., Wrba, T., Antlanger, M., Schmaldienst, S., Werzowa, J., Säemann, M. D., & Hecking, M.
- Affiliations
- Medical University of Vienna (AT)
- National Research Council (IT)
- Hanusch Hospital (AT)
- Wilhelminen Hospital (AT)
- Corresponding author
- Hecking, Manfred
- ORCID
- Venue
- American Journal of Transplantation
- Publisher
- Elsevier BV
- Published
- 2019-03
- Volume
- 19
- Issue
- 3
- Pages
- 907-919
- ISSN
- 1600-6135 (ISSN-L)
- PMC
- PMC6590167
- OpenAlex
- W2905936571
- Cited by
- 133
- References
- 30
- Citations by year
- 2026: 10 · 2025: 20 · 2024: 18 · 2023: 22 · 2022: 19 · 2021: 26 · 2020: 14 · 2019: 3
- FWCI
- 8.76
- Type
- journal article
- Language
- en
- Open access
- hybrid
- doi.org
- Licence
- Locations
- American Journal of Transplantation (publishedVersion, cc-by-nc)
- Europe PMC (PubMed Central) (publishedVersion, cc-by-nc)
- PubMed Central (publishedVersion, cc-by-nc)
- PubMed (publishedVersion)
- Topics
- Health Sciences › Medicine › Endocrinology, Diabetes and Metabolism › Diabetes Treatment and Management
- Health Sciences › Medicine › Transplantation › Renal Transplantation Outcomes and Treatments
- Health Sciences › Medicine › Endocrinology, Diabetes and Metabolism › Diabetes Management and Research
- Keywords
- empagliflozin, SGLT2 inhibitors, post-transplant diabetes mellitus, kidney transplantation, insulin therapy, glucose metabolism, urinary tract infection, body fluid volume, extracellular volume, beta-cell function, oral glucose tolerance, HbA1c, weight loss, drug safety
- MeSH terms
- Sodium-Glucose Transporter 2 Inhibitors, Benzhydryl Compounds, Blood Glucose, Body Composition, Body Fluids, Diabetes Mellitus, Type 2, Female, Follow-Up Studies, Glucosides, Graft Rejection, Graft Survival, Humans, Insulin, Male, Middle Aged, Pilot Projects, Postoperative Complications, Prognosis, Prospective Studies, Retrospective Studies, Risk Factors, Islets of Langerhans Transplantation, Patient Safety, Early Medical Intervention
About these checks
Registry, retraction, Cites and statistics results are computed, not judged, with one exception: a printed reference that no index lists is read once by a model before it counts as a citation error. Claims are extracted by a model and kept only when their quote appears verbatim in the text; each cited source is then checked, with a model’s help, for whether it says what the claim relies on. Those verdicts can be wrong — read the claim’s quote and the cited source before relying on one.
Statistics and arithmetic are recomputed, not judged.
Confidence bands are shown only for fields calibrated on our annotated test set. None is calibrated yet, so no band is shown.
What counts as a claim ›How we measure confidence ›How we check this ›
Are you an author, or do you see a problem with this page? Request a review
