Cited by 18

The DOI matches its Crossref record; 1 of the 1 references it cites were found in a registry or an index.

Cross‐reactive carbohydrate determinant‐specific IgE obscures true atopy and exhibits ⍺‐1,3‐fucose epitope‐specific inverse associations with asthma

Nkurunungi, Gyaviira, Mpairwe, Harriet, Versteeg, Serge A., van Diepen, Angela, Nassuuna, Jacent, Kabagenyi, Joyce, Nambuya, Irene, Sanya, Richard E., Nampijja, Margaret, Serna, Sonia, Reichardt, Niels‐Christian, Hokke, Cornelis H., Webb, Emily L., van Ree, Ronald, Yazdanbakhsh, Maria, Elliott, Alison M.·2021·Allergy

Abstract

Background: In high‐income, temperate countries, IgE to allergen extracts is a risk factor for, and mediator of, allergy‐related diseases (ARDs). In the tropics, positive IgE tests are also prevalent, but rarely associated with ARD. Instead, IgE responses to ubiquitous cross‐reactive carbohydrate determinants (CCDs) on plant, insect and parasite glycoproteins, rather than to established major allergens, are dominant. Because anti‐CCD IgE has limited clinical relevance, it may impact ARD phenotyping and assessment of contribution of atopy to ARD. Methods: Using an allergen extract‐based test, a glycan and an allergen (glyco)protein microarray, we mapped IgE fine specificity among Ugandan rural Schistosoma mansoni (Sm)‐endemic communities, proximate urban communities, and importantly in asthmatic and nonasthmatic schoolchildren. Results: Overall, IgE sensitization to extracts was highly prevalent (43%‐73%) but allergen arrays indicated that this was not attributable to established major allergenic components of the extracts (0%‐36%); instead, over 40% of all participants recognized CCD‐bearing components. Using glycan arrays, we dissected IgE responses to specific glycan moieties and found that reactivity to classical CCD epitopes (core β‐1,2‐xylose, α‐1,3‐fucose) was positively associated with sensitization to extracts, rural environment and Sm infection, but not with skin reactivity to extracts or sensitization to their major allergenic components. Interestingly, we discovered that reactivity to only a subset of core α‐1,3‐fucose‐carrying N‐glycans was inversely associated with asthma. Conclusions: CCD reactivity is not just an epiphenomenon of parasite exposure hampering specificity of allergy diagnostics; mechanistic studies should investigate whether specific CCD moieties identified here are implicated in the protective effect of certain environmental exposures against asthma.

Overview

The claims and statistics of this paper haven’t been checked yet.

Run the check — free, no account needed. It reads the open-access text and checks the sources it cites.

A few free checks a day · papers already verified open instantly · results are public

Integrity signals

Registry

Crossref · 10.1111/all.14469

Cites

1 of 1 references verified0 citation errors · 0 not checkable

Statistics

Figures

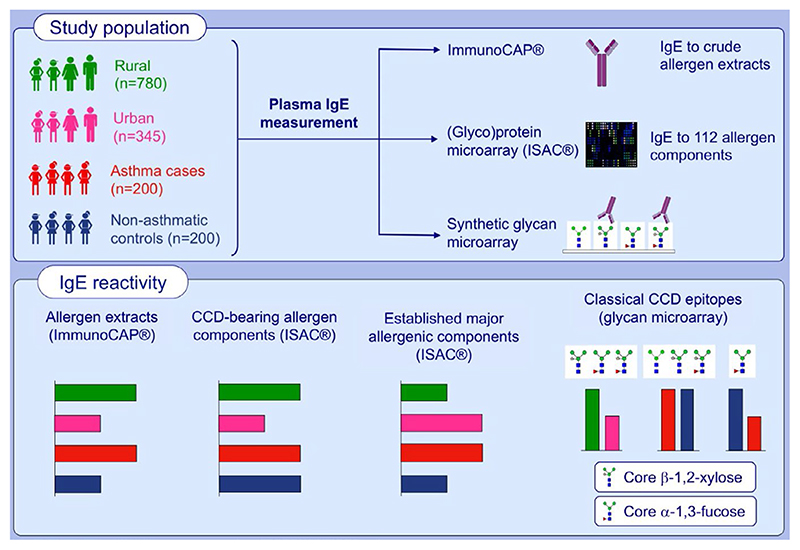
Graphical Abstract Reactivity to crude allergen extracts and classical CCD epitope (core β-1,2-xylose, α-1,3-fucose)-modified N-glycans is positively associated with the rural, Schistosoma mansoni-endemic environment. However, a higher proportion of urban, compared to rural participants, recognise recombinant established major allergenic components. There are inverse associations between reactivity to a subset of core α-1,3-fucosesubstituted N-glycans and asthma, but not for CCD-specific IgE in general.
Graphical Abstract Reactivity to crude allergen extracts and classical CCD epitope (core β-1,2-xylose, α-1,3-fucose)-modified N-glycans is positively associated with the rural, Schistosoma mansoni-endemic environment. However, a higher proportion of urban, compared to rural participants, recognise recombinant established major allergenic components. There are inverse associations between reactivity to a subset of core α-1,3-fucosesubstituted N-glycans and asthma, but not for CCD-specific IgE in general.CC BY · PubMed Central
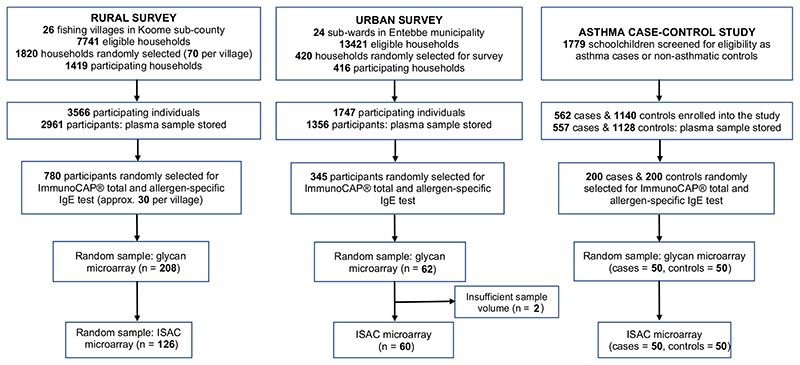
Figure 1 Selection of samples for the ImmunoCAP® test and the ISAC and glycan microarray assays
Figure 1 Selection of samples for the ImmunoCAP® test and the ISAC and glycan microarray assaysCC BY · PubMed Central
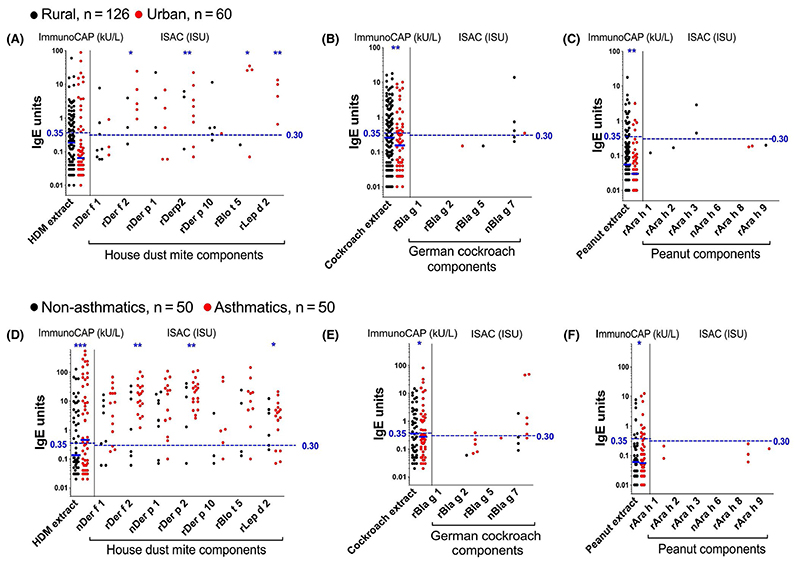
Figure 2 IgE reactivity to allergen extracts and their major allergenic components. ImmunoCAP®-determined IgE sensitization to HDM, German cockroach and peanut extracts and ISAC-determined IgE sensitization to the major allergenic components in these extracts. Natural and recombinant allergens on the ISAC array are denoted by the prefixes (n) and (r), respectively, on the allergen name. Figure shows data points from individuals with detectable IgE levels. Cut-offs of 0.35 kU/L and 0.30 ISU are shown to define the levels of ImmunoCAP® and ISAC responses, respectively, that are important for clinical diagnosis of allergic sensitization. The Mann-Whitney U test was conducted within the framework of a Monte Carlo simulation algorithm based on 1000 permutations (in order to adjust for multiple testing), to assess differences between rural and urban individuals (panels A, B and C), and between asthmatics and their controls (panels D, E and F): *P < .05; **P < .01; ***P < .001. HDM, house dust mite; ISAC, Immuno Solid-phase Allergen Chip; ISU, ISAC standardized units
Figure 2 IgE reactivity to allergen extracts and their major allergenic components. ImmunoCAP®-determined IgE sensitization to HDM, German cockroach and peanut extracts and ISAC-determined IgE sensitization to the major allergenic components in these extracts. Natural and recombinant allergens on the ISAC array are denoted by the prefixes (n) and (r), respectively, on the allergen name. Figure shows data points from individuals with detectable IgE levels. Cut-offs of 0.35 kU/L and 0.30 ISU are shown to define the levels of ImmunoCAP® and ISAC responses, respectively, that are important for clinical diagnosis of allergic sensitization. The Mann-Whitney U test was conducted within the framework of a Monte Carlo simulation algorithm based on 1000 permutations (in order to adjust for multiple testing), to assess differences between rural and urban individuals (panels A, B and C), and between asthmatics and their controls (panels D, E and F): *P < .05; **P < .01; ***P < .001. HDM, house dust mite; ISAC, Immuno Solid-phase Allergen Chip; ISU, ISAC standardized unitsCC BY · PubMed Central
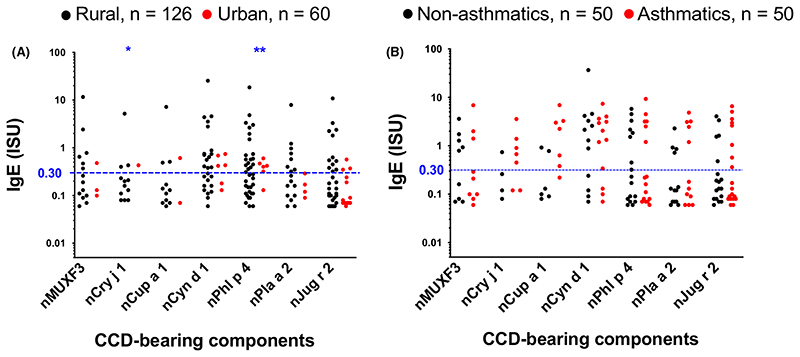
Figure 3 ISAC microarray-determined IgE reactivity to components carrying classical CCDs. Natural and recombinant allergens are denoted by the prefixes (n) and (r), respectively, on the allergen name. Figure shows data points from individuals with detectable IgE levels. Cut-offs of 0.30 ISU are shown to define the level of ISAC-determined IgE responses that is important for clinical diagnosis of allergic sensitization. The Mann-Whitney U test was conducted within the framework of a Monte Carlo simulation algorithm based on 1000 permutations (in order to adjust for multiple testing), to assess differences between rural and urban individuals, and between asthmatics and their controls: *P < .05; **P < .01; ***P < .001. ISU, ISAC standardized units; CCD, cross-reactive carbohydrate determinant
Figure 3 ISAC microarray-determined IgE reactivity to components carrying classical CCDs. Natural and recombinant allergens are denoted by the prefixes (n) and (r), respectively, on the allergen name. Figure shows data points from individuals with detectable IgE levels. Cut-offs of 0.30 ISU are shown to define the level of ISAC-determined IgE responses that is important for clinical diagnosis of allergic sensitization. The Mann-Whitney U test was conducted within the framework of a Monte Carlo simulation algorithm based on 1000 permutations (in order to adjust for multiple testing), to assess differences between rural and urban individuals, and between asthmatics and their controls: *P < .05; **P < .01; ***P < .001. ISU, ISAC standardized units; CCD, cross-reactive carbohydrate determinantCC BY · PubMed Central
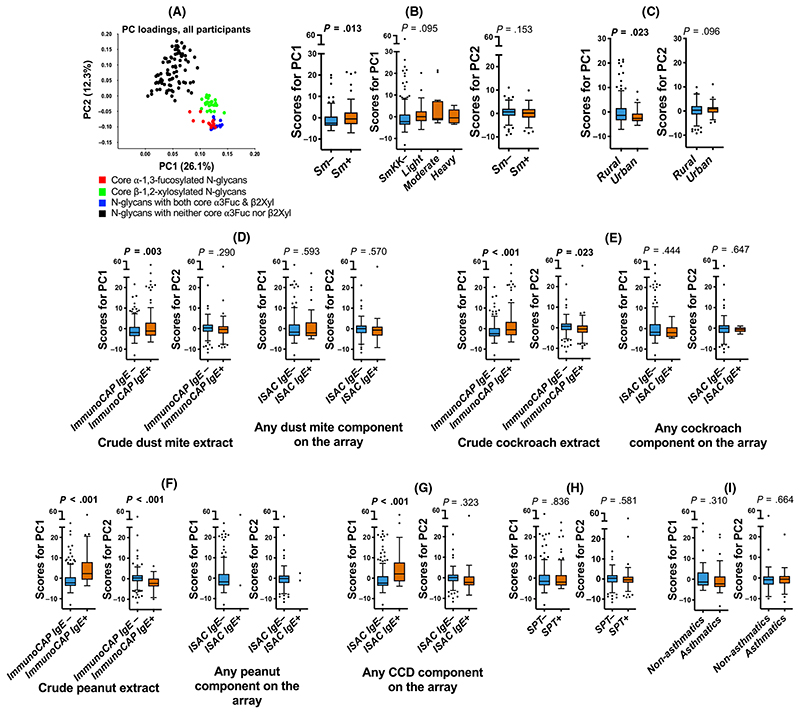
Figure 4 Associations between anti-glycan IgE responses and atopic sensitization and asthma. Figure shows data combined from all three studies. Panel (A) shows a scatterplot of first (PC1) and second factor (PC2) loadings derived from principal component analysis of IgE responses to 135 synthetic N-glycans. Box-and-whisker plots show associations between PC scores and (B) S. mansoni infection [Kato-Katz and/or PCR, infected n = 88; uninfected n = 154], (C) setting [rural n = 208; urban n = 62], (D) IgE sensitization (ImmunoCAP® IgE ≥ 0.35 kU/L) to crude D. pteronyssinus extract [sensitized n = 145; nonsensitized n = 224] and sensitization (IgE ≥ 0.3 ISU) to any of the dust mite components on the ISAC array [sensitized n = 47; nonsensitized n = 239], (E) IgE sensitization to crude German cockroach extract [sensitized n = 167; nonsensitized n = 201] and to any of the German cockroach components on the ISAC array [sensitized n = 11; nonsensitized n = 275], (F) IgE sensitization to crude peanut (A. hypogaea) extract [sensitized n = 55; nonsensitized n = 314] and to any of the peanut components on the ISAC array [sensitized n = 2; nonsensitized n = 284], (G) IgE sensitization (IgE ≥ 0.30 ISU) to any of the components bearing classical CCDs [sensitized n = 47; nonsensitized n = 239], on the ISAC array, (H) SPT reactivity to any of Dermatophagoides mix, German cockroach or Blomia tropicalis [SPT + n=125; SPT- n = 241] and (I) asthma status (asthmatic n = 50; nonasthmatic n = 50). Horizontal lines in the plots represent medians and boxes denote interquartile ranges (IQR). Whiskers were drawn using the Tukey method (1.5 times IQR). Individual points represent outliers (>1.5 times IQR away from median). Associations between PC scores and the various comparison groups were assessed using linear regression analysis in Stata 13.1. Age- and sex-adjusted P values are shown. PC1, principal component 1; PC2, principal component 2; Sm, S. mansoni infection determined by Kato-Katz and/or PCR; ISAC, Immuno Solid-phase Allergen Chip; CCD, cross-reactive carbohydrate determinant; SPT, skin prick test
Figure 4 Associations between anti-glycan IgE responses and atopic sensitization and asthma. Figure shows data combined from all three studies. Panel (A) shows a scatterplot of first (PC1) and second factor (PC2) loadings derived from principal component analysis of IgE responses to 135 synthetic N-glycans. Box-and-whisker plots show associations between PC scores and (B) S. mansoni infection [Kato-Katz and/or PCR, infected n = 88; uninfected n = 154], (C) setting [rural n = 208; urban n = 62], (D) IgE sensitization (ImmunoCAP® IgE ≥ 0.35 kU/L) to crude D. pteronyssinus extract [sensitized n = 145; nonsensitized n = 224] and sensitization (IgE ≥ 0.3 ISU) to any of the dust mite components on the ISAC array [sensitized n = 47; nonsensitized n = 239], (E) IgE sensitization to crude German cockroach extract [sensitized n = 167; nonsensitized n = 201] and to any of the German cockroach components on the ISAC array [sensitized n = 11; nonsensitized n = 275], (F) IgE sensitization to crude peanut (A. hypogaea) extract [sensitized n = 55; nonsensitized n = 314] and to any of the peanut components on the ISAC array [sensitized n = 2; nonsensitized n = 284], (G) IgE sensitization (IgE ≥ 0.30 ISU) to any of the components bearing classical CCDs [sensitized n = 47; nonsensitized n = 239], on the ISAC array, (H) SPT reactivity to any of Dermatophagoides mix, German cockroach or Blomia tropicalis [SPT + n=125; SPT- n = 241] and (I) asthma status (asthmatic n = 50; nonasthmatic n = 50). Horizontal lines in the plots represent medians and boxes denote interquartile ranges (IQR). Whiskers were drawn using the Tukey method (1.5 times IQR). Individual points represent outliers (>1.5 times IQR away from median). Associations between PC scores and the various comparison groups were assessed using linear regression analysis in Stata 13.1. Age- and sex-adjusted P values are shown. PC1, principal component 1; PC2, principal component 2; Sm, S. mansoni infection determined by Kato-Katz and/or PCR; ISAC, Immuno Solid-phase Allergen Chip; CCD, cross-reactive carbohydrate determinant; SPT, skin prick testCC BY · PubMed Central
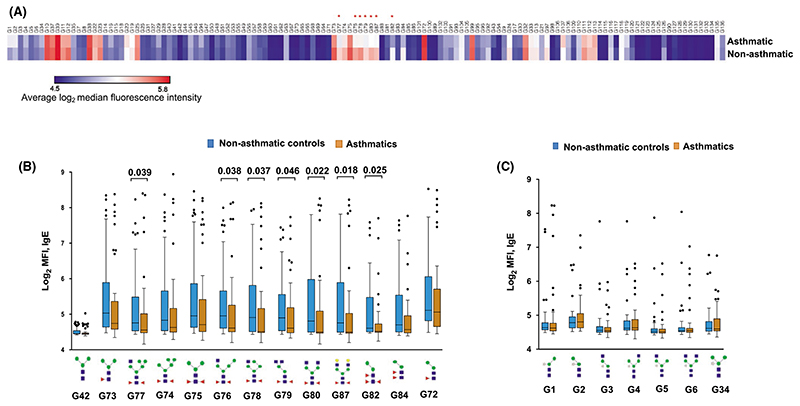
Figure 5 Associations between asthma and IgE reactivity to glycans. (A) Heatmap of average log2-transformed MFIs representing IgE reactivity to each individual glycan structure on the array, in asthmatic (n = 50) versus nonasthmatic schoolchildren (n = 50). *P < .05. (B) Box-and-whisker plots showing MFIs representing IgE reactivity to core α-1,3-fucosylated N-glycan structures. (C) Box-and-whisker plots showing MFIs representing IgE reactivity to core β-1,2-xylosylated N-glycan structures. Horizontal lines in the plots represent medians, and boxes denote interquartile ranges (IQR). Whiskers were drawn using the Tukey method (1.5 times IQR). Individual points represent outliers (> 1.5 times IQR away from median). The Mann-Whitney U test was conducted within the framework of a Monte Carlo simulation algorithm based on 1000 permutations (in order to adjust for multiple testing), to assess differences between asthmatic and nonasthmatic schoolchildren
Figure 5 Associations between asthma and IgE reactivity to glycans. (A) Heatmap of average log2-transformed MFIs representing IgE reactivity to each individual glycan structure on the array, in asthmatic (n = 50) versus nonasthmatic schoolchildren (n = 50). *P < .05. (B) Box-and-whisker plots showing MFIs representing IgE reactivity to core α-1,3-fucosylated N-glycan structures. (C) Box-and-whisker plots showing MFIs representing IgE reactivity to core β-1,2-xylosylated N-glycan structures. Horizontal lines in the plots represent medians, and boxes denote interquartile ranges (IQR). Whiskers were drawn using the Tukey method (1.5 times IQR). Individual points represent outliers (> 1.5 times IQR away from median). The Mann-Whitney U test was conducted within the framework of a Monte Carlo simulation algorithm based on 1000 permutations (in order to adjust for multiple testing), to assess differences between asthmatic and nonasthmatic schoolchildrenCC BY · PubMed Central

Verification

Claims the paper makes

The claims and statistics of this paper haven’t been checked yet.

Run the check — free, no account needed. It reads the open-access text and checks the sources it cites.

A few free checks a day · papers already verified open instantly · results are public

Claims other papers make about this one

Each is checked against this paper’s own text: does it say what the citing paper says it does?

Self-check

Percentages, sums and reported differences re-computed from the paper’s own numbers.

The self-check needs the paper’s full text.

Citations

Cites

Show all 1 references

Research works printed but not linked: 69

  1. 10.1016/j.jaci.2012.03.040 · DOI
  2. 10.1002/ppul.20816 · DOI
  3. 10.1111/j.1399-3038.2011.01227.x · DOI
  4. 10.1016/j.jaci.2017.04.040 · DOI
  5. 10.1371/journal.pcbi.1004546 · DOI · Paper page
  6. 10.1016/j.jaci.2010.11.007 · DOI
  7. 10.1371/journal.pntd.0001510 · DOI
  8. 10.1371/journal.pntd.0003124 · DOI
  9. 10.1126/science.296.5567.490 · DOI
  10. 10.1007/s11882-014-0492-y · DOI
  11. 10.1093/glycob/7.5.663 · DOI
  12. 10.1016/S0014-5793(99)01508-2 · DOI
  13. 10.1021/acs.analchem.7b03898 · DOI
  14. 10.1074/jbc.271.48.30561 · DOI
  15. 10.1016/S0166-6851(98)00020-6 · DOI
  16. 10.1016/j.molbiopara.2016.12.001 · DOI
  17. 10.1016/j.jaci.2017.04.019 · DOI
  18. 10.1016/j.ijpara.2015.10.004 · DOI
  19. 10.1038/icb.2008.58 · DOI
  20. 10.1038/nchembio.1403 · DOI
  21. 10.1093/glycob/cwg024 · DOI
  22. 10.1002/eji.200323717 · DOI · Paper page
  23. 10.1093/glycob/cwu029 · DOI
  24. 10.1021/pr900515y · DOI
  25. 10.1128/JVI.06201-11 · DOI
  26. 10.1371/journal.pntd.0001922 · DOI
  27. 10.1159/000024217 · DOI
  28. 10.1111/j.1398-9995.2008.01703.x · DOI
  29. 10.1074/jbc.275.15.11451 · DOI
  30. 10.1046/j.1365-2222.2002.01516.x · DOI
  31. 10.1046/j.1432-1033.2003.03503.x · DOI
  32. 10.1007/s11882-012-0315-y · DOI
  33. 10.1016/S0091-6749(97)70245-8 · DOI
  34. 10.1016/j.jaci.2013.04.023 · DOI
  35. Sanya RE, 2018, The Impact of Intensive Versus Standard Anthelminthic Treatment on Allergy‐related Outcomes, Helminth Infection Intensity, and Helminth‐related Morbidity in Lake Victoria Fishing Communities, Uganda: Results From the LaVIISWA Cluster‐randomized Trial, Clin Infect Dis, ciy761
  36. 10.1111/cea.13335 · DOI
  37. 10.7554/eLife.49496 · DOI
  38. 10.1186/s13063-015-0702-5 · DOI
  39. 10.1111/all.12867 · DOI
  40. Ellwood P, 2000, ISAAC Phase Three Manual
  41. 10.12688/wellcomeopenres.15460.1 · DOI
  42. 10.1016/j.trstmh.2008.01.017 · DOI
  43. Katz N, 1972, A simple device for quantitative stool thick‐smear technique in Schistosomiasis mansoni, Rev Inst Med Trop Sao Paulo, 14, 397
  44. 10.4269/ajtmh.2007.77.685 · DOI
  45. 10.1016/j.trstmh.2008.12.001 · DOI
  46. Hage M, Performance evaluation of ImmunoCAP® ISAC 112: a multi‐site study, Clin Chem Lab Med, 552017, 571
  47. 10.1016/j.anai.2016.11.022 · DOI
  48. 10.1111/all.12229 · DOI
  49. 10.1016/j.alit.2014.08.004 · DOI
  50. 10.4168/aair.2012.4.5.264 · DOI
  51. 10.1021/acschembio.8b00431 · DOI
  52. 10.1021/cb501023u · DOI
  53. 10.1016/j.jaci.2017.09.040 · DOI
  54. 10.1016/j.ijpara.2015.02.008 · DOI
  55. 10.1371/journal.pntd.0005339 · DOI
  56. 10.1111/pim.12506 · DOI
  57. 10.1371/journal.pone.0089212 · DOI
  58. 10.1007/s00436-010-1817-y · DOI
  59. 10.1016/j.jaci.2012.04.027 · DOI
  60. 10.1016/S0166-6851(01)00374-7 · DOI
  61. 10.1016/j.jaci.2007.08.066 · DOI
  62. 10.1164/rccm.200607-994OC · DOI
  63. 10.1038/s41598-019-40009-7 · DOI · Paper page
  64. 10.1111/j.1398-9995.2009.02040.x · DOI · Paper page
  65. Hamid F, 2015, Helminth‐induced IgE and protection against allergic disorders, Curr Top Microbiol Immunol, 388, 91
  66. 10.1111/imm.12711 · DOI · Paper page
  67. 10.1016/j.ijpara.2017.12.005 · DOI · Paper page
  68. 10.1038/srep45910 · DOI
  69. 10.1034/j.1399-3003.1999.14d37.x · DOI

Cited by

Sorted by citations

See all 18

Metadata

Authors
Nkurunungi, G., Mpairwe, H., Versteeg, S. A., van Diepen, A., Nassuuna, J., Kabagenyi, J., Nambuya, I., Sanya, R. E., Nampijja, M., Serna, S., Reichardt, N., Hokke, C. H., Webb, E. L., van Ree, R., Yazdanbakhsh, M., & Elliott, A. M.
Venue
Allergy
Publisher
Wiley
Published
2020-07-08
Volume
76
Issue
1
Pages
233-246
ISSN
  • 0105-4538
  • 1398-9995
Cited by
18
References
1
Language
en
Funders
European Academy of Allergy and Clinical Immunology (Short‐term research fellowship)

About these checks

Registry, retraction, Cites and statistics results are computed, not judged, with one exception: a printed reference that no index lists is read once by a model before it counts as a citation error. Claims are extracted by a model and kept only when their quote appears verbatim in the text; each cited source is then checked, with a model’s help, for whether it says what the claim relies on. Those verdicts can be wrong — read the claim’s quote and the cited source before relying on one.

Statistics and arithmetic are recomputed, not judged.

Confidence bands are shown only for fields calibrated on our annotated test set. None is calibrated yet, so no band is shown.

What counts as a claim ›How we measure confidence ›How we check this ›

Are you an author, or do you see a problem with this page? Request a review

How to cite

Cite CoChat for the checks on this page, and the paper for its own findings.

This page
CoChat. (2026). Citation check: Cross‐reactive carbohydrate determinant‐specific IgE obscures true atopy and exhibits ⍺‐1,3‐fucose epitope‐specific inverse associations with asthma. https://app.cochat.ai/papers/10.1111/all.14469
The paper
Nkurunungi, G., Mpairwe, H., Versteeg, S. A., van Diepen, A., Nassuuna, J., Kabagenyi, J., Nambuya, I., Sanya, R. E., Nampijja, M., Serna, S., Reichardt, N., Hokke, C. H., Webb, E. L., van Ree, R., Yazdanbakhsh, M., & Elliott, A. M. (2021). Cross‐reactive carbohydrate determinant‐specific IgE obscures true atopy and exhibits ⍺‐1,3‐fucose epitope‐specific inverse associations with asthma. Allergy. https://doi.org/10.1111/all.14469