

The DOI matches its Crossref record; 78 of the 78 references it cites were found in a registry or an index.
Beyond the snapshot: Landscape genetic analysis of time series data reveal responses of American black bears to landscape change
Abstract
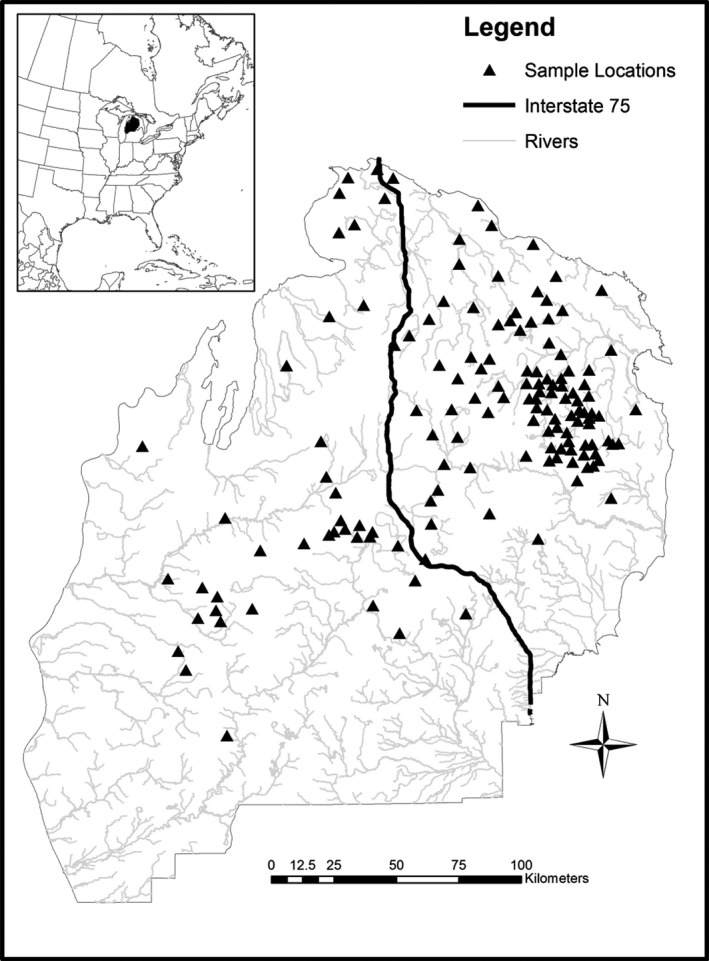
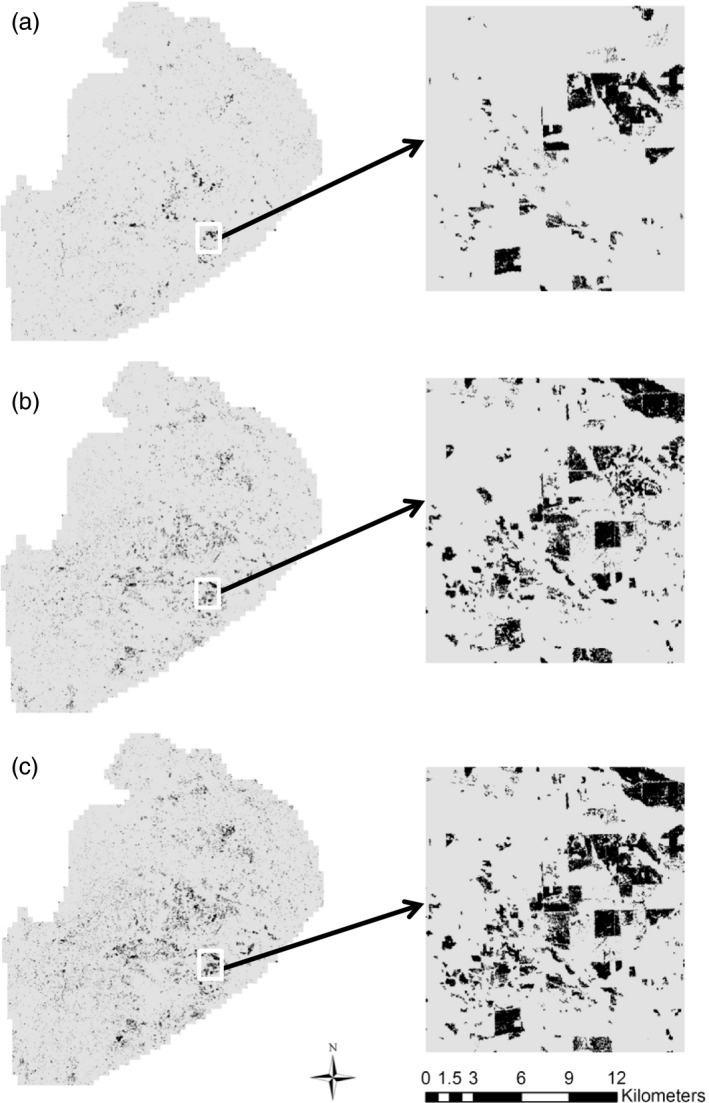
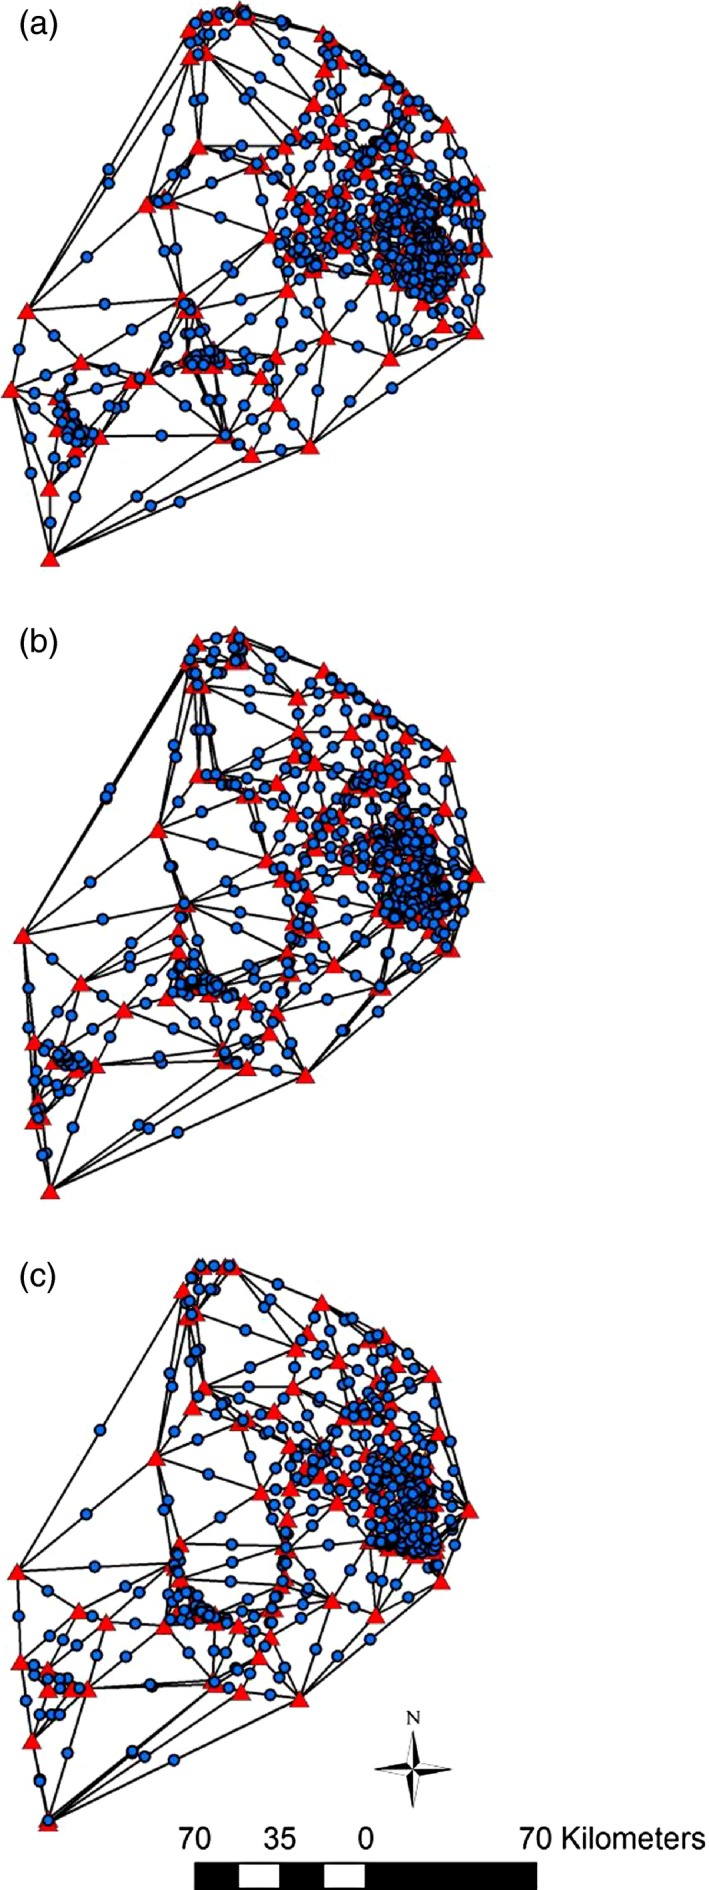
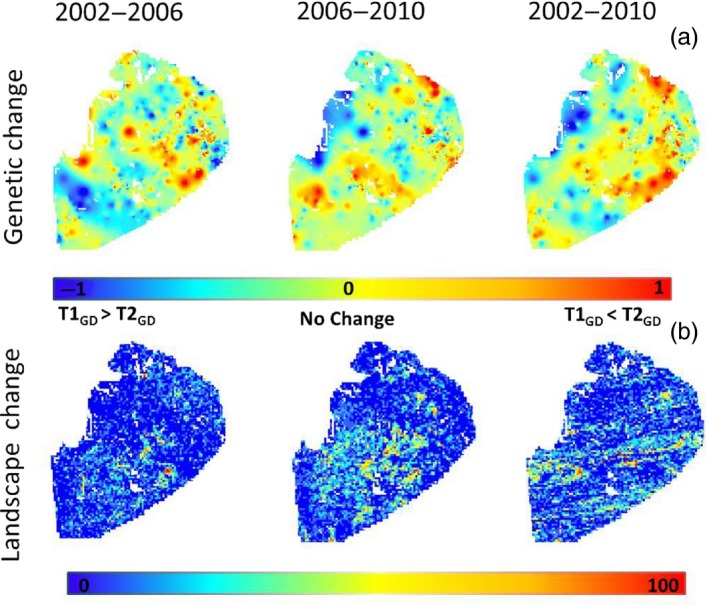
Landscape genetic studies typically focus on the evolutionary processes that give rise to spatial patterns that are quantified at a single point in time. Although landscape change is widely recognized as a strong driver of microevolutionary processes, few landscape genetic studies have directly evaluated the change in spatial genetic structure (SGS) over time with concurrent changes in landscape pattern. We introduce a novel approach to analyze landscape genetic data through time. We demonstrate this approach using genotyped samples (n = 569) from a large black bear (Ursus americanus) population in Michigan (USA) that were harvested during 3 years (2002, 2006, and 2010). We identified areas that were consistently occupied over this 9‐year period and quantified temporal variation in SGS. Then, we evaluated alternative hypotheses about effects of changes in landscape features (e.g., deforestation or crop conversion) on fine‐scale SGS among years using spatial autoregressive modeling and model selection. Relative measures of landscape change such as magnitude of landscape change (i.e., number of patches changing from suitable to unsuitable states or vice versa), and during later periods, measures of fragmentation (i.e., patch aggregation and cohesion) were associated with change in SGS. Our results stress the importance of conducting time series studies for the conservation and management of wildlife inhabiting rapidly changing landscapes.
Overview
The claims and statistics of this paper haven’t been checked yet.
Run the check — free, no account needed. It reads the open-access text and checks the sources it cites.
Integrity signals
Registry
Cites
Statistics
Figures
Verification
Claims the paper makes
The claims and statistics of this paper haven’t been checked yet.
Run the check — free, no account needed. It reads the open-access text and checks the sources it cites.
Claims other papers make about this one
Each is checked against this paper’s own text: does it say what the citing paper says it does?
The cited source says what the claim attributes to it.
In the citing paper
“Moving the field of connectivity science toward dynamic assessments has been identified as an important research priority, a goal that motivated this Special Issue [27][28][29][30].”
From Circuitscape in julia: empowering dynamic approaches to connectivity assessment (2021) · cites this paper as [28]
Self-check
Percentages, sums and reported differences re-computed from the paper’s own numbers.
The self-check needs the paper’s full text.
Citations
Cites
R: A Language and Environment for Statistical Computing
R Core Team (2025) · doi:10.32614/r.manuals · Cited by 352,181
Model selection and multimodel inference: a practical information-theoretic approach.
Guthery, F. S., Burnham, K. P., & Anderson, D. R. (2003) · The Journal of Wildlife Management · doi:10.2307/3802723 · Cited by 41,495
genalex 6: genetic analysis in Excel. Population genetic software for teaching and research
PEAKALL, R., & SMOUSE, P. E. (2006) · Molecular Ecology Notes · doi:10.1111/j.1471-8286.2005.01155.x · Cited by 16,589
GENEPOP (Version 1.2): Population Genetics Software for Exact Tests and Ecumenicism
Raymond, M., & Rousset, F. (1995) · Journal of Heredity · doi:10.1093/oxfordjournals.jhered.a111573 · Cited by 15,397
ANALYZING TABLES OF STATISTICAL TESTS
Rice, W. R. (1989) · Evolution · doi:10.1111/j.1558-5646.1989.tb04220.x · Cited by 14,547
Peakall, R., & Smouse, P. E. (2012) · Bioinformatics · doi:10.1093/bioinformatics/bts460 · Cited by 13,131
Dalapicolla, J., do Prado, J. R., Percequillo, A. R., & Knowles, L. L. (2021) · Journal of Biogeography · doi:10.1111/jbi.14281 · Cited by 11,461
micro ‐ checker : software for identifying and correcting genotyping errors in microsatellite data
VAN OOSTERHOUT, C., HUTCHINSON, W. F., WILLS, D. P. M., & SHIPLEY, P. (2004) · Molecular Ecology Notes · doi:10.1111/j.1471-8286.2004.00684.x · Cited by 10,327
FSTAT (Version 1.2): A Computer Program to Calculate F-Statistics
Goudet, J. (1995) · Journal of Heredity · doi:10.1093/oxfordjournals.jhered.a111627 · Cited by 7,635
Sources, Sinks, and Population Regulation
Pulliam, H. R. (1988) · The American Naturalist · doi:10.1086/284880 · Cited by 5,367
Research works printed but not linked: 2
- Draheim H. M.(2015).Landscape genetics of black bears (Ursus americanus) in the Northern Lower Peninsula (NLP) of Michigan USA. Dissertation Department of Zoology Michigan State University East Lansing MI.
- Mantel N., 1967, Detection of disease clustering and a generalized regression approach, Cancer Research, 27, 209
Cited by
Conservation and the Genomics of Populations
Allendorf, F. W., Funk, W. C., Aitken, S. N., Byrne, M., Luikart, G., & Antunes, A. (2022) · doi:10.1093/oso/9780198856566.001.0001 · Cited by 207
Circuitscape in julia: empowering dynamic approaches to connectivity assessment
Hall, K. R., Anantharaman, R., Landau, V. A., Clark, M., Dickson, B. G., Jones, A., Platt, J., Edelman, A., & Shah, V. B. (2021) · Land · doi:10.3390/land10030301 · Cited by 115
Metadata
- Authors
- Draheim, H. M., Moore, J. A., Fortin, M., & Scribner, K. T.
- Affiliations
- Department of Zoology Michigan State University East Lansing MI USA
- Biology Department Grand Valley State University Allendale MI USA
- Department of Ecology & Evolutionary Biology University of Toronto Toronto ON Canada
- Department of Fisheries and Wildlife Michigan State University East Lansing MI USA
- ORCID
- Draheim, Hope M.
- Venue
- Evolutionary Applications
- Publisher
- Wiley
- Published
- 2018-03-25
- Volume
- 11
- Issue
- 8
- Pages
- 1219-1230
- ISSN
- 1752-4571
- PMC
- PMC6100183
- Cited by
- 29
- References
- 78
- Language
- en
- Funders
- Michigan Department of Natural Resources (F11AF00640)
- Michigan State University
About these checks
Registry, retraction, Cites and statistics results are computed, not judged, with one exception: a printed reference that no index lists is read once by a model before it counts as a citation error. Claims are extracted by a model and kept only when their quote appears verbatim in the text; each cited source is then checked, with a model’s help, for whether it says what the claim relies on. Those verdicts can be wrong — read the claim’s quote and the cited source before relying on one.
Statistics and arithmetic are recomputed, not judged.
Confidence bands are shown only for fields calibrated on our annotated test set. None is calibrated yet, so no band is shown.
What counts as a claim ›How we measure confidence ›How we check this ›
Are you an author, or do you see a problem with this page? Request a review
Data sources
Bibliographic data: Semantic Scholar, OpenAlex, Crossref.
Contains information from the Semantic Scholar Academic Graph Datasets, made available under the ODC Attribution License (ODC-BY 1.0).
Semantic Scholar’s data is described in: Kinney, R., et al. (2023). The Semantic Scholar Open Data Platform. arXiv:2301.10140.
