

The DOI matches its Crossref record; 168 of the 168 references it cites were found in a registry or an index.
Early Archean origin of Photosystem II
Open accessPublished version of a preprint
Abstract
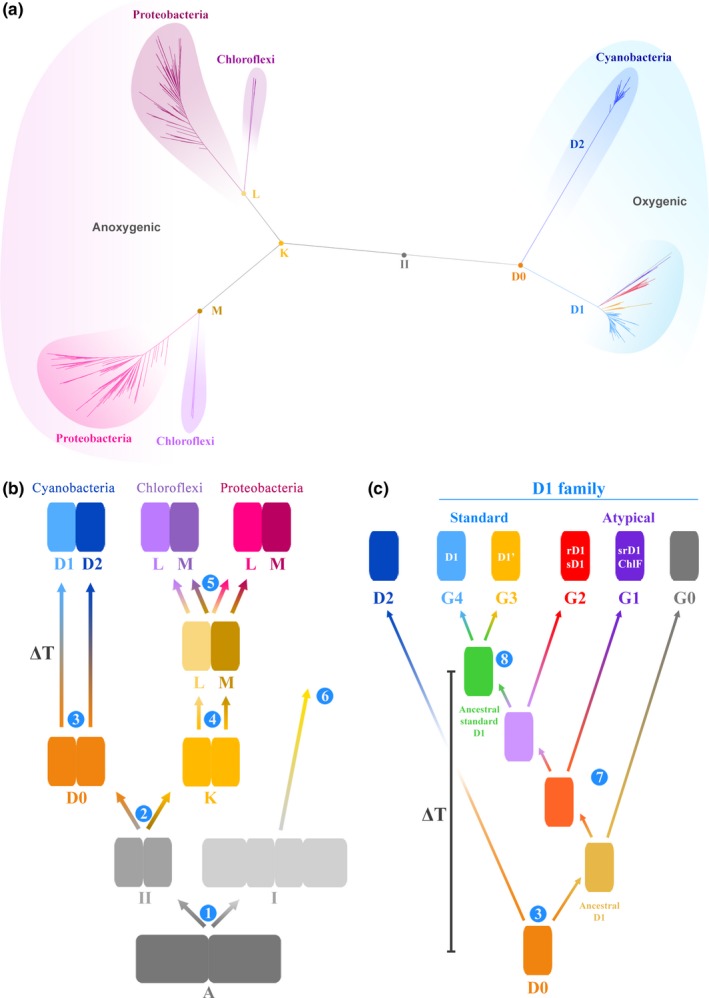
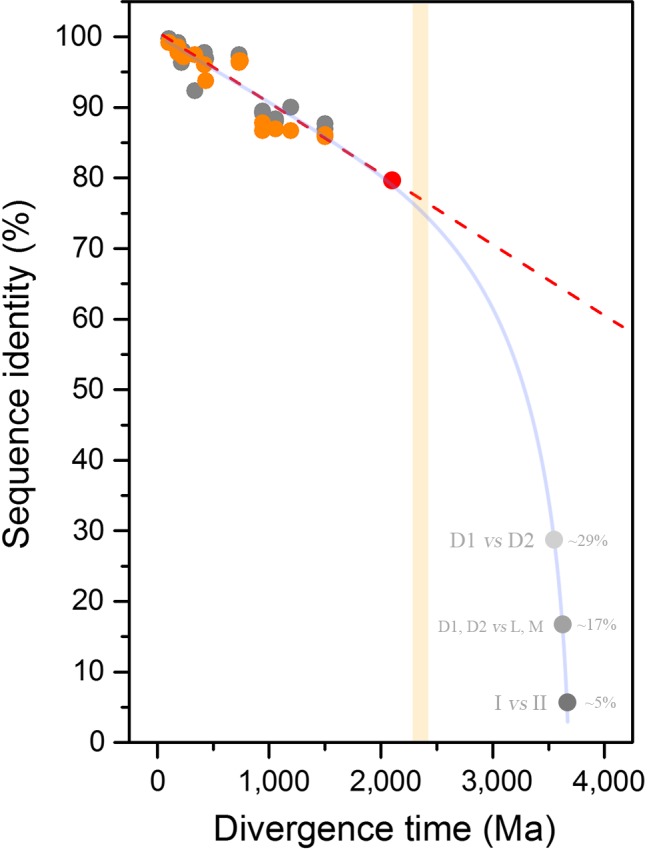
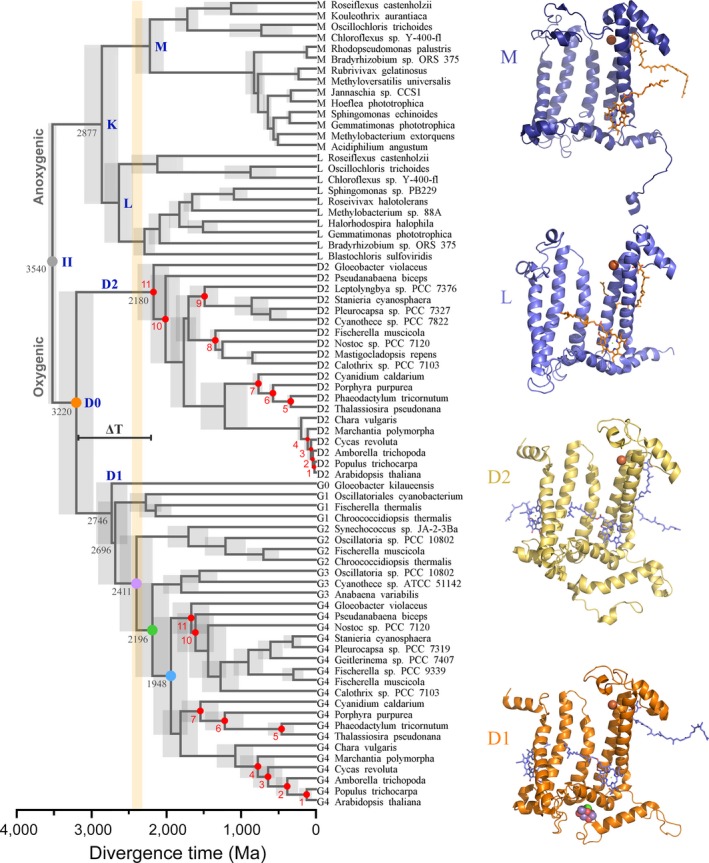
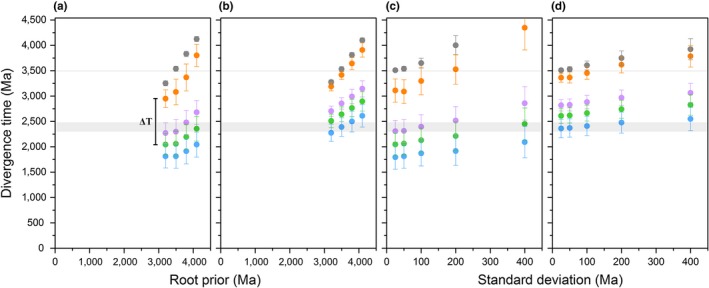
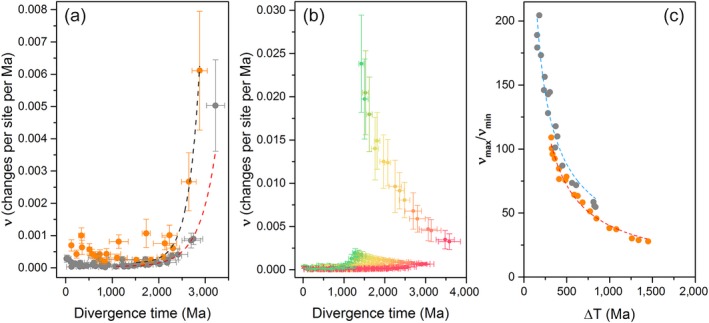
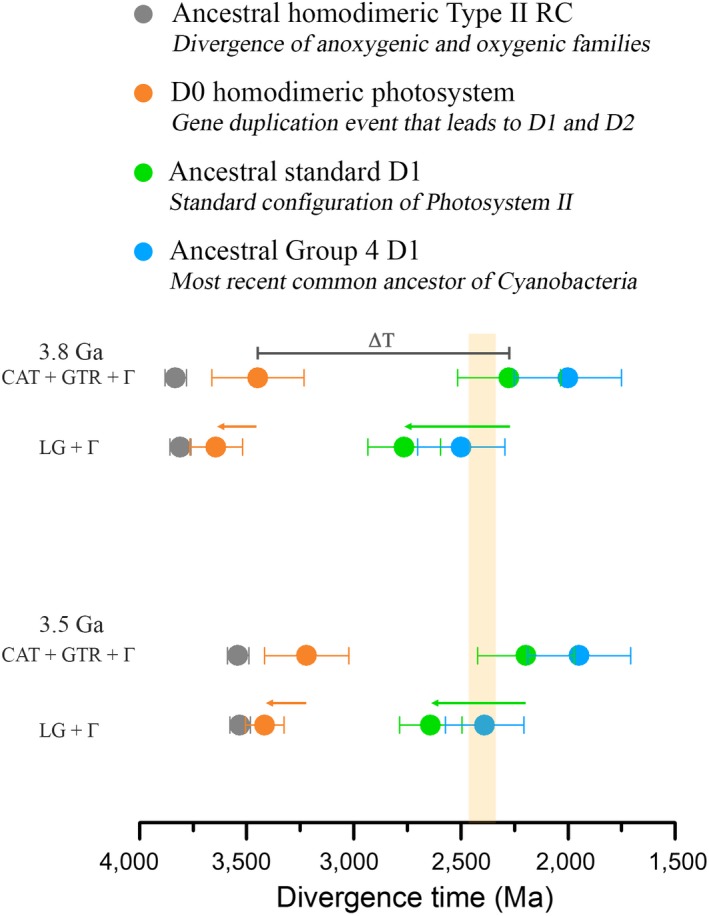
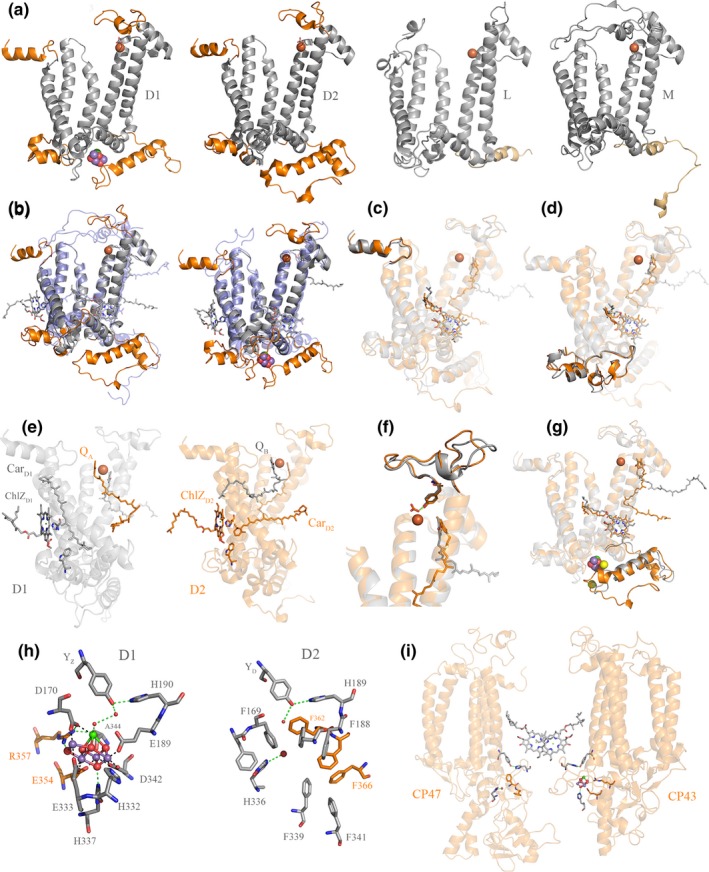
Photosystem II is a photochemical reaction center that catalyzes the light-driven oxidation of water to molecular oxygen. Water oxidation is the distinctive photochemical reaction that permitted the evolution of oxygenic photosynthesis and the eventual rise of eukaryotes. At what point during the history of life an ancestral photosystem evolved the capacity to oxidize water still remains unknown. Here, we study the evolution of the core reaction center proteins of Photosystem II using sequence and structural comparisons in combination with Bayesian relaxed molecular clocks. Our results indicate that a homodimeric photosystem with sufficient oxidizing power to split water had already appeared in the early Archean about a billion years before the most recent common ancestor of all described Cyanobacteria capable of oxygenic photosynthesis, and well before the diversification of some of the known groups of anoxygenic photosynthetic bacteria. Based on a structural and functional rationale, we hypothesize that this early Archean photosystem was capable of water oxidation to oxygen and had already evolved protection mechanisms against the formation of reactive oxygen species. This would place primordial forms of oxygenic photosynthesis at a very early stage in the evolutionary history of life.
Overview
The claims and statistics of this paper haven’t been checked yet.
Run the check — free, no account needed. It reads the open-access text and checks the sources it cites.
Integrity signals
Registry
Cites
Statistics
Figures
Verification
Claims the paper makes
The claims and statistics of this paper haven’t been checked yet.
Run the check — free, no account needed. It reads the open-access text and checks the sources it cites.
Claims other papers make about this one
Each is checked against this paper’s own text: does it say what the citing paper says it does?
The source backs part of the claim, not all of it — or backs it for a different population, condition or comparison.
In the citing paper
“While some argue that oxygenic photosynthesis evolved only 50 to 100 Ma before the GOE (115), most studies suggest an earlier Paleoarchean or Mesoarchean age [e.g., (3, 118, 119)].”
From The Archean atmosphere (2020) · cites this paper as [118]
Experimental — accuracy not yet measured
Self-check
Percentages, sums and reported differences re-computed from the paper’s own numbers.
The self-check needs the paper’s full text.
Citations
Cites
Guindon, S., Dufayard, J.-F., Lefort, V., Anisimova, M., Hordijk, W., & Gascuel, O. (2010) · Systematic Biology · doi:10.1093/sysbio/syq010 · Cited by 18,376
Fast, scalable generation of high-quality protein multiple sequence alignments using Clustal Omega
Sievers, F., Wilm, A., Dineen, D., Gibson, T., Karplus, K., Li, W.-Z., Lopez, R., McWilliam, H., Remmert, M., Söding, J., et al. (2011) · Molecular Systems Biology · doi:10.1038/msb.2011.75 · Cited by 15,576
The Evolutionary Fate and Consequences of Duplicate Genes
Lynch, M., & Conery, J. S. (2000) · Science · doi:10.1126/science.290.5494.1151 · Cited by 4,988
Crystal structure of oxygen-evolving photosystem II at a resolution of 1.9 Å
Umena, Y., Kawakami, K., Shen, J., & Kamiya, N. (2011) · Nature · doi:10.1038/nature09913 · Cited by 3,920
Architecture of the Photosynthetic Oxygen-Evolving Center
Ferreira, K. N., Iverson, T. M., Maghlaoui, K., Barber, J. P., & Iwata, S. (2004) · Science · doi:10.1126/science.1093087 · Cited by 3,330
The rise of oxygen in Earth's early ocean and atmosphere
Lyons, T. W., Reinhard, C. T., & Planavsky, N. J. (2014) · Nature · doi:10.1038/nature13068 · Cited by 2,810
Photoinhibition of Photosystem II. Inactivation, protein damage and turnover
Aro, E., Virgin, I., & Andersson, B. (1993) · Biochimica et Biophysica Acta (BBA) - Bioenergetics · doi:10.1016/0005-2728(93)90134-2 · Cited by 2,387
Artificial photosynthesis for solar water-splitting
Tachibana, Y., Vayssières, L., & Durrant, J. R. (2012) · Nature Photonics · doi:10.1038/nphoton.2012.175 · Cited by 2,096
Towards complete cofactor arrangement in the 3.0 Å resolution structure of photosystem II
Loll, B., Kern, J. F., Saenger, W., Zouni, A., & Biesiadka, J. (2005) · Nature · doi:10.1038/nature04224 · Cited by 1,867
A Bayesian Mixture Model for Across-Site Heterogeneities in the Amino-Acid Replacement Process
Lartillot, N., & Philippe, H. (2004) · Molecular Biology and Evolution · doi:10.1093/molbev/msh112 · Cited by 1,516
Research works printed but not linked: 1
- 10.1104/pp.010245 · DOI
Cited by
Sorted by citations
Catling, D. C., & Zahnle, K. J. (2020) · Science Advances · doi:10.1126/sciadv.aax1420 · Cited by 568
Plant carotenoids: recent advances and future perspectives
Sun, T., Rao, S., Zhou, X., & Li, L. (2022) · Molecular Horticulture · doi:10.1186/s43897-022-00023-2 · Cited by 581
Global geographical and historical overview of cyanotoxin distribution and cyanobacterial poisonings
Svirčev, Z. B., Lalić, D., Savić, G. B., Tokodi, N., Drobac, D., Chen, L., Meriluoto, J. A. O., & Codd, G. A. (2019) · Archives of Toxicology · doi:10.1007/s00204-019-02524-4 · Cited by 423
On the origin of oxygenic photosynthesis and Cyanobacteria
Sánchez‐Baracaldo, P., & Cardona, T. (2019) · New Phytologist · doi:10.1111/nph.16249 · Cited by 290
Self-citationCyanobacteria and biogeochemical cycles through Earth history
Sánchez-Baracaldo, P., Bianchini, G., Wilson, J. D., & Knoll, A. H. (2022) · Trends in Microbiology · doi:10.1016/j.tim.2021.05.008 · Cited by 279
Self-citationWhere silylene–silicon centres matter in the activation of small molecules
Shan, C., Yao, S., & Drieß, M. (2020) · Chemical Society Reviews · doi:10.1039/d0cs00815j · Cited by 244
Eukaryogenesis and oxygen in Earth history
Mills, D. B., Boyle, R. A., Daines, S. J., Sperling, E. A., Pisani, D., Donoghue, P. C. J., & Lenton, T. M. (2022) · Nature Ecology & Evolution · doi:10.1038/s41559-022-01733-y · Cited by 156
Timing the evolution of antioxidant enzymes in cyanobacteria
Boden, J. S., Konhauser, K. O., Robbins, L. J., & Sánchez‐Baracaldo, P. (2021) · Nature Communications · doi:10.1038/s41467-021-24396-y · Cited by 147
Self-citationThe evolution of oxygen-utilizing enzymes suggests early biosphere oxygenation
Jabłońska, J., & Tawfik, D. S. (2021) · Nature Ecology & Evolution · doi:10.1038/s41559-020-01386-9 · Cited by 107
How Microbes Evolved to Tolerate Oxygen
Khademian, M., & Imlay, J. A. (2020) · Trends in Microbiology · doi:10.1016/j.tim.2020.10.001 · Cited by 112
Ward, L. M., Cardona, T., & Holland-Moritz, H. E. (2019) · Frontiers in Microbiology · doi:10.3389/fmicb.2019.01658 · Cited by 113
Self-citationEarliest life on Earth: Evidence from the Barberton Greenstone Belt, South Africa
Homann, M. (2019) · Earth-Science Reviews · doi:10.1016/j.earscirev.2019.102888 · Cited by 104
An abiotic source of Archean hydrogen peroxide and oxygen that pre-dates oxygenic photosynthesis
He, H., Wu, X. G., Xian, H., Zhu, J., Yang, Y., Lv, Y., Li, Y., & Konhauser, K. O. (2021) · Nature Communications · doi:10.1038/s41467-021-26916-2 · Cited by 105
Manganese oxides, Earth surface oxygenation, and the rise of oxygenic photosynthesis
Robbins, L. J., Fakhraee, M., Smith, A. J. B., Bishop, B., Swanner, E. D., Peacock, C. L., Wang, C., Planavsky, N. J., Reinhard, C. T., Crowe, S. A., et al. (2023) · Earth-Science Reviews · doi:10.1016/j.earscirev.2023.104368 · Cited by 96
Evolution of the structure and impact of Earth’s biosphere
Planavsky, N. J., Crowe, S. A., Fakhraee, M., Beaty, B., Reinhard, C. T., Mills, B. J. W., Holstege, C., & Konhauser, K. O. (2021) · Nature Reviews Earth & Environment · doi:10.1038/s43017-020-00116-w · Cited by 102
Hao, J., Knoll, A. H., Huang, F., Schieber, J., Hazen, R. M., & Daniel, I. (2020) · Geochimica et Cosmochimica Acta · doi:10.1016/j.gca.2020.04.005 · Cited by 83
Global distribution of a chlorophyll f cyanobacterial marker
Antonaru, L. A., Cardona, T., Larkum, A. W. D., & Nürnberg, D. J. (2020) · The ISME Journal · doi:10.1038/s41396-020-0670-y · Cited by 79
Self-citationLimited oxygen production in the Mesoarchean ocean
Ossa, F. O., Hofmann, A., Spangenberg, J. E., Poulton, S. W., Stüeken, E. E., Schoenberg, R., Eickmann, B., Wille, M., Butler, M. J., & Bekker, A. (2019) · Proceedings of the National Academy of Sciences · doi:10.1073/pnas.1818762116 · Cited by 74
Thinking twice about the evolution of photosynthesis
Cardona, T. (2019) · Open Biology · doi:10.1098/rsob.180246 · Cited by 81
Self-citationTime-resolved comparative molecular evolution of oxygenic photosynthesis
Oliver, T. J., Sánchez‐Baracaldo, P., Larkum, A. W. D., Rutherford, A. W., & Cardona, T. (2021) · Biochimica et Biophysica Acta (BBA) - Bioenergetics · doi:10.1016/j.bbabio.2021.148400 · Cited by 74
Self-citationOrf, G. S., Gisriel, C. J., & Redding, K. (2018) · Photosynthesis Research · doi:10.1007/s11120-018-0503-2 · Cited by 73
Marine biogeochemical nitrogen cycling through Earth’s history
Stüeken, E. E., Pellerin, A., Thomazo, C., Johnson, B., Duncanson, S. P., & Schoepfer, S. D. (2024) · Nature Reviews Earth & Environment · doi:10.1038/s43017-024-00591-5 · Cited by 68
Hamilton, T. L. (2019) · Free Radical Biology and Medicine · doi:10.1016/j.freeradbiomed.2019.05.003 · Cited by 67
Humboldt Review: Photorespiration – Rubisco's repair crew
Bauwe, H. (2022) · Journal of Plant Physiology · doi:10.1016/j.jplph.2022.153899 · Cited by 60
Recent Advances in Understanding the Structural and Functional Evolution of FtsH Proteases
Yi, L., Liu, B., Nixon, P. J., Yu, J., & Chen, F. (2022) · Frontiers in Plant Science · doi:10.3389/fpls.2022.837528 · Cited by 58
Oliver, N., Avramov, A. P., Nürnberg, D. J., Dau, H., & Burnap, R. L. (2022) · Photosynthesis Research · doi:10.1007/s11120-022-00912-z · Cited by 57
Evolution of Photochemical Reaction Centres: More Twists?
Cardona, T., & Rutherford, A. W. (2019) · Trends in Plant Science · doi:10.1016/j.tplants.2019.06.016 · Cited by 55
Self-citationFranco‐Morgado, M., Amador‐Espejo, G. G., Pérez-Cortés, M., & Gutierrez-Uribe, J. A. (2023) · Applied Food Research · doi:10.1016/j.afres.2023.100296 · Cited by 55
The Evolution and Evolvability of Photosystem II
Oliver, T., Kim, T. D., Trinugroho, J. P., Cordón-Preciado, V., Wijayatilake, N., Bhatia, A., Rutherford, A. W., & Cardona, T. (2023) · Annual Review of Plant Biology · doi:10.1146/annurev-arplant-070522-062509 · Cited by 52
Self-citationThe Plasticity of Photosystem I
Hippler, M., & Nelson, N. (2021) · Plant and Cell Physiology · doi:10.1093/pcp/pcab046 · Cited by 46
Early Archean origin of heterodimeric Photosystem I
Cardona, T. (2018) · Heliyon · doi:10.1016/j.heliyon.2018.e00548 · Cited by 44
Self-citationA review and assessment of cyanobacterial toxins as cardiovascular health hazards
Svirčev, Z. B., Chen, L., Sántha, K., Drobac, D., Šušak, S., Vulin, A., Malešević, T. P., Codd, G. A., & Meriluoto, J. A. O. (2022) · Archives of Toxicology · doi:10.1007/s00204-022-03354-7 · Cited by 41
The diversity and distribution of D1 proteins in cyanobacteria
Sheridan, K. J., Duncan, E. J., Eaton‐Rye, J. J., & Summerfield, T. C. (2020) · Photosynthesis Research · doi:10.1007/s11120-020-00762-7 · Cited by 39
Ślesak, I., Kula-Maximenko, M., Ślesak, H., Miszalski, Z., & Strzałka, K. (2019) · Free Radical Biology and Medicine · doi:10.1016/j.freeradbiomed.2019.03.004 · Cited by 41
Kees, E. D., Murugapiran, S. K., Bennett, A. C., & Hamilton, T. L. (2022) · mSystems · doi:10.1128/msystems.00317-22 · Cited by 38
Engineering carbon assimilation in plants
Qin, K., Ye, X., Luo, S., Fernie, A. R., & Zhang, Y. (2025) · Journal of Integrative Plant Biology · doi:10.1111/jipb.13825 · Cited by 35
Gloeobacter and the implications of a freshwater origin of Cyanobacteria
Raven, J. A., & Sánchez‐Baracaldo, P. (2021) · Phycologia · doi:10.1080/00318884.2021.1881729 · Cited by 36
Self-citationActive Galactic Nuclei: Boon or Bane for Biota?
Lingam, M., Ginsburg, I., & Bialy, S. (2019) · The Astrophysical Journal · doi:10.3847/1538-4357/ab1b2f · Cited by 36
Recent advances in the structural diversity of reaction centers
Gisriel, C. J., Azai, C., & Cardona, T. (2021) · Photosynthesis Research · doi:10.1007/s11120-021-00857-9 · Cited by 33
Self-citationOldest thylakoids in fossil cells directly evidence oxygenic photosynthesis
Demoulin, C., Lara, Y. J., Lambion, A., & Javaux, E. (2024) · Nature · doi:10.1038/s41586-023-06896-7 · Cited by 32
Light-Harvesting in Cyanobacteria and Eukaryotic Algae: An Overview
Larkum, A. W. D. (2020) · Advances in photosynthesis and respiration · doi:10.1007/978-3-030-33397-3_10 · Cited by 29
Self-citationRubisco, the imperfect winner: it’s all about the base
Badger, M. R., & Sharwood, R. E. (2022) · Journal of Experimental Botany · doi:10.1093/jxb/erac458 · Cited by 29
Early emergence of the FtsH proteases involved in photosystem II repair
Shao, S., Cardona, T., & Nixon, P. J. (2018) · Photosynthetica · doi:10.1007/s11099-018-0769-9 · Cited by 29
Self-citationMolecular Evolution of Far-Red Light-Acclimated Photosystem II
Gisriel, C. J., Cardona, T., Bryant, D. A., & Brudvig, G. W. (2022) · Microorganisms · doi:10.3390/microorganisms10071270 · Cited by 27
Self-citationSchad, M., Konhauser, K. O., Sánchez‐Baracaldo, P., Kappler, A. A., & Bryce, C. C. (2019) · Free Radical Biology and Medicine · doi:10.1016/j.freeradbiomed.2019.07.014 · Cited by 28
Self-citationMoosmann, B., Schindeldecker, M., & Hajieva, P. (2019) · Biological Chemistry · doi:10.1515/hsz-2019-0232 · Cited by 27
Johnson, C. M., Zheng, X., Djokic, T., Kranendonk, M. J. V., Czaja, A. D., Roden, E., & Beard, B. L. (2022) · Earth-Science Reviews · doi:10.1016/j.earscirev.2022.103992 · Cited by 28
Mesophilic microorganisms build terrestrial mats analogous to Precambrian microbial jungles
Finke, N., Simister, R. L., O’Neil, A. H., Nomosatryo, S., Henny, C., MacLean, L. C. W., Canfield, D. E., Konhauser, K. O., Lalonde, S. V., Fowle, D. A., et al. (2019) · Nature Communications · doi:10.1038/s41467-019-11541-x · Cited by 26
Mondal, S., Kumar, V., & Singh, S. P. (2020) · Ecotoxicology and Environmental Safety · doi:10.1016/j.ecoenv.2020.110730 · Cited by 24
Probing the Role of Cysteine Thiyl Radicals in Biology: Eminently Dangerous, Difficult to Scavenge
Moosmann, B., & Hajieva, P. (2022) · Antioxidants · doi:10.3390/antiox11050885 · Cited by 23
Toxicological effects of cyanobacterial metabolites on zebrafish larval development
Jacinavicius, F. R., Geraldes, V., Fernandes, K. A., Crnkovic, C. M., Gama, W. A., & Pinto, E. (2023) · Harmful Algae · doi:10.1016/j.hal.2023.102430 · Cited by 24
Di, P., Yang, X. Y., Wan, M., Han, M., Zhang, Y., & Yang, L. (2023) · Frontiers in Bioengineering and Biotechnology · doi:10.3389/fbioe.2023.1298501 · Cited by 21
Bianchini, G., Hagemann, M., & Sánchez‐Baracaldo, P. (2024) · Systematic Biology · doi:10.1093/sysbio/syae025 · Cited by 20
Self-citationShimada, Y., Suzuki, T., Matsubara, T., Kitajima‐Ihara, T., Nagao, R., Dohmae, N., & Noguchi, T. (2022) · Nature Communications · doi:10.1038/s41467-022-31931-y · Cited by 19
Fakhraee, M., Tarhan, L. G., Reinhard, C. T., Crowe, S. A., Lyons, T. W., & Planavsky, N. J. (2023) · Earth-Science Reviews · doi:10.1016/j.earscirev.2023.104398 · Cited by 20
Iron homeostasis of cyanobacteria: advancements in siderophores and metal transporters
Fresenborg, L., Graf, J., Schätzle, H., & Schleiff, E. (2020) · Elsevier eBooks · doi:10.1016/b978-0-12-819311-2.00007-3 · Cited by 19
Redox Biochemistry of the Genetic Code
Moosmann, B. (2020) · Trends in Biochemical Sciences · doi:10.1016/j.tibs.2020.10.008 · Cited by 19
Evolution of cellular metabolism and the rise of a globally productive biosphere
Braakman, R. (2019) · Free Radical Biology and Medicine · doi:10.1016/j.freeradbiomed.2019.05.004 · Cited by 18
Guéguen, N., & Maréchal, É. (2021) · Journal of Experimental Botany · doi:10.1093/jxb/erab429 · Cited by 19
Rastogi, R. P., Shree, A., Patel, H. M., Chaudhry, S., & Madamwar, D. (2023) · Algal Research · doi:10.1016/j.algal.2023.103030 · Cited by 17
Water Oxidation by Pentapyridyl Base Metal Complexes? A Case Study
Boniolo, M., Hossain, M. K., Chernev, P., Suremann, N. F., Heizmann, P. A., Lyvik, A. S. L., Beyer, P., Haumann, M., Huang, P. J., Salhi, N., et al. (2022) · Inorganic Chemistry · doi:10.1021/acs.inorgchem.2c00631 · Cited by 15
Regulation of Microalgal Photosynthetic Electron Transfer
Milrad, Y., Mosebach, L., & Buchert, F. E. (2024) · Plants · doi:10.3390/plants13152103 · Cited by 14
Rolczynski, B. S., Dı́az, S. A., Kim, Y. C., Medintz, I. L., Cunningham, P. D., & Melinger, J. S. (2021) · The Journal of Physical Chemistry A · doi:10.1021/acs.jpca.1c07205 · Cited by 14
Natural climate change and glaciations
Walzer, U., & Hendel, R. (2023) · Earth-Science Reviews · doi:10.1016/j.earscirev.2023.104435 · Cited by 15
Complete Genome Sequencing of a NovelGloeobacterSpecies from a Waterfall Cave in Mexico
Saw, J. H. W., Cardona, T., & Montejano, G. (2021) · Genome Biology and Evolution · doi:10.1093/gbe/evab264 · Cited by 16
Self-citationCyclic electron flow and Photosystem II-less photosynthesis
Ermakova, M., Fitzpatrick, D., & Larkum, A. W. D. (2024) · Functional Plant Biology · doi:10.1071/fp24185 · Cited by 13
Self-citationDating the evolution of oxygenic photosynthesis using La-Ce geochronology
Patry, L. A., Bonnand, P., Boyet, M., Afroz, M., Wilmeth, D. T., Ramsay, B., Nonnotte, P., Homann, M., Sansjofre, P., Fralick, P. W., et al. (2025) · Nature · doi:10.1038/s41586-025-09009-8 · Cited by 12
Charge Transport through Self‐Assembled Monolayers of Monoterpenoids
Cafferty, B. J., Li, Y., Baghbanzadeh, M., Rappoport, D., Beyzavi, M. H., & Whitesides, G. M. (2019) · Angewandte Chemie International Edition · doi:10.1002/anie.201902997 · Cited by 12
Demoulin, C., Sforna, M.-C., Lara, Y. J., Cornet, Y., Somogyi, A., Medjoubi, K., Grolimund, D., Sánchez, D. F., Tucoulou, R., Addad, A., et al. (2024) · iScience · doi:10.1016/j.isci.2024.108865 · Cited by 11
A diverse Palaeoproterozoic microbial ecosystem implies early eukaryogenesis
Javaux, E. (2025) · Philosophical Transactions of the Royal Society B Biological Sciences · doi:10.1098/rstb.2024.0092 · Cited by 11
Khaing, E. P., Zhong, V., Kodru, S., Vass, I., & Eaton‐Rye, J. J. (2022) · Biochemistry · doi:10.1021/acs.biochem.2c00164 · Cited by 10
What the earliest evidence for life tells us about the early evolution of the biosphere
Westall, F. (2025) · Philosophical Transactions of the Royal Society B Biological Sciences · doi:10.1098/rstb.2024.0106 · Cited by 11
Ślesak, I., & Ślesak, H. (2024) · New Phytologist · doi:10.1111/nph.19633 · Cited by 9
Robbins, E. H. J., & Kelly, S. L. (2024) · The Plant Cell · doi:10.1093/plcell/koae281 · Cited by 9
Microbial helpers allow cyanobacteria to thrive in ferruginous waters
Szeinbaum, N., Toporek, Y. J., Reinhard, C. T., & Glass, J. B. (2021) · Geobiology · doi:10.1111/gbi.12443 · Cited by 9
Cyanobacteria/Blue-Green Algae
Büdel, B. (2024) · Springer eBooks · doi:10.1007/978-3-662-65712-6_3 · Cited by 9
The mitochondria chronicles of melatonin and ATP: Guardians of phase separation
Loh, D., & Reiter, R. J. (2024) · Mitochondrial Communications · doi:10.1016/j.mitoco.2024.07.002 · Cited by 10
Topological transition in filamentous cyanobacteria: from motion to structure
Cammann, J., Faluweki, M. K., Dambacher, N., Goehring, L., & Mazza, M. G. (2024) · Communications Physics · doi:10.1038/s42005-024-01866-5 · Cited by 8
Khaing, E. P., & Eaton‐Rye, J. J. (2023) · Biochemistry · doi:10.1021/acs.biochem.3c00240 · Cited by 8
Toward a Natural History of Microbial Life
Magnabosco, C., Husain, F., Paoletti, M. M., Parsons, C., Payette, J. G., Schwartz, S. L., Tamre, E., & Fournier, G. P. (2024) · Annual Review of Earth and Planetary Sciences · doi:10.1146/annurev-earth-031621-070542 · Cited by 11
The emergence of metabolisms through Earth history and implications for biospheric evolution
Moody, E. R. R., Williams, T. A., Álvarez-Carretero, S., Szöllősi, G. J., Pisani, D., Lenton, T. M., & Donoghue, P. C. J. (2025) · Philosophical Transactions of the Royal Society B Biological Sciences · doi:10.1098/rstb.2024.0097 · Cited by 12
Ślesak, I., Mazur, Z., & Ślesak, H. (2022) · Photosynthesis Research · doi:10.1007/s11120-022-00917-8 · Cited by 8
Sun, D., Zhou, X., Sun, X., & Xu, N. (2023) · Frontiers in Marine Science · doi:10.3389/fmars.2022.1080474 · Cited by 8
Understanding climate change dynamics of tree species: implications for future forests
Prasad, A., Pedlar, J., Peterson, D. L., Matthews, S., Iverson, L. R., McKenney, D. W., & Adams, B. T. (2023) · Elsevier eBooks · doi:10.1016/b978-0-323-90430-8.00002-2 · Cited by 9
Biogeodynamics: Coupled evolution of the biosphere, atmosphere, and lithosphere
Spencer, C. J. (2022) · Geology · doi:10.1130/geol50thaug.1 · Cited by 6
Environmental Variability and Its Control of Productivity
Norici, A., Gerotto, C., Beardall, J., & Raven, J. A. (2022) · Wiley eBooks · doi:10.1002/9781119986782.ch8 · Cited by 7
An Introduction to the Role of Molybdenum and Tungsten in Biology
Marques, H. M. (2025) · Inorganics · doi:10.3390/inorganics13070219 · Cited by 9
Cyanophages as an important factor in the early evolution of oxygenic photosynthesis
Ślesak, I., & Ślesak, H. (2022) · Scientific Reports · doi:10.1038/s41598-022-24795-1 · Cited by 6
Seeding the Solar System with Life: Mars, Venus, Earth, Moon, Protoplanets
Joseph, R. G., Planchon, O., Gibson, C. H., & Schild, R. E. (2020) · Open Astronomy · doi:10.1515/astro-2020-0019 · Cited by 6
Niederman, R. A. (2024) · Biomolecules · doi:10.3390/biom14030311 · Cited by 5
Grettenberger, C. L., & Sumner, D. Y. (2024) · Geobiology · doi:10.1111/gbi.12622 · Cited by 5
Viral activity in lake analogs of anoxic early Earth oceans
Varona, N. S., Wallace, B. A., Bosco‐Santos, A., Mullinax, J., Stiffler, A. K., O’Beirne, M. D., Ford, J. R., Fulton, J. M., Werne, J. P., Gilhooly, W., et al. (2025) · Microbiome · doi:10.1186/s40168-025-02085-y · Cited by 5
Runge, E., Vulpius, S., Herwartz, D., Pack, A., Brachmann, C., & Noack, L. (2025) · Geo-Bio Interfaces · doi:10.1180/gbi.2025.10003 · Cited by 6
An early origin of oxygenic photosynthesis delays the Great Oxidation
Horne, J. E., Goldblatt, C., & Kump, L. R. (2025) · Philosophical Transactions of the Royal Society B Biological Sciences · doi:10.1098/rstb.2024.0094 · Cited by 6
Bioenergetics evolution: the link between Earth’s and Life’s history
Padalko, A., Karavaeva, V., Beas, J. Z., Neukirchen, S., & Sousa, F. L. (2025) · Philosophical Transactions of the Royal Society B Biological Sciences · doi:10.1098/rstb.2024.0102 · Cited by 7
Espiritu, E., Chamberlain, K. D., Williams, J. C., & Allen, J. P. (2019) · Photosynthesis Research · doi:10.1007/s11120-019-00680-3 · Cited by 5
Chang, W., Li, C., Cui, Z., Li, W., Song, H., Chang, H., Fu, W., Wang, C., Huang, T., Luo, Y., et al. (2021) · Frontiers in Plant Science · doi:10.3389/fpls.2021.676036 · Cited by 5
Pan, J., Zhang, X., Xu, W., Liu, Y., Liu, L., Luo, Z.-H., & Li, M. (2023) · mSystems · doi:10.1128/msystems.00305-23 · Cited by 5
The Early Earth as an Analogue for Exoplanetary Biogeochemistry
Stüeken, E. E., Olson, S. L., Moore, E. K., & Foley, B. J. (2024) · Reviews in Mineralogy and Geochemistry · doi:10.2138/rmg.2024.90.14 · Cited by 5
Origin and Early Evolution of Photosynthesis: A Brief Historical AccountPreprint
Cardona, T. (2022) · Preprints.org · doi:10.20944/preprints202202.0031.v1 · Cited by 5
Self-citation
Metadata
- Authors
- Cardona, T., Sánchez‐Baracaldo, P., Rutherford, A. W., & Larkum, A. W.
- Affiliations
- Imperial College London (GB)
- University of Bristol (GB)
- University of Technology Sydney (AU)
- Corresponding author
- Cardona, Tanai
- Venue
- Geobiology
- Publisher
- Wiley
- Published
- 2018-11-09
- Volume
- 17
- Issue
- 2
- Pages
- 127-150
- ISSN
- 1472-4669 (ISSN-L)
- 1472-4677
- PMC
- PMC6492235
- OpenAlex
- W2900344826
- Cited by
- 144
- References
- 168
- Citations by year
- 2026: 12 · 2025: 21 · 2024: 23 · 2023: 13 · 2022: 22 · 2021: 17 · 2020: 14 · 2019: 18 · 2018: 4
- FWCI
- 4.69
- Type
- journal article
- Language
- en
- Open access
- hybrid
- doi.org
- Licence
- Locations
- Geobiology (publishedVersion, cc-by)
- bioRxiv (Cold Spring Harbor Laboratory) (acceptedVersion, cc-by)
- Europe PMC (PubMed Central) (publishedVersion, cc-by)
- PubMed Central (publishedVersion, cc-by)
- PubMed (publishedVersion)
- Bristol Research (University of Bristol) (publishedVersion, cc-by)
- UTS ePRESS (University of Technology Sydney) (submittedVersion)
- Spiral (Imperial College London) (submittedVersion, other-oa)
- Funders
- Imperial College London
- Leverhulme Trust (RPG‐2017‐223)
- Royal Society
- Biotechnology and Biological Sciences Research Council (BB/K002627/1, BB/L011206/1)
- Topics
- Life Sciences › Biochemistry, Genetics and Molecular Biology › Molecular Biology › Photosynthetic Processes and Mechanisms
- Life Sciences › Agricultural and Biological Sciences › Ecology, Evolution, Behavior and Systematics › Protist diversity and phylogeny
- Life Sciences › Biochemistry, Genetics and Molecular Biology › Biochemistry › Metalloenzymes and iron-sulfur proteins
- Keywords
- photosystem II, water oxidation, oxygenic photosynthesis, Archean, evolution of photosynthesis, cyanobacteria, anoxygenic photosynthetic bacteria, reaction center proteins, reactive oxygen species, eukaryotic origin
- MeSH terms
- Cyanobacteria, Bacterial Proteins, Bayes Theorem, Photosynthesis, Phylogeny, Evolution, Molecular, Photosystem II Protein Complex
About these checks
Registry, retraction, Cites and statistics results are computed, not judged, with one exception: a printed reference that no index lists is read once by a model before it counts as a citation error. Claims are extracted by a model and kept only when their quote appears verbatim in the text; each cited source is then checked, with a model’s help, for whether it says what the claim relies on. Those verdicts can be wrong — read the claim’s quote and the cited source before relying on one.
Statistics and arithmetic are recomputed, not judged.
Confidence bands are shown only for fields calibrated on our annotated test set. None is calibrated yet, so no band is shown.
What counts as a claim ›How we measure confidence ›How we check this ›
Are you an author, or do you see a problem with this page? Request a review
