

Hierarchically patterned self-powered sensors for multifunctional tactile sensing
Open accessThe DOI matches its Crossref record; 40 of the 40 references it cites were found in a registry or an index.
Abstract
A multifunctional self-powered sensor is developed for pressure, temperature, and material sensing.
Overview
The claims and statistics of this paper haven’t been checked yet.
Free: it reads the open-access text and checks the first 5 claims that cite a source we can check. Create a free account to check every claim.
Integrity signals
Registry
Cites
Statistics
Figures



Verification
Claims the paper makes
The claims and statistics of this paper haven’t been checked yet.
Free: it reads the open-access text and checks the first 5 claims that cite a source we can check. Create a free account to check every claim.
Claims other papers make about this one
Each is checked against this paper’s own text: does it say what the citing paper says it does?
The cited source says what the claim attributes to it.
In the citing paper
“The development of novel dual-parameter sensors that transduce different stimuli into separate signals can minimize signal interference, allowing the detection of both temperature and pressure at a single point without decoupling analysis.[107,228,229]”
From Flexible Electronics and Devices as Human–Machine Interfaces for Medical Robotics (2022) · cites this paper as [228]
Self-check
Percentages, sums and reported differences re-computed from the paper’s own numbers.
The self-check needs the paper’s full text.
Citations
Cites
Kim, D.-H., Lu, N., Ma, R., Kim, Y.-S., Kim, R.-H., Wang, S., Wu, J., Won, S. M., Tao, H., Islam, A., et al. (2011) · Science · doi:10.1126/science.1206157 · Cited by 4,836
Self-citationPursuing prosthetic electronic skin
Chortos, A., Liu, J., & Bao, Z. (2016) · Nature Materials · doi:10.1038/nmat4671 · Cited by 2,396 · cited 1×
“For example, electronic skins and flexible sensors have been implemented in robotics and wearable health-monitoring devices to detect ambient changes of strain, vibration, and the direction of applied pressure ( 7 – 13 ).”
Progress in triboelectric nanogenerators as a new energy technology and self-powered sensors
Wang, Z. L., Chen, J., & Lin, L. (2015) · Energy & Environmental Science · doi:10.1039/c5ee01532d · Cited by 2,174
Self-citationCoding and use of tactile signals from the fingertips in object manipulation tasks
Johansson, R. S., & Flanagan, J. R. (2009) · Nature Reviews Neuroscience · doi:10.1038/nrn2621 · Cited by 2,063
Quantifying the triboelectric series
Zou, H., Zhang, Y., Guo, L., Wang, P., He, X., Dai, G., Zheng, H., Chen, C., Wang, A. C., Xu, C., et al. (2019) · Nature Communications · doi:10.1038/s41467-019-09461-x · Cited by 1,920
Self-citationPu, X., Liu, M., Chen, X., Sun, J., Du, C., Zhang, Y., Zhai, J., Hu, W., & Wang, Z. L. (2017) · Science Advances · doi:10.1126/sciadv.1700015 · Cited by 1,218 · cited 1×
“Triboelectric nanogenerator (TENG) is a promising alternative approach to bridging the technological gap (24, 25).”
Self-citationSoft Microfluidic Assemblies of Sensors, Circuits, and Radios for the Skin
Xu, S., Zhang, Y., Jia, L., Mathewson, K. E., Jang, K.-I., Kim, J., Fu, H., Huang, X., Chava, P., Wang, R., et al. (2014) · Science · doi:10.1126/science.1250169 · Cited by 1,199
Inflammation-free, gas-permeable, lightweight, stretchable on-skin electronics with nanomeshes
Miyamoto, A., Lee, S., Cooray, N. F., Lee, S., Mori, M., Matsuhisa, N., Jin, H., Yoda, L., Yokota, T., Itoh, A., et al. (2017) · Nature Nanotechnology · doi:10.1038/nnano.2017.125 · Cited by 1,181
Learning the signatures of the human grasp using a scalable tactile glove
Sundaram, S., Kellnhofer, P., Li, Y., Zhu, J.-Y., Torralba, A., & Matusik, W. (2019) · Nature · doi:10.1038/s41586-019-1234-z · Cited by 1,162 · cited 1×
“(23) recently demonstrated a scalable tactile glove that can perceive individual objects by deep convolution neural networks.”
Yao, H., Ge, J., Wang, C., Wang, X., Hu, W., Zheng, Z., Ni, Y., & Yu, S. (2013) · Advanced Materials · doi:10.1002/adma.201303041 · Cited by 1,137
Cited by
Items 101–200 of 429
Zhu, L., Xu, P., Chang, B., Ning, J., Yan, T., Yang, Z., & Lü, H. (2024) · Advanced Functional Materials · doi:10.1002/adfm.202400363 · Cited by 89
An Edible and Nutritive Zinc-Ion Micro-supercapacitor in the Stomach with Ultrahigh Energy Density
Chen, K., Yan, L., Sheng, Y., Ma, Y., Qu, L., & Zhao, Y. (2022) · ACS Nano · doi:10.1021/acsnano.2c06656 · Cited by 88
Robust triboelectric information‐mat enhanced by multi‐modality deep learning for smart home
Yang, Y., Shi, Q., Zhang, Z., Shan, X., Salam, B., & Lee, C. (2022) · InfoMat · doi:10.1002/inf2.12360 · Cited by 84
Self-citationKim, D. B., Han, J., Sung, S. M., Kim, M. S., Choi, B. K., Park, S. J., Hong, H. R., Choi, H. J., Kim, B. K., Park, C. H., et al. (2022) · npj Flexible Electronics · doi:10.1038/s41528-022-00203-6 · Cited by 82
Zhao, X., Sun, Z., & Lee, C. (2024) · Advanced Functional Materials · doi:10.1002/adfm.202409558 · Cited by 85
Guo, W., Xia, Y., Zhu, Y., Han, S., Li, Q., & Wang, X. (2022) · Nano Energy · doi:10.1016/j.nanoen.2023.108229 · Cited by 78
Wang, S., Gao, F. Q., Hu, Y., Zhang, S., Shang, H., Ge, C., Tan, B., Zhang, X., Zhang, J., & Hu, P. (2022) · Chemical Engineering Journal · doi:10.1016/j.cej.2022.136446 · Cited by 78
Flexible microstructured pressure sensors: design, fabrication and applications
Gao, Y., Xiao, T., Li, Q., Chen, Y., Qiu, X., Liu, J., Bian, Y., & Xuan, F. (2022) · Nanotechnology · doi:10.1088/1361-6528/ac6812 · Cited by 79
“Wang et al [137] presented a multifunctional pressure sensor based on a hydrophobic polytetrafluoroethylene (PTFE) film and a sponge-like graphene/PDMS composite.”
Yu, Z., Wan, Y., Zhou, M., Mia, M. H., Huo, S., Huang, L., Xu, J., Jiang, Q., Zheng, Z., Hu, X., et al. (2025) · Nano-Micro Letters · doi:10.1007/s40820-025-01728-x · Cited by 76
Recent Progress on Flexible Multimodal Sensors: Decoupling Strategies, Fabrication and Applications
Wu, T., Li, Y., Zhao, L., Zhang, Y., Zhang, Z., Yuan, J., Wu, Y., Che, A., Ma, Y., Chai, Y., et al. (2026) · Advanced Materials · doi:10.1002/adma.202521375 · Cited by 78
Self-citationBioinspired design of highly sensitive flexible tactile sensors for wearable healthcare monitoring
Chen, J.-J., Li, L., Zhu, Z., Luo, Z., Tang, W., Wang, L., & Li, H. (2021) · Materials Today Chemistry · doi:10.1016/j.mtchem.2021.100718 · Cited by 75
Yang, H., Shang, J.-C., Wang, W., Yang, Y., Yuan, Y., Lei, H., & Fang, D. (2022) · Composites Science and Technology · doi:10.1016/j.compscitech.2022.109308 · Cited by 78
Self-citationYuan, T., Yin, R., Li, C., Fan, Z., & Pan, L. (2024) · Chemical Engineering Journal · doi:10.1016/j.cej.2024.150396 · Cited by 75
Xiong, Y., Huo, Z., Zhang, J., Liu, Y., Yue, D., Xu, N., Gu, R., Liang, W. P., Luo, L., Chen, M., et al. (2024) · Nano Energy · doi:10.1016/j.nanoen.2024.109465 · Cited by 72
Self-citationMultidimensional Force Sensors Based on Triboelectric Nanogenerators for Electronic Skin
Wang, Z., Bu, T., Li, Y. Y., Wei, D., Tao, B., Yin, Z., Zhang, C., & Wu, H. (2021) · ACS Applied Materials & Interfaces · doi:10.1021/acsami.1c17506 · Cited by 73
Self-citationWang, S., Zhang, Z., Yang, B. T., Zhang, X., Shang, H., Jiang, L. W., Liu, H., Zhang, J., & Hu, P. (2022) · Chemical Engineering Journal · doi:10.1016/j.cej.2022.141136 · Cited by 71
Laser-Induced Corrugated Graphene Films for Integrated Multimodal Sensors
Li, Q., Wu, T., Zhao, W. G., Ji, J., & Wang, G. (2021) · ACS Applied Materials & Interfaces · doi:10.1021/acsami.1c12686 · Cited by 70
Multi-functional graphene/leather for versatile wearable electronics
Guo, Q., Guo, J., Chen, H., Zhou, P., Li, C., Yang, K., Hua, N., Wang, J., & Weng, M. (2023) · Journal of Materials Chemistry A · doi:10.1039/d3ta01087b · Cited by 70
Programmable and Ultrasensitive Haptic Interfaces Enabling Closed‐Loop Human–Machine Interactions
Lin, W., Wei, C., Yu, S., Chen, Z., Zhang, C., Guo, Z., Liao, Q., Wang, S., Lin, M., Zheng, Y., et al. (2023) · Advanced Functional Materials · doi:10.1002/adfm.202305919 · Cited by 71
Guo, X., Lu, X., Jiang, P., & Bao, X. (2024) · Advanced Materials · doi:10.1002/adma.202313911 · Cited by 79
Advances in Soft Strain and Pressure Sensors
Nguyen, D. V., Song, P., Manshaii, F., Bell, J. M., Chen, J., & Dinh, T. (2025) · ACS Nano · doi:10.1021/acsnano.4c15134 · Cited by 76
Functional Ion Gels: Versatile Electrolyte Platforms for Electrochemical Applications
Kim, Y. M., Choi, W. Y., Kwon, J. H., Lee, J. K., & Moon, H. C. (2021) · Chemistry of Materials · doi:10.1021/acs.chemmater.1c00330 · Cited by 70
Xing, C., Tian, Y., Yu, Z., Li, Z., Meng, B., & Peng, Z. (2022) · ACS Applied Materials & Interfaces · doi:10.1021/acsami.2c10551 · Cited by 69
Cao, Y., Chi, H., Zhu, Z., Fan, S., Zhang, Y., Tang, Y., & Hou, D. (2024) · Advanced Functional Materials · doi:10.1002/adfm.202412634 · Cited by 79
All Resistive Pressure–Temperature Bimodal Sensing E‐Skin for Object Classification
Han, S., Zhi, X., Xia, Y., Guo, W., Li, Q., Chen, D., Liu, K., & Wang, X. (2023) · Small · doi:10.1002/smll.202301593 · Cited by 70
Advanced Design of Soft Robots with Artificial Intelligence
Cao, Y., Xu, B., Li, B., & Fu, H. C. (2024) · Nano-Micro Letters · doi:10.1007/s40820-024-01423-3 · Cited by 77
Gao, X., Gao, F., Liu, J., Li, Y., Wan, P., Yu, Z., & Li, X. (2022) · ACS Applied Materials & Interfaces · doi:10.1021/acsami.2c12892 · Cited by 71
Giant Thermopower of Hydrogen Ion Enhanced by a Strong Hydrogen Bond System
Chen, Q., Chen, B., Xiao, S., Feng, J., Yang, J., Yue, Q., Zhang, X., & Wang, T. (2022) · ACS Applied Materials & Interfaces · doi:10.1021/acsami.1c24698 · Cited by 66
Nanogenerators‐Based Self‐Powered Sensors
Mondal, R., Hasan, M. A. M., Zhang, R., Olin, H., & Yang, Y. F. (2022) · Advanced Materials Technologies · doi:10.1002/admt.202200282 · Cited by 64
Self-citationDual‐Scale Porous Composite for Tactile Sensor with High Sensitivity over an Ultrawide Sensing Range
Bae, K., Kim, M., Kang, Y., Sim, S., Kim, W., Pyo, S., & Kim, J. (2022) · Small · doi:10.1002/smll.202203193 · Cited by 68
Xu, J., Xie, Z., Yue, H., Lu, Y., & Yang, F. (2022) · Nano Energy · doi:10.1016/j.nanoen.2022.107845 · Cited by 62
Filiform Papillae‐Inspired Wearable Pressure Sensor with High Sensitivity and Wide Detection Range
Li, G., Zhang, Y., Zhang, X., Zhu, B., Lei, Y., Chen, D., Shui, L., Wu, G., & Xue, L. (2024) · Advanced Functional Materials · doi:10.1002/adfm.202414465 · Cited by 62
Surface Texture Recognition by Deep Learning‐Enhanced Tactile Sensing
Yan, Y., Hu, Z., Shen, Y., & Pan, J. (2021) · Advanced Intelligent Systems · doi:10.1002/aisy.202100076 · Cited by 61
Li, T., Qi, H., Zhao, Y., Kumar, P., Zhao, C., Li, Z., Dong, X., Guo, X. L., Zhao, M., Li, X., et al. (2024) · Science Advances · doi:10.1126/sciadv.adk6643 · Cited by 76
Ren, J., Huang, X., Han, R., Chen, G., Li, Q., & Zhou, Z. G. (2024) · Advanced Functional Materials · doi:10.1002/adfm.202403091 · Cited by 62
Applications of piezoelectric-based sensors, actuators, and energy harvesters
Mangi, M. A., Elahi, H., Ali, A., Jabbar, H., Aqeel, A. B., Farrukh, A., Bibi, S., Altabey, W. A., Kouritem, S. A., & Noori, M. N. (2025) · Sensors and Actuators Reports · doi:10.1016/j.snr.2025.100302 · Cited by 82
Wu, H., Luo, R., Li, Z., Tian, Y., Yuan, J., Su, B., Zhou, K., Yan, C., & Shi, Y. (2023) · Advanced Materials · doi:10.1002/adma.202307546 · Cited by 60
Self-citationSun, Z., He, T., Ren, Z., Wang, C., Liu, X., Zhang, Z., Zhou, J., Guo, X., Yang, Y., & Lee, C. (2025) · SmartSys · doi:10.1002/sys3.4 · Cited by 65
Self-citationWen, J., He, H., Niu, C., Rong, M., Huang, Y., & Wu, Y. (2022) · Nano Energy · doi:10.1016/j.nanoen.2022.107070 · Cited by 59
Sun, Q., Liang, F., Ren, G., Zhang, L., He, S., Gao, K., Gong, Z., Zhang, Y., Kang, X., Zhu, C., et al. (2023) · Advanced Materials · doi:10.1002/adma.202210915 · Cited by 59
Lian, Y., Jia, S., Yu, H., Han, J., Jiang, J., Lan, C., Liu, X., Liao, Y., Dong, X., Wang, Y., et al. (2024) · Advanced Materials · doi:10.1002/adma.202404336 · Cited by 62
Self-citationApproaches to deformable physical sensors: Electronic versus iontronic
Kim, T. Y., Suh, W., & Jeong, U. (2021) · Materials Science and Engineering R Reports · doi:10.1016/j.mser.2021.100640 · Cited by 61
Challenges in Materials and Devices of Electronic Skin
Zhang, J., Li, J., Cheng, W. M., Zhang, J., Zhou, Z., Sun, X., Li, L., Liang, J., Shi, Y., & Pan, L. (2022) · ACS Materials Letters · doi:10.1021/acsmaterialslett.1c00799 · Cited by 57
Fan, B., Liu, G., Fu, X., Wang, Z., Zhang, Z., & Zhang, C. (2022) · Chemical Engineering Journal · doi:10.1016/j.cej.2022.137263 · Cited by 55
Self-citationResearch Progresses in Microstructure Designs of Flexible Pressure Sensors
HUANG, H. Y., Zhong, J., Ye, Y., Wu, R., Luo, B., Ning, H., Qiu, T., Luo, D., Yao, R., & Peng, J. (2022) · Polymers · doi:10.3390/polym14173670 · Cited by 55
Flexible Tactile Sensors for 3D Force Detection
Han, C., Cao, Z. M., Hu, Y., Zhang, Z., Li, C., Wang, Z. L., & Wu, Z. (2024) · Nano Letters · doi:10.1021/acs.nanolett.4c00894 · Cited by 56
Self-citationMultifunctional Tactile Sensors for Object Recognition
Wang, L., Qi, X., Li, C., & Wang, Y. (2024) · Advanced Functional Materials · doi:10.1002/adfm.202409358 · Cited by 67
Self-citationLuo, R., Cui, Y., Li, H., Wu, Y., Du, B., Zhou, S., & Hu, J. (2023) · ACS Applied Nano Materials · doi:10.1021/acsanm.3c01285 · Cited by 53
2D Materials Beyond Post‐AI Era: Smart Fibers, Soft Robotics, and Single Atom Catalysts
Lee, G. S., Kim, J. G., Kim, J. T., Lee, C. W., Cha, S., Choi, G. B., Lim, J., Sasikala, S. P., & Kim, S. O. (2023) · Advanced Materials · doi:10.1002/adma.202307689 · Cited by 60
Park, H., Gbadam, G. S., Niu, S., Ryu, H., & Lee, J. (2024) · International Journal of Extreme Manufacturing · doi:10.1088/2631-7990/ad88be · Cited by 72
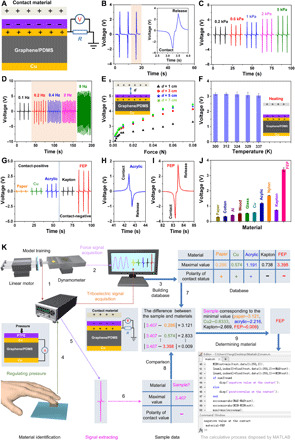
“Wang et al reported a sponge-structured film for pressure, temperature, and material identification (figure 8(f)) [25].”
Flexible pressure sensor based on 3D printing MXene@dual-scale porous polymer
Zhang, S., Feng, W., Jiang, Y., Li, Y., Liu, Y., Yu, D., & Wang, W. (2024) · Chemical Engineering Journal · doi:10.1016/j.cej.2024.155356 · Cited by 52
Piezoresistive design for electronic skin: from fundamental to emerging applications
Zhong, F., Hu, W., Zhu, P., Wang, H., Ma, C., Lin, N., & Wang, Z. (2022) · Opto-Electronic Advances · doi:10.29026/oea.2022.210029 · Cited by 54
Self-citationHong, Q., Liu, T., Guo, X., Yan, Z., Li, W., Liu, L., Wang, D., Hong, W., Qian, Z., Zhang, A., et al. (2024) · Sensors and Actuators B Chemical · doi:10.1016/j.snb.2023.135255 · Cited by 51
Self-citationAn All-Protein Multisensory Highly Bionic Skin
Li, S., Liu, A., Qiu, W., Wang, Y., Liu, G., Liu, J., Shi, Y., Li, Y., Li, J., Cai, W., et al. (2024) · ACS Nano · doi:10.1021/acsnano.3c12525 · Cited by 52
Self-citationA dual function flexible sensor for independent temperature and pressure sensing
Hu, R., Li, J., Wu, F., Lu, Z., & Deng, C. (2024) · Chemical Engineering Journal · doi:10.1016/j.cej.2024.152135 · Cited by 52
Bagchi, B., Datta, P., Fernandez, C. S., Gupta, P., Jaufuraully, S., David, A. L., Siassakos, D. M., Desjardins, A. E., & Tiwari, M. K. (2023) · Materials Horizons · doi:10.1039/d3mh00404j · Cited by 49
Jin, C., Zhang, C., Yan, P., Jiang, M., Yin, R., Li, K., Zhao, W., & Bai, Z. (2024) · Advanced Functional Materials · doi:10.1002/adfm.202402233 · Cited by 52
Niu, H., Li, H., Li, N., Kan, H., Liu, J., Wang, C., Gao, S., Li, Y., & Xu, X. (2025) · Advanced Functional Materials · doi:10.1002/adfm.202500511 · Cited by 49
Ferroelectric BaTiO3 Based Multi‐Effects Coupled Materials and Devices
Qian, W., Wu, H., & Yang, Y. F. (2022) · Advanced Electronic Materials · doi:10.1002/aelm.202200190 · Cited by 48
Self-citationNiu, H., Li, H., Zhang, Q., Kim, E., Kim, N., & Li, Y. (2023) · Small · doi:10.1002/smll.202308127 · Cited by 53
Liu, G., Wen, W., Zhao, Z., Huang, X., Li, Y., Qin, M., Pan, Z., Guo, Y., & Liu, Y. (2023) · Advanced Materials · doi:10.1002/adma.202300242 · Cited by 47
Liang, T., Liu, Z., Zhang, H., Zhou, X., & Liang, Y. (2025) · Materials Today · doi:10.1016/j.mattod.2025.03.031 · Cited by 50
Self-citationDirect stamping multifunctional tactile sensor for pressure and temperature sensing
Liang, B., Huang, B., He, J., Yang, R., Zhao, C., Yang, B., Cao, A., Tang, Z., & Gui, X. (2021) · Nano Research · doi:10.1007/s12274-021-3906-x · Cited by 47
Huang, Y., Peng, C., Li, Y., Yang, J., & Feng, W. (2023) · Aggregate · doi:10.1002/agt2.319 · Cited by 59
Ding, S., Jin, X., Wang, B., Niu, Z., Ma, J., Zhao, X., Yang, M., Wang, C., Shi, Q., & Li, X. (2023) · ACS Applied Nano Materials · doi:10.1021/acsanm.3c01732 · Cited by 49
Shi, S., Pan, Z., Cheng, Y. S., Zhai, Y., Zhang, Y., Ding, X., Liu, J., Zhai, J., & Xu, J. (2022) · Composites Science and Technology · doi:10.1016/j.compscitech.2022.109260 · Cited by 46
Wang, J., Chen, R., Ji, D., Xu, W., Zhang, W., Zhang, C., Zhou, W., & Luo, T. (2023) · Small · doi:10.1002/smll.202307800 · Cited by 55
A Triboelectric-Based Artificial Whisker for Reactive Obstacle Avoidance and Local Mapping
Xu, P., Wang, X., Wang, S., Chen, T., Liu, J., Zheng, J., Li, W., Xu, M., Tao, J., & Xie, G. (2021) · Research · doi:10.34133/2021/9864967 · Cited by 45
“Very few sensors used in robots provide tactile sensation [7, 8].”
Hou, X., Zhu, M., Sun, L., Ding, T., Huang, Z., Shi, Y., Su, Y., Li, L., Chen, T., & Lee, C. (2021) · Nano Energy · doi:10.1016/j.nanoen.2021.106894 · Cited by 45
Jiang, Y., Fan, L., Sun, X., Luo, Z., Wang, H., Lai, R., Wang, J., Gan, Q., Li, N., & Tian, J. (2024) · Advanced Science · doi:10.1002/advs.202402705 · Cited by 44
Zhang, P., Zhang, J., Li, Y., & Huang, L. (2021) · Journal of Physics D Applied Physics · doi:10.1088/1361-6463/ac1ddc · Cited by 44
Tang, Z., Xue, S.-S., Wang, D.-Y., Huang, P., Li, Y., & Fu, S. (2023) · Composites Science and Technology · doi:10.1016/j.compscitech.2023.110126 · Cited by 43
A multifunctional flexible sensor based on PI-MXene/SrTiO3 hybrid aerogel for tactile perception
Deng, S., Li, Y., Li, S., Yuan, S., Zhu, H., Bai, J., Xu, J., Lü, P., Li, T., & Zhang, T. (2024) · The Innovation · doi:10.1016/j.xinn.2024.100596 · Cited by 48
Intelligent Sensing Technologies Based on Flexible Wearable Sensors: A Review
Nong, H., Jin, M., Pan, C., Zhou, H., Zhang, C., Pan, X., Chen, Y., Wei, X., Lu, Y., Zhao, K., et al. (2024) · IEEE Sensors Journal · doi:10.1109/jsen.2024.3405173 · Cited by 48
“The lookup table approach [140] has been employed for material recognition based on flexible sensors.”
MethodFabrication and application of biocompatible nanogenerators
Wang, Y., Zeng, Q., He, L., Yin, P., Sun, Y., Hu, W., & Yang, R. (2021) · iScience · doi:10.1016/j.isci.2021.102274 · Cited by 47
“…and wearable electronics, biocompatible materials received increasing attention and different biocompatible nanogenerators were fabricated (Askari et al., 2018a; Chen et al., 2019b; He et al., 2018; Hwang et al., 2015; Parida et al., 2019; Song et al., 2019; Sun et al., 2017; Zou et al., 2020).”
BackgroundSelf-citationZeng, J., Zhao, J., Li, C., Qi, Y., Liu, G., Fu, X., Zhou, H., & Zhang, C. (2022) · Sensors · doi:10.3390/s22030975 · Cited by 45
“[58] 10 × 10 mm PTFE Pressure: output current 15.”
Deep learning-assisted object recognition with hybrid triboelectric-capacitive tactile sensor
Xie, Y., Cheng, H., Yuan, C., Zheng, L., Peng, Z., & Meng, B. (2024) · Microsystems & Nanoengineering · doi:10.1038/s41378-024-00813-2 · Cited by 42
Peddigari, M., Woo, K., Kim, S., Kwak, M. S., Jeong, J. W., Kang, J.-H., Lee, S., Park, J. H., Park, K., Annapureddy, V., et al. (2021) · Nano Energy · doi:10.1016/j.nanoen.2021.106598 · Cited by 42
Wang, N., Xia, Z., Yang, S., Pan, J., Lei, T., Qiao, W., & Wu, L. (2023) · Composites Part B Engineering · doi:10.1016/j.compositesb.2023.110928 · Cited by 42
Decoupled approaches for multimodal flexible sensor systems
Hou, Y., Xu, Y., Cai, Z., Wu, H., Li, Y., Shen, Z., Xie, H., & Xu, K. (2025) · Nano Research · doi:10.26599/nr.2025.94907673 · Cited by 42
Self-citationBiomimetic multimodal tactile sensing enables human-like robotic perception
Li, S., Wu, T., Xu, J., Huang, Y., Zhang, Z., Zhao, H., Xu, Q., Wang, Z., Ye, L., Yang, Y., et al. (2026) · Nature Sensors · doi:10.1038/s44460-025-00006-y · Cited by 70
“27–29).”
Self-citationTrends in Graphene-Based E-Skin and Artificial Intelligence for Biomedical Applications—A Review
Mudhulu, S., Manjunatha, C., Balaji, S., Khosla, A., & Sekhar, P. K. (2023) · IEEE Sensors Journal · doi:10.1109/jsen.2023.3294297 · Cited by 43
“Further, they also synthesized successfully an e-skin made of graphene/PDMS composite that resembled a sponge and showed superior sensitivity to variations in pressure and temperature [84].”
BackgroundZhu, L., Wang, Y., Mei, D., Zhang, L., Mu, C., Wang, S., Dai, S., & Chen, Z. (2021) · Advanced Intelligent Systems · doi:10.1002/aisy.202100118 · Cited by 43
Self-citationFlexible temperature sensors based on two-dimensional materials for wearable devices
Lim, S., & Suk, J. W. (2022) · Journal of Physics D Applied Physics · doi:10.1088/1361-6463/acaf38 · Cited by 42
“ance between the interlocked structures [251].”
Manipulating Hetero‐Nanowire Films for Flexible and Multifunctional Thermoelectric Devices
Chen, C., Xu, F., Wu, Y., Li, X., Xu, J., Zhao, B., He, Z., Yang, J., Zhang, W., & Liu, J. (2024) · Advanced Materials · doi:10.1002/adma.202400020 · Cited by 43
Yoon, K., Lee, S., Kwon, C., Won, C., Cho, S., Lee, S.-M., Lee, M., Lee, J., Lee, H., Jang, K., et al. (2024) · Advanced Functional Materials · doi:10.1002/adfm.202407759 · Cited by 43
Yang, Q., Li, B., Wang, M., Pang, G., Lu, Y., Li, J., Yang, H., Lyu, H., Xu, K., & Yang, G. (2025) · Advanced Materials · doi:10.1002/adma.202508795 · Cited by 51
A High Sensitivity Self-Powered Wind Speed Sensor Based on Triboelectric Nanogenerators (TENGs)
Liu, Y., Liu, J., & Che, L. (2021) · Sensors · doi:10.3390/s21092951 · Cited by 38
Xu, J. L., Sun, X., Sun, B., Zhu, H. S., Fan, X., Guo, Q., Li, Y., Zhu, Z., & Qian, K. (2023) · ACS Applied Materials & Interfaces · doi:10.1021/acsami.3c07857 · Cited by 37
Biomimetic Multimodal Receptors for Comprehensive Artificial Human Somatosensory System
Chen, C., Xu, J., Wang, Q., Li, X., Xu, F., Gao, Y., Zhu, Y., Wu, H., & Liu, J. (2024) · Advanced Materials · doi:10.1002/adma.202313228 · Cited by 37
Self-citationLee, D., Kim, I., & Kim, D. (2020) · Nano Energy · doi:10.1016/j.nanoen.2020.105696 · Cited by 38
Cheng, C.-Y., Chiang, Y.-J., Yu, H., Hsiao, L., Yeh, C.-L., Chang, L., Ho, K., & Yeh, M. (2021) · Nano Energy · doi:10.1016/j.nanoen.2021.106575 · Cited by 37
Self-Powered Sensors: New Opportunities and Challenges from Two-Dimensional Nanomaterials
Lee, E. K., & Yoo, H. (2021) · Molecules · doi:10.3390/molecules26165056 · Cited by 36
Advances in Functionalized Applications of Graphene‐Based Wearable Sensors in Healthcare
Akter, M., Anik, H. R., Tushar, S. I., Tania, I. S., Chowdhury, M. K. H., Hasan, M., & Bristy, B. F. (2023) · Advanced Sensor Research · doi:10.1002/adsr.202300120 · Cited by 38
Pao, Y.-P., Yu, C., Lin, Y.-Z., Chatterjee, S., Saha, S., Tiwari, N., Huang, Y.-T., Wu, C., Choi, D., & Lin, Z. (2021) · Nano Energy · doi:10.1016/j.nanoen.2021.106008 · Cited by 36
3D spring-based piezoelectric energy generator
Su, Y., Li, Q., Amagat, J., & Chen, M. (2021) · Nano Energy · doi:10.1016/j.nanoen.2021.106578 · Cited by 36
“They are reported for various advanced applications, for example, artificial muscles [36], sensors [37 – 39], micromotor [40,41], and energy harvester [42,43].”
BackgroundMultifunctional Prussian blue/graphene ink for flexible biosensors and supercapacitors
Ma, J., Cui, Z., Du, Y., Xu, Q., Deng, Q., & Zhu, N. (2021) · Electrochimica Acta · doi:10.1016/j.electacta.2021.138496 · Cited by 35
Shang, K., He, C., Zhou, J. P., Peng, L., Lu, X., Fu, C., Zhang, Y., Tang, C. L., Qian, L., & Yang, T. (2023) · Chemical Engineering Journal · doi:10.1016/j.cej.2023.146279 · Cited by 34
Innovations in self-powered sensors utilizing light, thermal, and mechanical renewable energy
Ahn, J., Cho, S., Wu, L., Li, X., Lee, D., Ha, J., Ha, J., Lee, K., Kang, B., Kwon, Y., et al. (2024) · Nano Energy · doi:10.1016/j.nanoen.2024.110045 · Cited by 36
Yang, L., Liu, Q., Li, M., Liu, Y., Li, X., Liu, Q., Zhu, T., Lü, Y., Liu, X., & Wang, D. (2024) · Sensors and Actuators B Chemical · doi:10.1016/j.snb.2024.136778 · Cited by 35
Metadata
- Authors
- Wang, Y., Wu, H., Xu, L., Zhang, H., Yang, Y., & Wang, Z. L.
- Affiliations
- Chinese Academy of Sciences (CN)
- Guangxi University (CN)
- Georgia Institute of Technology (US)
- Corresponding author
- Yang, Ya
- Wang, Zhong Lin
- Venue
- Science Advances
- Published
- 2020-08-21
- Volume
- 6
- Issue
- 34
- Pages
- eabb9083-eabb9083
- ISSN
- 2375-2548 (ISSN-L)
- PMC
- PMC7438107
- OpenAlex
- W3054245704
- Semantic Scholar
- 483f9ded75cb353f8b1dc5127642c06282245fe2
- Cited by
- 425
- References
- 40
- Citations by year
- 2026: 37 · 2025: 62 · 2024: 85 · 2023: 78 · 2022: 82 · 2021: 75 · 2020: 6
- FWCI
- 18.93
- Type
- journal article
- Language
- en
- Open access
- gold
- doi.org
- Licence
- Locations
- Science Advances (publishedVersion, cc-by)
- PubMed Central (publishedVersion, cc-by)
- PubMed (publishedVersion)
- Topics
- Physical Sciences › Engineering › Biomedical Engineering › Advanced Sensor and Energy Harvesting Materials
- Physical Sciences › Engineering › Mechanical Engineering › Advanced Materials and Mechanics
- Physical Sciences › Engineering › Electrical and Electronic Engineering › Nanomaterials and Printing Technologies
- Keywords
- self-powered sensors, flexible sensors, hydrophobic films, pressure sensing, temperature sensing, thermoelectric effect, material identification, wearable devices, hierarchy
About these checks
Registry, retraction, Cites and statistics results are computed, not judged, with one exception: a printed reference that no index lists is read once by a model before it counts as a citation error. Claims are extracted by a model and kept only when their quote appears verbatim in the text; each cited source is then checked, with a model’s help, for whether it says what the claim relies on. Those verdicts can be wrong — read the claim’s quote and the cited source before relying on one.
Statistics and arithmetic are recomputed, not judged.
Confidence bands are shown only for fields calibrated on our annotated test set. None is calibrated yet, so no band is shown.
What counts as a claim ›How we measure confidence ›How we check this ›
Are you an author, or do you see a problem with this page? Request a review
Data sources
Bibliographic data: Semantic Scholar, OpenAlex, Crossref.
Contains information from the Semantic Scholar Academic Graph Datasets, made available under the ODC Attribution License (ODC-BY 1.0).
Semantic Scholar’s data is described in: Kinney, R., et al. (2023). The Semantic Scholar Open Data Platform. arXiv:2301.10140.
