

The DOI matches its Crossref record; 86 of the 86 references it cites were found in a registry or an index; 23 of the 32 sources its claims cite were checked for support.
Evidence of scaling advantage for the quantum approximate optimization algorithm on a classically intractable problem
Open accessAbstract
The quantum approximate optimization algorithm (QAOA) is a leading candidate algorithm for solving optimization problems on quantum computers. However, the potential of QAOA to tackle classically intractable problems remains unclear. Here, we perform an extensive numerical investigation of QAOA on the low autocorrelation binary sequences (LABS) problem, which is classically intractable even for moderately sized instances. We perform noiseless simulations with up to 40 qubits and observe that the runtime of QAOA with fixed parameters scales better than branch-and-bound solvers, which are the state-of-the-art exact solvers for LABS. The combination of QAOA with quantum minimum finding gives the best empirical scaling of any algorithm for the LABS problem. We demonstrate experimental progress in executing QAOA for the LABS problem using an algorithm-specific error detection scheme on Quantinuum trapped-ion processors. Our results provide evidence for the utility of QAOA as an algorithmic component that enables quantum speedups.
Overview
CoChat Summary
TL;DR
This paper reports noiseless-simulation evidence that constant-depth QAOA scales better than the best-known classical solvers on the low autocorrelation binary sequences (LABS) problem, and that adding quantum minimum finding improves the scaling further. It also demonstrates a hardware step on Quantinuum trapped-ion processors, where symmetry-based error detection improved measured performance.
Key findings
- In noiseless simulations, QAOA at depth \(p=12\) has time-to-solution (TTS) scaling of \(1.46^N\), and QAOA combined with quantum minimum finding (“QAOA+QMF”) scales as \(1.21^N\).
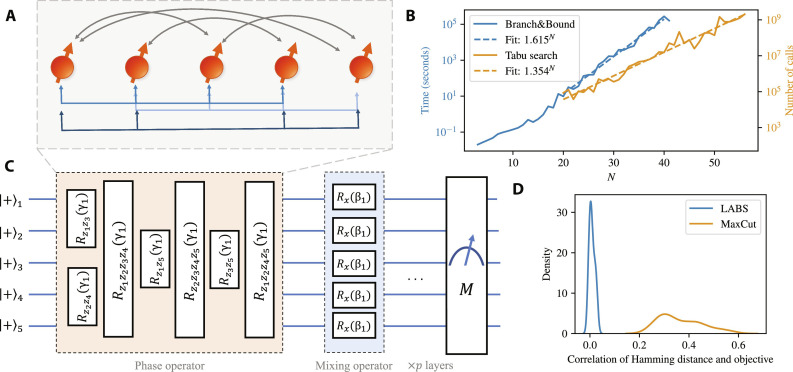
- The best-known classical heuristic benchmarked in the paper, Memetic Tabu, scales as \(1.35^N\) with a 95% confidence interval of \((1.33, 1.38)\); commercial branch-and-bound with an optimality stop rule scales as \(1.615^N\) for Gurobi with 95% CI \((1.571, 1.659)\).
- The paper reports \(R^2 > 0.94\) for the QAOA TTS fit when using only sizes \(N \ge 28\).
- On trapped-ion hardware, using up to three parity checks reduced the difference between experimental results and noiseless simulation by 54% on average and up to 65% for specific \(N\); in all cases, the optimal bitstring was found within the total sample, and in all but two cases within the postselected sample.
Methods
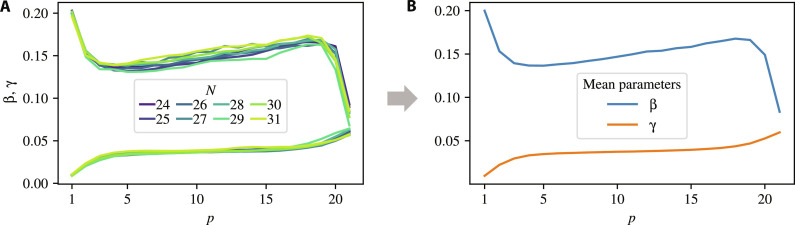
- The study targets the LABS problem, encoded as a diagonal Hamiltonian; QAOA is run with fixed parameters \((\beta,\gamma)\) chosen by optimizing small instances and then averaging/rescaling them for larger \(N\) (using \(24 \le N_j \le 31\), \(M=8\)).
- Numerical results come from exact noiseless simulations up to 40 qubits on the Polaris supercomputer; the main analysis fits exponential scaling of TTS versus problem size and compares it to branch-and-bound and Memetic Tabu.
- For the hardware study, the authors ran \(p=1\) QAOA circuits on Quantinuum H-series trapped-ion processors for instances up to \(N=18\), with an algorithm-specific symmetry-verification error-detection scheme using parity checks and postselection.
Limitations
- The paper states that the numerical scaling evidence is obtained only up to \(N \le 40\); it also notes that TTS can only be evaluated where the solution is known, which for LABS is up to 66 variables.
- The authors say the hardware experiments were limited to \(p=1\), and that implementing QAOA for LABS instances hard for classical solvers would likely require error correction; they estimate a two-qubit gate count of \(\approx 7.5 \times 10^5\) already at \(N=67\) and \(p=12\).
- Evident from the text: the main scaling claim is based on noiseless simulation with fixed, non-optimized parameters for larger instances, so the result is evidence from an idealized setting rather than a demonstrated end-to-end hardware speedup.
Model-written summary. Check it against the paper before relying on it.
Integrity signals
Registry
Cites
Statistics
Figures


Verification
Claims the paper makes
14 Valid · 7 Not valid · 1 Not checked · 36 Own results and interpretations
The cited sources that could be checked couldn’t confirm or dispute this claim.
In the paper
“A recent numerical study (13) of random 8-SAT with N ≤ 20 variables has shown that the time to solution (TTS) of QAOA with fixed parameters and constant depth grows as 1.23N.”
§ Evidence of scaling advantage for the quantum approximate optimization algorithm on a classically intractable problem > INTRODUCTION
What the sources say
- Could not verifycites [13] sourceExperimental — accuracy not yet measured
The quantum approximate optimization algorithm section reports fixed-depth QAOA results for self-avoiding walks, not random 8-SAT. Searches for 8-SAT, time to solution, and the 1.23^N scaling found no passage addressing the attributed result; the paper gives no page numbers in our copy. (LLM, conf=0.76)
plainstates an association- Asserted: passes — The authors put it forward as true.
- Checkable: passes — It can be checked against evidence.
- Load-bearing: passes — The paper’s conclusions depend on it.
- Based: passes — The paper gives a reason why it holds.
- Could not verify
The cited sources support only part of this claim — read each source’s verdict below.
In the paper
“First, the complexity of LABS grows rapidly, with optimal solutions known only for N ≤ 66 and the best heuristics producing approximate solutions of quality decaying with N for N200 (20, 21).”
§ Evidence of scaling advantage for the quantum approximate optimization algorithm on a classically intractable problem > INTRODUCTION
What the sources say
- Not matchedcites [20]
Couldn’t be matched to a paper in Crossref, so it can’t be checked.
- Supportedcites [21] source
In “What is known” (p. 2), the paper says its exact algorithms solved LABS up to N ≤ 66. “Results and Conclusions” (p. 11) confirms that the authors computed all maximum-merit-factor sequences through N = 66 and describes solving larger systems as future work. (LLM, conf=0.93)
plain- Asserted: passes — The authors put it forward as true.
- Checkable: passes — It can be checked against evidence.
- Load-bearing: passes — The paper’s conclusions depend on it.
- Based: passes — The paper gives a reason why it holds.
- Not matched
The cited sources support only part of this claim — read each source’s verdict below.
In the paper
“Second, the performance of classical solvers for LABS has been benchmarked (20, 21) in terms of the scaling of their TTS with problem size.”
§ Evidence of scaling advantage for the quantum approximate optimization algorithm on a classically intractable problem > INTRODUCTION
What the sources say
- Not matchedcites [20]
Couldn’t be matched to a paper in Crossref, so it can’t be checked.
- Supportedcites [21] source
Section 3.1 (pp. 6, 9) compares the running-time scaling of classical branch-and-bound approaches as LABS sequence length N increases. Section 4 (p. 11) also reports performance measurements across problem sizes, supporting the claim's description of benchmarking time to solution. (LLM, conf=0.90)
plainstates an association- Asserted: passes — The authors put it forward as true.
- Checkable: passes — It can be checked against evidence.
- Load-bearing: passes — The paper’s conclusions depend on it.
- Based: passes — The paper gives a reason why it holds.
- Not matched
The cited sources that could be checked couldn’t confirm or dispute this claim.
In the paper
“When QAOA is combined with amplitude amplification, the quantum TTS grows as 1.11N (13), whereas the best classical heuristic has TTS that grows as 1.25N (13).”
§ Evidence of scaling advantage for the quantum approximate optimization algorithm on a classically intractable problem > INTRODUCTION
What the sources say
- Could not verifycites [13] sourceExperimental — accuracy not yet measured
In “The quantum approximate optimization algorithm” (page unavailable), the paper compares QAOA with amplitude amplification for self-avoiding walks; it does not report their combined time to solution. Searches for random 8-SAT and the 1.11^N and 1.25^N scaling figures found no passage addressing those claims. (LLM, conf=0.76)
plainstates a cause- Asserted: passes — The authors put it forward as true.
- Checkable: passes — It can be checked against evidence.
- Load-bearing: passes — The paper’s conclusions depend on it.
- Based: passes — The paper gives a reason why it holds.
- Could not verify
The cited sources support only part of this claim — read each source’s verdict below.
In the paper
“First, the complexity of LABS grows rapidly, with optimal solutions known only for N ≤ 66 and the best heuristics producing approximate solutions of quality decaying with N for N200 (20, 21).”
§ Evidence of scaling advantage for the quantum approximate optimization algorithm on a classically intractable problem > INTRODUCTION
What the sources say
- Not matchedcites [20]
Couldn’t be matched to a paper in Crossref, so it can’t be checked.
- Supportedcites [21] source
Section 2, “What is known” (p. 3), reports a significant drop in the best-known merit factors for N > 200 and attributes it to sophisticated search heuristics failing on larger LABS problems. This supports the claim that heuristic solution quality declines beyond that size. (LLM, conf=0.94)
plainstates an association- Asserted: passes — The authors put it forward as true.
- Checkable: passes — It can be checked against evidence.
- Load-bearing: passes — The paper’s conclusions depend on it.
- Based: passes — The paper gives a reason why it holds.
- Not matched
32 more claims · 7 with their cited sources checked
Create a free account to see all 58 claims and every source verdict.
- Probably not a substantial claim. 6
- It may state two separate claims as one. 16
Claims other papers make about this one
Each is checked against this paper’s own text: does it say what the citing paper says it does?
The cited source says what the claim attributes to it.
In the citing paper
“Data for different solvers are collected up to different maximum problem sizes and are truncated appropriately to mitigate finite-size effects11,12.”
From Evidence of scaling advantage on an NP-complete problem with enhanced quantum solvers (2026) · cites this paper as [12]
The cited source says what the claim attributes to it.
In the citing paper
“Throughout this work, we adopt a fixed-parameter protocol to enhance the reliability of the scaling analysis11,12.”
From Evidence of scaling advantage on an NP-complete problem with enhanced quantum solvers (2026) · cites this paper as [12]
Citations
Cites
Glover, F., & Laguna, M. (1997) · doi:10.1007/978-1-4615-6089-0 · Cited by 3,001 · cited 1×
“…algorithm is used to find initializations for tabu search, a metaheuristic that augments local neighborhood search with a data structure (known as the tabu list) that filters possible local moves if the potential solutions have been recently visited or diversification rules are violated (48).”
MethodA Quantum Approximate Optimization Algorithm
Farhi, E., Goldstone, J., & Gutmann, S. (2014) · arXiv · doi:10.48550/arxiv.1411.4028 · Cited by 1,789
Quantum amplitude amplification and estimation
Brassard, G., Høyer, P., Mosca, M., & Tapp, A. (2002) · Contemporary Mathematics · doi:10.1090/conm/305/05215 · Cited by 1,680 · cited 1×
“(44)) .”
The BOBYQA algorithm for bound constrained optimization without derivatives
Powell, M. J. D. (2009) · Cited by 1,094
Zhou, L., Wang, S.-T., Choi, S., Pichler, H., & Lukin, M. D. (2020) · Physical Review X · doi:10.1103/physrevx.10.021067 · Cited by 913
Synthesis of low-peak-factor signals and binary sequences with low autocorrelation (Corresp.)
Schroeder, M. (1970) · IEEE Transactions on Information Theory · doi:10.1109/tit.1970.1054411 · Cited by 740 · cited 1×
“We study the scaling of QAOA TTS with the problem size on the Low Autocorrelation Binary Sequences (LABS) problem (15, 16), also known as the Bernasconi model in statistical physics (17, 18).”
MethodDemonstration of the trapped-ion quantum CCD computer architecture
Pino, J. M., Dreiling, J. M., Figgatt, C., Gaebler, J. P., Moses, S. A., Allman, M. S., Baldwin, C. H., Foss-Feig, M., Hayes, D., Mayer, K., et al. (2021) · Nature · doi:10.1038/s41586-021-03318-4 · Cited by 547 · cited 5×
“As a first step toward execution of QAOA for the LABS problem, we implement QAOA on Quantinuum trapped-ion quantum processors (26, 27) on problems with up to N = 18.”
BackgroundMethodInfluentialSelf-citationt|ket⟩: a retargetable compiler for NISQ devices
Sivarajah, S., Dilkes, S., Cowtan, A., Simmons, W., Edgington, A., & Duncan, R. (2021) · Quantum Science and Technology · doi:10.1088/2058-9565/ab8e92 · Cited by 475
A Race-Track Trapped-Ion Quantum Processor
Moses, S. A., Baldwin, C. H., Allman, M. S., Ancona, R., Ascarrunz, L., Barnes, C., Bartolotta, J., Bjork, B., Blanchard, P., Bohn, M., et al. (2023) · Physical Review X · doi:10.1103/physrevx.13.041052 · Cited by 391 · cited 6×
“As a first step toward execution of QAOA for the LABS problem, we implement QAOA on Quantinuum trapped-ion quantum processors (26, 27) on problems with up to N = 18.”
BackgroundMethodInfluentialSelf-citationA Quantum Algorithm for Finding the Minimum
Durr, C., & Hoyer, P. (1996) · arXiv · doi:10.48550/arxiv.quant-ph/9607014 · Cited by 359
Research works printed but not linked: 3
- J. Basso E. Farhi K. Marwaha B. Villalonga L. Zhou The quantum approximate optimization algorithm at high depth for MaxCut on large-girth regular graphs and the Sherrington–Kirkpatrick model in Proceedings of the Conference on the Theory of Quantum Computation Communication and Cryptography (Schloss Dagstuhl – Leibniz-Zentrum für Informatik 2022) pp. 7:1–7:21.
- G. F. M. Beenker, T. A. C. M. Claasen, P. W. C. Hermens, Binary sequences with a maximally flat amplitude spectrum. Philips J. Res. 40, 289–304 (1985).
- F. Brglez X. Y. Li M. F. Stallmann B. Militzer Reliable cost predictions for finding optimal solutions to labs problem: Evolutionary and alternative algorithms in Proceedings of The Fifth International Workshop on Frontiers in Evolutionary Algorithms (FEA’2003) under JCIS’2003 (2003).
Cited by
Challenges and opportunities in quantum optimization
Abbas, A., Ambainis, A., Augustino, B., Bärtschi, A., Buhrman, H., Coffrin, C., Cortiana, G., Dunjko, V., Egger, D. J., Elmegreen, B. G., et al. (2024) · Nature Reviews Physics · doi:10.1038/s42254-024-00770-9 · Cited by 201
“Still, combining Grover Search with other quantum or classical algorithms can lead to an overall quadratic speedup in specific cases 209 .”
Alexeev, Y., Amsler, M., Barroca, M. A., Bassini, S., Battelle, T., Camps, D., Casanova, D., Choi, Y. J., Chong, F. T., Chung, C., et al. (2024) · Future Generation Computer Systems · doi:10.1016/j.future.2024.04.060 · Cited by 140
Self-citationQuantum Optimization: Potential, Challenges, and the Path Forward
Abbas, A., (NNSA), U. N. N. S. A., Ambainis, A., Augustino, B., Bärtschi, A., Buhrman, H., Coffrin, C., Cortiana, G., Dunjko, V., Egger, D., et al. (2023) · OSTI OAI (U.S. Department of Energy Office of Scientific and Technical Information) · doi:10.2172/2229681 · Cited by 67
Constrained optimization via quantum Zeno dynamics
Herman, D., Shaydulin, R., Sun, Y., Chakrabarti, S., Hu, S., Minssen, P., Rattew, A. G., Yalovetzky, R., & Pistoia, M. (2023) · Communications Physics · doi:10.1038/s42005-023-01331-9 · Cited by 64
“While these algorithms are often discussed as promising approaches for noisy near-term devices [5, 6], many results supporting their potential are analytically derived or numerically demonstrated in the fault-tolerant regime [7–9].”
BackgroundSelf-citationQuantum-enhanced greedy combinatorial optimization solver
Dupont, M., Evert, B., Hodson, M. J., Sundar, B., Jeffrey, S., Yamaguchi, Y., Feng, D., Maciejewski, F. B., Hadfield, S., Alam, M. S., et al. (2023) · Science Advances · doi:10.1126/sciadv.adi0487 · Cited by 56
Metadata
- Authors
- Shaydulin, R., Li, C., Chakrabarti, S., DeCross, M., Herman, D., Kumar, N., Larson, J., Lykov, D., Minssen, P., Sun, Y., Alexeev, Y., Dreiling, J. M., Gaebler, J. P., Gatterman, T. M., Gerber, J. A., Gilmore, K., Gresh, D., Hewitt, N., Horst, C. V., Hu, S., Johansen, J., Matheny, M., Mengle, T., Mills, M., Moses, S. A., Neyenhuis, B., Siegfried, P., Yalovetzky, R., & Pistoia, M.
- Affiliations
- JPMorgan Chase & Co (United States) (US)
- Quantinuum (United States) (US)
- Argonne National Laboratory (US)
- Corresponding author
- Shaydulin, Ruslan
- ORCID
- Shaydulin, Ruslan
- Li, Changhao
- Chakrabarti, Shouvanik
- DeCross, Matthew
- Herman, Dylan
- Kumar, Niraj
- Larson, Jeffrey
- Lykov, Danylo
- Minssen, Pierre
- Sun, Yue
- Alexeev, Yuri
- Dreiling, Joan M.
- Gaebler, John P.
- Gatterman, Thomas M.
- Gerber, Justin A.
- Gilmore, Kevin
- Hewitt, Nathan
- Horst, Chandler V.
- Hu, Shaohan
- Matheny, Mitchell
- Mills, Michael
- Moses, Steven A.
- Neyenhuis, Brian
- Siegfried, Peter
- Yalovetzky, Romina
- Pistoia, Marco
- Venue
- Science Advances
- Published
- 2024-05-31
- Volume
- 10
- Issue
- 22
- Pages
- eadm6761-eadm6761
- ISSN
- 2375-2548 (ISSN-L)
- PMC
- PMC11135426
- OpenAlex
- W4399118343
- Cited by
- 120
- References
- 85
- Citations by year
- 2026: 32 · 2025: 58 · 2024: 23
- FWCI
- 16.61
- Type
- journal article
- Language
- en
- Open access
- gold
- doi.org
- Licence
- cc-by
- Locations
- Science Advances (publishedVersion, cc-by)
- PubMed Central (publishedVersion, cc-by)
- PubMed (publishedVersion)
- arXiv (Cornell University) (submittedVersion)
- OSTI OAI (U.S. Department of Energy Office of Scientific and Technical Information) (submittedVersion)
- arXiv (Cornell University)
- Funders
- U.S. Department of Energy (DE‐ AC02‐06CH11357, AC02‐06CH11357, 06CH11357, DE-AC02-)
- Office of Science (AC02‐06CH11357, DE-AC02, 06CH11357, DE-AC02-06CH11357)
- Advanced Scientific Computing Research (DE-AC02-06CH11357)
- Argonne National Laboratory
- Topics
- Physical Sciences › Computer Science › Artificial Intelligence › Quantum Computing Algorithms and Architecture
- Physical Sciences › Physics and Astronomy › Atomic and Molecular Physics, and Optics › Quantum Information and Cryptography
- Physical Sciences › Physics and Astronomy › Atomic and Molecular Physics, and Optics › Quantum many-body systems
- Keywords
- quantum approximate optimization algorithm, low autocorrelation binary sequences, quantum advantage, branch and bound comparison, error detection, trapped-ion quantum computer
About these checks
Registry, retraction, Cites and statistics results are computed, not judged, with one exception: a printed reference that no index lists is read once by a model before it counts as a citation error. Claims are extracted by a model and kept only when their quote appears verbatim in the text; each cited source is then checked, with a model’s help, for whether it says what the claim relies on. Those verdicts can be wrong — read the claim’s quote and the cited source before relying on one.
The claim verdicts this report counts are experimental: their accuracy is not yet measured.
A language model drew the claims from the paper on 2026-10-10, under version 3 of the claim definition (model deepseek-v4.1-flash, prompt extract-v3).
A second model labelled each claim on 2026-10-10 (model jev-1.13-20260917, definition revision gold-guideline-v0.2).
Cited sources are checked with a language model’s help (gpt-6-sol).
Statistics and arithmetic are recomputed, not judged.
Confidence bands are shown only for fields calibrated on our annotated test set. None is calibrated yet, so no band is shown.
What counts as a claim ›How we measure confidence ›How we check this ›
Are you an author, or do you see a problem with this page? Request a review
Data sources
Bibliographic data: Semantic Scholar, OpenAlex, Crossref.
Contains information from the Semantic Scholar Academic Graph Datasets, made available under the ODC Attribution License (ODC-BY 1.0).
Semantic Scholar’s data is described in: Kinney, R., et al. (2023). The Semantic Scholar Open Data Platform. arXiv:2301.10140.
