

The DOI matches its Crossref record; 36 of the 36 references it cites were found in a registry or an index.
Antigenic cartography of SARS-CoV-2 reveals that Omicron BA.1 and BA.2 are antigenically distinct
Open accessAbstract
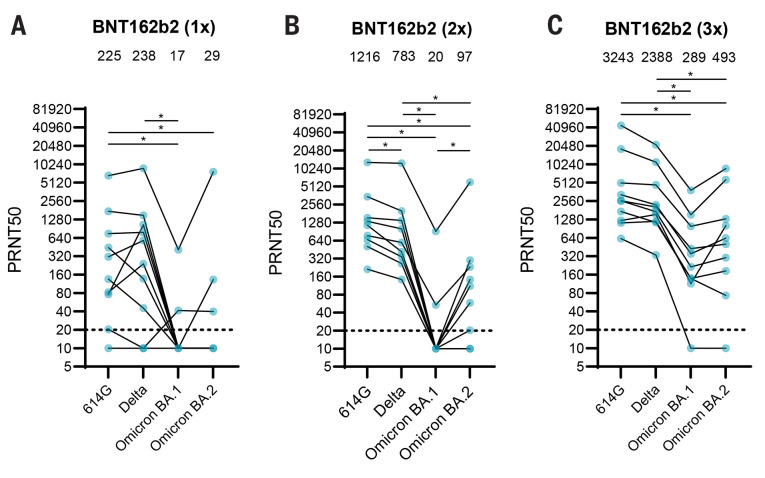
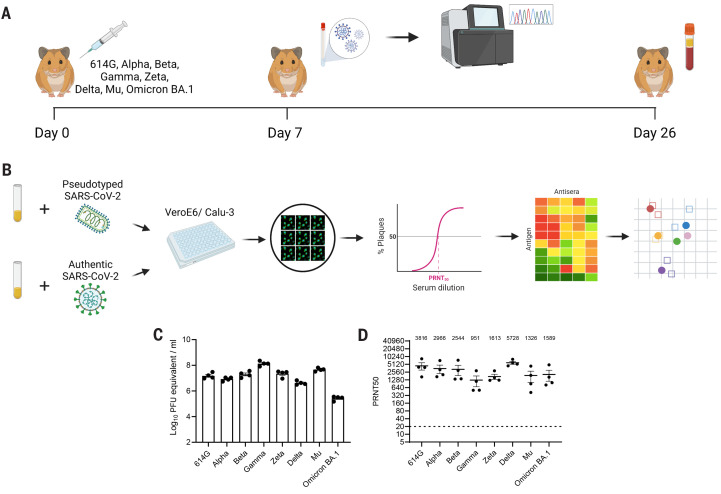
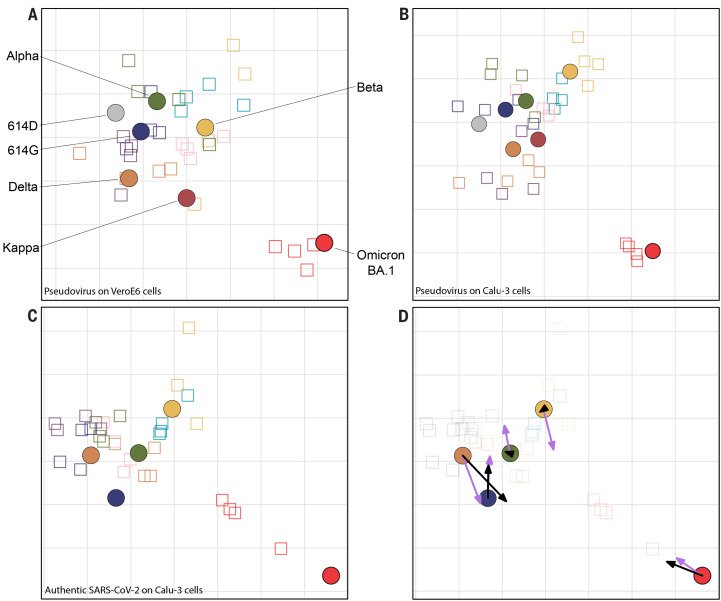
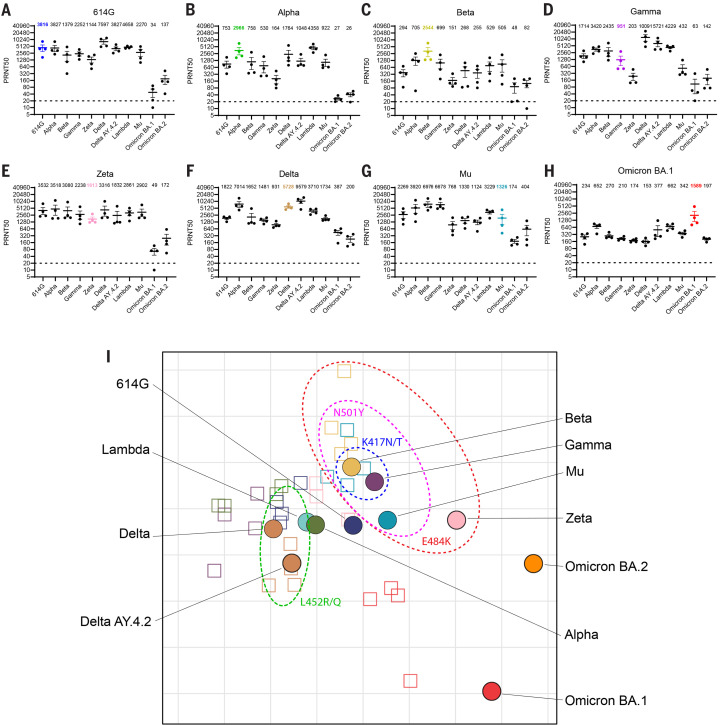
The emergence and rapid spread of SARS-CoV-2 variants may affect vaccine efficacy substantially. The Omicron variant termed BA.2, which differs substantially from BA.1 based on genetic sequence, is currently replacing BA.1 in several countries, but its antigenic characteristics have not yet been assessed. Here, we used antigenic cartography to quantify and visualize antigenic differences between early SARS-CoV-2 variants (614G, Alpha, Beta, Gamma, Zeta, Delta, and Mu) using hamster antisera obtained after primary infection. We first verified that the choice of the cell line for the neutralization assay did not affect the topology of the map substantially. Antigenic maps generated using pseudo-typed SARS-CoV-2 on the widely used VeroE6 cell line and the human airway cell line Calu-3 generated similar maps. Maps made using authentic SARS-CoV-2 on Calu-3 cells also closely resembled those generated with pseudo-typed viruses. The antigenic maps revealed a central cluster of SARS-CoV-2 variants, which grouped on the basis of mutual spike mutations. Whereas these early variants are antigenically similar, clustering relatively close to each other in antigenic space, Omicron BA.1 and BA.2 have evolved as two distinct antigenic outliers. Our data show that BA.1 and BA.2 both escape vaccine-induced antibody responses as a result of different antigenic characteristics. Thus, antigenic cartography could be used to assess antigenic properties of future SARS-CoV-2 variants of concern that emerge and to decide on the composition of novel spike-based (booster) vaccines.
Overview
The claims and statistics of this paper haven’t been checked yet.
Run the check — free, no account needed. It reads the open-access text and checks the sources it cites.
Integrity signals
Registry
Cites
Statistics
Figures
Verification
Claims the paper makes
The claims and statistics of this paper haven’t been checked yet.
Run the check — free, no account needed. It reads the open-access text and checks the sources it cites.
Claims other papers make about this one
Each is checked against this paper’s own text: does it say what the citing paper says it does?
In the citing paper
“These two population groups primed by different antigens will likely have different antibody responses as the sera of individuals primed by pre-Omicron variants or vaccines poorly neutralize the Omicron BA.1/2 variant and vice versa 26,27 .”
From Rapidly shifting immunologic landscape and severity of SARS-CoV-2 in the Omicron era in South Africa (2023) · cites this paper as [27]
Self-check
Percentages, sums and reported differences re-computed from the paper’s own numbers.
The self-check needs the paper’s full text.
Citations
Cites
Detection of 2019 novel coronavirus (2019-nCoV) by real-time RT-PCR
Corman, V. M., Landt, O., Kaiser, M., Molenkamp, R., Meijer, A., Chu, D. K. W., Bleicker, T., Brünink, S., Schneider, J. A., Schmidt, M. L., et al. (2020) · Eurosurveillance · doi:10.2807/1560-7917.es.2020.25.3.2000045 · Cited by 7,266
Self-citationKorber, B., Fischer, W. M., Gnanakaran, S., Yoon, H., Theiler, J., Abfalterer, W., Hengartner, N., Giorgi, E. E., Bhattacharya, T., Foley, B., et al. (2020) · Cell · doi:10.1016/j.cell.2020.06.043 · Cited by 4,281
Detection of a SARS-CoV-2 variant of concern in South Africa
Tegally, H., Wilkinson, E., Giovanetti, M., Iranzadeh, A., Fonseca, V., Giandhari, J., Doolabh, D., Pillay, S., San, E. J., Msomi, N., et al. (2021) · Nature · doi:10.1038/s41586-021-03402-9 · Cited by 2,510
Reduced sensitivity of SARS-CoV-2 variant Delta to antibody neutralization
Planas, D., Veyer, D., Baidaliuk, A., Staropoli, I., Guivel-Benhassine, F., Rajah, M. M., Planchais, C., Porrot, F., Robillard, N., Puech, J., et al. (2021) · Nature · doi:10.1038/s41586-021-03777-9 · Cited by 1,992
Mapping the Antigenic and Genetic Evolution of Influenza Virus
Smith, D. J., Lapedes, A. S., de Jong, J. C., Bestebroer, T. M., Rimmelzwaan, G. F., Osterhaus, A. D. M. E., & Fouchier, R. A. M. (2004) · Science · doi:10.1126/science.1097211 · Cited by 1,868
Self-citationSARS-CoV-2 productively infects human gut enterocytes
Lamers, M. M., Beumer, J., van der Vaart, J., Knoops, K., Puschhof, J., Breugem, T. I., Ravelli, R. B. G., Paul van Schayck, J., Mykytyn, A. Z., Duimel, H. Q., et al. (2020) · Science · doi:10.1126/science.abc1669 · Cited by 1,573
Self-citationConsiderable escape of SARS-CoV-2 Omicron to antibody neutralization
Planas, D., Saunders, N., Maes, P., Guivel-Benhassine, F., Planchais, C., Buchrieser, J., Bolland, W.-H., Porrot, F., Staropoli, I., Lemoine, F., et al. (2022) · Nature · doi:10.1038/s41586-021-04389-z · Cited by 1,514
SARS-CoV-2 B.1.617.2 Delta variant replication and immune evasion
Mlcochova, P., Kemp, S. A., Dhar, M. S., Papa, G., Meng, B., Ferreira, I. A. T. M., Datir, R., Collier, D. A., Albecka, A., Singh, S., et al. (2021) · Nature · doi:10.1038/s41586-021-03944-y · Cited by 1,337
Cele, S., Jackson, L., Khoury, D. S., Khan, K., Moyo-Gwete, T., Tegally, H., San, J. E., Cromer, D., Scheepers, C., Amoako, D., et al. (2021) · doi:10.1101/2021.12.08.21267417 · Cited by 1,333
Pathogenesis and transmission of SARS-CoV-2 in golden hamsters
Sia, S. F., Yan, L.-M., Chin, A. W. H., Fung, K., Choy, K.-T., Wong, A. Y. L., Kaewpreedee, P., Perera, R. A. P. M., Poon, L. L. M., Nicholls, J. M., et al. (2020) · Nature · doi:10.1038/s41586-020-2342-5 · Cited by 1,303
Research works printed but not linked: 1
- 10.1038/s41586-021-04387-1 · DOI · Paper page
Cited by
Sorted by citations
Mapping SARS-CoV-2 antigenic relationships and serological responses
Wilks, S. H., Mühlemann, B., Shen, X., Türeli, S., LeGresley, E. B., Netzl, A., Caniza, M. A., Chacaltana-Huarcaya, J. N., Corman, V. M., Daniell, X. G., et al. (2023) · Science · doi:10.1126/science.adj0070 · Cited by 134
Self-citationImpact of antigenic evolution and original antigenic sin on SARS-CoV-2 immunity
Aguilar-Bretones, M., Fouchier, R. A. M., Koopmans, M., & van Nierop, G. P. (2023) · Journal of Clinical Investigation · doi:10.1172/jci162192 · Cited by 108
Self-citationvan der Straten, K., Guerra, D., van Gils, M. J., Bontjer, I., Caniels, T. G., van Willigen, H. D. G., Wynberg, E., Poniman, M., Burger, J. A., Bouhuijs, J. H., et al. (2022) · Immunity · doi:10.1016/j.immuni.2022.07.018 · Cited by 125
Population immunity predicts evolutionary trajectories of SARS-CoV-2
Meijers, M., Ruchnewitz, D., Eberhardt, J., Łuksza, M., & Lässig, M. (2023) · Cell · doi:10.1016/j.cell.2023.09.022 · Cited by 102
BA.2 and BA.5 omicron differ immunologically from both BA.1 omicron and pre-omicron variants
Rössler, A., Netzl, A., Knabl, L., Schäfer, H., Wilks, S., Bante, D., Falkensammer, B., Borena, W., von Laer, D., Smith, D. J., et al. (2022) · Nature Communications · doi:10.1038/s41467-022-35312-3 · Cited by 78
Self-citationImmunogenicity of the mRNA-1273 COVID-19 vaccine in adult patients with inborn errors of immunity
van Leeuwen, L. P. M., GeurtsvanKessel, C. H., Ellerbroek, P. M., de Bree, G. J., Potjewijd, J., Rutgers, A., Jolink, H., van de Veerdonk, F. L., Gorp, E. C. M. V., de Wilt, F., et al. (2022) · Journal of Allergy and Clinical Immunology · doi:10.1016/j.jaci.2022.04.002 · Cited by 67
Self-citationWang, W., Lusvarghi, S., Subramanian, R., Epsi, N. J., Wang, R., Goguet, E., Fries, A. C., Echegaray, F., Vassell, R. A., Coggins, S. A., et al. (2022) · Cell Host & Microbe · doi:10.1016/j.chom.2022.10.012 · Cited by 59
Wang, W., Lusvarghi, S., Subramanian, R., Epsi, N. J., Wang, R., Goguet, E., Fries, A. C., Echegaray, F., Vassell, R., Coggins, S., et al. (2022) · doi:10.1101/2022.07.05.498883 · Cited by 68
Antigenic mapping of emerging SARS-CoV-2 omicron variants BM.1.1.1, BQ.1.1, and XBB.1
Mykytyn, A. Z., Rosu, M. E., Kok, A., Rissmann, M., van Amerongen, G., GeurtsvanKessel, C. H., de Vries, R. D., Munnink, B. B. O., Smith, D. J., Koopmans, M., et al. (2023) · The Lancet Microbe · doi:10.1016/s2666-5247(22)00384-6 · Cited by 65
Self-citationCantoni, D. M., Wilkie, C., Bentley, E. M., Neto, M. M., Wright, E., Scott, S. D., Ray, S., Castillo‐Olivares, J., Heeney, J. L., Mattiuzzo, G., et al. (2023) · Frontiers in Immunology · doi:10.3389/fimmu.2023.1184362 · Cited by 56
Mykytyn, A. Z., Breugem, T. I., Geurts, M. H., Beumer, J., Schipper, D., van Acker, R., van den Doel, P. B., van Royen, M. E., Zhang, J., Clevers, H. C., et al. (2023) · Journal of Virology · doi:10.1128/jvi.00851-23 · Cited by 62
Self-citationRosenke, K., Lewis, M. C., Feldmann, F., Bohrnsen, E., Schwarz, B. H., Okumura, A., Bohler, F., Callison, J. A., Shaia, C., Bosio, C. M., et al. (2022) · JCI Insight · doi:10.1172/jci.insight.166485 · Cited by 46
When to update COVID-19 vaccine composition
Grant, R., Sacks, J. A., Abraham, P., Chunsuttiwat, S., Cohen, C., Figueroa, J. P., Fleming, T. R., Fine, P., Goldblatt, D., Hasegawa, H., et al. (2023) · Nature Medicine · doi:10.1038/s41591-023-02220-y · Cited by 47
Rapidly shifting immunologic landscape and severity of SARS-CoV-2 in the Omicron era in South Africa
Sun, K., Tempia, S., Kleynhans, J., von Gottberg, A., McMorrow, M. L., Wolter, N., Bhiman, J. N., Moyes, J., Carrim, M., Martinson, N. A., et al. (2023) · Nature Communications · doi:10.1038/s41467-022-35652-0 · Cited by 45
Rössler, A., Netzl, A., Knabl, L., Bante, D., Wilks, S. H., Borena, W., von Laer, D., Smith, D. J., & Kimpel, J. (2023) · Nature Communications · doi:10.1038/s41467-023-41049-4 · Cited by 42
Self-citationTan, C. W., Zhu, F., Chia, W. N., Young, B. E., Yeoh, A. Y.-Y., Althaus, T., Yung, C. F., Yap, W. C., Lim, B. L., Chen, M. I.-C., et al. (2023) · hLife · doi:10.1016/j.hlife.2023.07.002 · Cited by 42
Omicron BA.1 and BA.2 neutralizing activity elicited by a comprehensive panel of human vaccinesPreprint
Bowen, J. E., Sprouse, K. R., Walls, A. C., Mazzitelli, I. G., Logue, J. K., Franko, N., Ahmed, K., Ansari, A. S., Cameroni, E., Gori, A., et al. (2022) · bioRxiv (Cold Spring Harbor Laboratory) · doi:10.1101/2022.03.15.484542 · Cited by 38
Classification of five SARS-CoV-2 serotypes based on RBD antigenicities
Hu, S., Wu, C., Wu, X., Ma, X., Shu, C., Chen, Q., Zheng, A., Yang, H., Lü, J., Du, P., et al. (2023) · 中国科学通报:英文版 · doi:10.1016/j.scib.2023.09.048 · Cited by 40
Strohl, W. R., Ku, Z., An, Z., Carroll, S. F., Keyt, B. A., & Strohl, L. M. (2022) · BioDrugs · doi:10.1007/s40259-022-00529-7 · Cited by 35
Antigenic evolution of SARS coronavirus 2
Mykytyn, A. Z., Fouchier, R. A. M., & Haagmans, B. L. (2023) · Current Opinion in Virology · doi:10.1016/j.coviro.2023.101349 · Cited by 36
Self-citationTan, N. H., Geers, D., Sablerolles, R. S. G., Rietdijk, W. J. R., Goorhuis, A., Postma, D. F., Visser, L. G., Bogers, S., van Dijk, L. L. A., Gommers, L., et al. (2023) · The Lancet Infectious Diseases · doi:10.1016/s1473-3099(23)00140-8 · Cited by 37
Self-citationDifferent Neutralization Profiles After Primary SARS-CoV-2 Omicron BA.1 and BA.2 Infections
Medits, I., Springer, D. N., Graninger, M., Camp, J. V., Höltl, E., Aberle, S. W., Traugott, M. T., Hoepler, W., Deutsch, J., Lammel, O., et al. (2022) · Frontiers in Immunology · doi:10.3389/fimmu.2022.946318 · Cited by 37
Springer, D. N., Perkmann, T., Jani, C. M., Mucher, P., Prüger, K., Marculescu, R., Reuberger, E., Camp, J. V., Graninger, M., Borsodi, C., et al. (2022) · Microbiology Spectrum · doi:10.1128/spectrum.02129-22 · Cited by 34
Muik, A., Lui, B. G., Bacher, M., Wallisch, A.-K., Toker, A., Cadima-Couto, Í., Güler, A., Mampilli, V., Schmitt, G. J., Mottl, J., et al. (2022) · Science Immunology · doi:10.1126/sciimmunol.ade9888 · Cited by 36
Cheng, S. M., Mok, C. K. P., Chan, K. C., Ng, S. S., Lam, B. H., Luk, L. L., Ko, F. W., Chen, C., Yiu, K., Li, J. K., et al. (2022) · Eurosurveillance · doi:10.2807/1560-7917.es.2022.27.18.2200178 · Cited by 31
Immune Evasion of SARS-CoV-2 Omicron Subvariants
Ke, H., Chang, M., & Marasco, W. A. (2022) · Vaccines · doi:10.3390/vaccines10091545 · Cited by 29
Fantini, J., Azzaz, F., Chahinian, H., & Yahi, N. (2023) · Viruses · doi:10.3390/v15020284 · Cited by 30
Structural and functional characteristics of the SARS-CoV-2 Omicron subvariant BA.2 spike protein
Zhang, J., Tang, W., Gao, H., Lavine, C. L., Shi, W. K., Peng, H., Zhu, H., Anand, K., Kosikova, M., Kwon, H. J., et al. (2023) · Nature Structural & Molecular Biology · doi:10.1038/s41594-023-01023-6 · Cited by 29
Leung, D., Duque, J. S. R., Yip, K. M., So, H., Wong, W. H. S., & Lau, Y. (2023) · Communications Medicine · doi:10.1038/s43856-022-00233-1 · Cited by 26
Wickenhagen, A., Flagg, M., Port, J. R., Yinda, C. K., Goldin, K., Gallogly, S., Schulz, J. E., Lutterman, T. R., Williamson, B. N., Kaiser, F. K., et al. (2025) · Nature Communications · doi:10.1038/s41467-025-55938-3 · Cited by 28
Li, Q., Zhang, M., Liang, Z., Zhang, L., Wu, X., Yang, C., An, Y., Tong, J., Liu, S., Li, T., et al. (2022) · MedComm · doi:10.1002/mco2.130 · Cited by 26
An updated framework for SARS-CoV-2 variants reflects the unpredictability of viral evolution
Subissi, L., Otieno, J. R., Worp, N., Cohen, H. A., Munnink, B. B. O., Abu-Raddad, L. J., Alm, E., Barakat, A., Barclay, W., Bhiman, J. N., et al. (2024) · Nature Medicine · doi:10.1038/s41591-024-02949-0 · Cited by 25
Self-citationAntigenic distance between primary and secondary dengue infections correlates with disease risk
Wang, L., Huang, A. T., Katzelnick, L. C., Lefrancq, N., Escoto, A. C., Duret, L., Chowdhury, N., Jarman, R. G., Conte, M. A., Berry, I. M., et al. (2024) · Science Translational Medicine · doi:10.1126/scitranslmed.adk3259 · Cited by 25
Hogan, A. B., Wu, S. L., Toor, J., Mesa, D. O., Doohan, P., Watson, O. J., Winskill, P., Charles, G. D., Barnsley, G., Riley, E. M., et al. (2023) · PLoS Medicine · doi:10.1371/journal.pmed.1004195 · Cited by 27
Netzl, A., Türeli, S., LeGresley, E. B., Mühlemann, B., Wilks, S., & Smith, D. J. (2022) · bioRxiv (Cold Spring Harbor Laboratory) · doi:10.1101/2021.12.31.474032 · Cited by 25
Self-citationOmicron BA.2 Lineage, the “Stealth” Variant: Is It Truly a Silent Epidemic? A Literature Review
Tiecco, G., Storti, S., Arsuffi, S., Degli-Antoni, M., Focà, E., Castelli, F., & Quiros-Roldan, E. (2022) · International Journal of Molecular Sciences · doi:10.3390/ijms23137315 · Cited by 21
Clinical development of variant-adapted BNT162b2 COVID-19 vaccines: the early Omicron era
Pather, S., Muik, A., Rizzi, R., & Mensa, F. (2023) · Expert Review of Vaccines · doi:10.1080/14760584.2023.2232851 · Cited by 23
Petráš, M., Máčalík, R., Janovská, D., Čelko, A. M., Dáňová, J., Selinger, E., Doleček, J., Neradová, S., Franklová, M., Dlouhý, P., et al. (2022) · BMC Medicine · doi:10.1186/s12916-022-02663-z · Cited by 23
Mühlemann, B., Trimpert, J., Walper, F., Schmidt, M. L., Jansen, J., Schroeder, S., Jeworowski, L. M., Beheim-Schwarzbach, J., Bleicker, T., Niemeyer, D., et al. (2024) · Proceedings of the National Academy of Sciences · doi:10.1073/pnas.2310917121 · Cited by 17
Self-citationOriginal COVID-19 priming regimen impacts the immunogenicity of bivalent BA.1 and BA.5 boosters
Zaeck, L. M., Tan, N. H., Rietdijk, W. J. R., Geers, D., Sablerolles, R. S. G., Bogers, S., van Dijk, L. L. A., Gommers, L., van Leeuwen, L. P. M., Rugebregt, S., et al. (2024) · Nature Communications · doi:10.1038/s41467-024-48414-x · Cited by 18
Self-citationYang, H. J., Hong, W., Shi, H., He, C., Hong, L., Zhou, Y., Yang, H., Alu, A., Chen, Z., Yang, Y., et al. (2024) · Nature Communications · doi:10.1038/s41467-024-55087-z · Cited by 18
COVID-19 vaccines versus pediatric hospitalization
Duque, J. S. R., Leung, D., Yip, K. M., Lee, D. H., So, H., Wong, W. H. S., & Lau, Y. (2023) · Cell Reports Medicine · doi:10.1016/j.xcrm.2023.100936 · Cited by 17
Beukenhorst, A. L., Koch, C. M., Hadjichrysanthou, C., Alter, G., de Wolf, F., Anderson, R. M., & Goudsmit, J. (2023) · European Journal of Epidemiology · doi:10.1007/s10654-023-00965-x · Cited by 18
Kassardjian, A., Sun, E., Sookhoo, J. R. V., Muthuraman, K., Boligan, K. F., Kucharska, I., Rujas, E., Jetha, A., Branch, D. R., Babiuk, S., et al. (2023) · Cell Reports · doi:10.1016/j.celrep.2023.112391 · Cited by 17
Neerukonda, S. N., Wang, R., Vassell, R. A., Baha, H., Lusvarghi, S., Liu, S., Wang, T. T., Weiss, C. D., & Wang, W. (2022) · Journal of Virology · doi:10.1128/jvi.01140-22 · Cited by 16
Debes, A. K., Xiao, S., Egbert, E. R., Caturegli, P., Gadala, A., Colantuoni, E., Sitaras, I., Pekosz, A. S., & Milstone, A. M. (2022) · Microbiology Spectrum · doi:10.1128/spectrum.02046-22 · Cited by 16
Miyamoto, S., Arashiro, T., Ueno, A., Kanno, T., Saito, S., Katano, H., Iida, S., Ainai, A., Ozono, S., Hemmi, T., et al. (2023) · iScience · doi:10.1016/j.isci.2023.105969 · Cited by 13
Yang, W., Liu, R., Yan, J. R., Xie, Y., Wang, C., Jiang, M., Li, P., & Du, L. (2023) · Biosensors and Bioelectronics · doi:10.1016/j.bios.2023.115358 · Cited by 16
SARS-CoV-2 variant of concern fitness and adaptation in primary human airway epithelia
Meganck, R. M., Edwards, C. E., Mallory, M. L., Lee, R. E., Dang, H., Bailey, A. B., Wykoff, J. A., Gallant, S. C., Zhu, D. R., Yount, B. L., et al. (2024) · Cell Reports · doi:10.1016/j.celrep.2024.114076 · Cited by 17
Is the time right for systematically serotyping SARS-related coronaviruses?
Tan, C. W., & Wang, L. (2024) · hLife · doi:10.1016/j.hlife.2023.12.007 · Cited by 16
Pradenas, E., Marfil, S., Urrea, V., Trigueros, M., Pidkova, T., Pons-Grífols, A., Ortiz, R., Rovirosa, C., Tarrés-Freixas, F., Aguilar‐Gurrieri, C., et al. (2023) · iScience · doi:10.1016/j.isci.2023.106457 · Cited by 16
Omicron breakthrough infections in vaccinated or previously infected hamsters
Zhou, J., Sukhova, K., McKay, P. F., Kurshan, A., Yau, Y., Lechmere, T., Brown, J. C., Moshe, M., Kugathasan, R., Snell, L. B., et al. (2023) · Proceedings of the National Academy of Sciences · doi:10.1073/pnas.2308655120 · Cited by 15
Jung, S.-M., Loo, S. L., Howerton, E., Contamin, L., Smith, C. P., Carcelén, E. C., Yan, K., Bents, S. J., Levander, J. D., Espino, J. U., et al. (2024) · PLoS Medicine · doi:10.1371/journal.pmed.1004387 · Cited by 15
Mühlemann, B., Wilks, S. H., Baracco, L., Bekliz, M., Carreño, J. M., Corman, V. M., Davis-Gardner, M. E., Dejnirattisai, W., Diamond, M., Douek, D. C., et al. (2024) · Science Translational Medicine · doi:10.1126/scitranslmed.adl1722 · Cited by 19
Self-citationSARS-CoV-2 Omicron: Viral Evolution, Immune Evasion, and Alternative Durable Therapeutic Strategies
Guo, H., Ha, S., Botten, J., Xu, K. Y., Zhang, N., An, Z., Strohl, W. R., Shiver, J. W., & Fu, T. (2024) · Viruses · doi:10.3390/v16050697 · Cited by 19
Yu, X., Yang, W. J., Li, W., Wan, N., Yan, G., Zhou, Z., Zhu, X. M., Su, W., Li, Y., Xing, C., et al. (2024) · hLife · doi:10.1016/j.hlife.2024.01.005 · Cited by 13
SARS-CoV-2 serotyping based on spike antigenicity and its implications for host immune evasion
Ruan, W., Gao, P., Qu, X., Jiang, J., Zhao, Z., Qiao, S., Zhang, H., Yang, T., Li, D., Du, P., et al. (2025) · EBioMedicine · doi:10.1016/j.ebiom.2025.105634 · Cited by 13
Yang, W., Yan, J. R., Liu, R., Xie, Y., Wang, C., Kou, Z., Li, P., & Jiang, M. (2023) · Sensors and Actuators B Chemical · doi:10.1016/j.snb.2023.133785 · Cited by 12
Revolutionizing SARS-CoV-2 omicron variant detection: Towards faster and more reliable methods
Li, D., Sun, C., Zhuang, P., & Mei, X. (2023) · Talanta · doi:10.1016/j.talanta.2023.124937 · Cited by 14
Hadjichrysanthou, C., Beukenhorst, A. L., Koch, C. M., Alter, G., Goudsmit, J., Anderson, R. M., & de Wolf, F. (2022) · Infectious Diseases and Therapy · doi:10.1007/s40121-022-00710-z · Cited by 12
Ad26.COV2.S priming provided a solid immunological base for mRNA-based COVID-19 booster vaccination
Geers, D., Sablerolles, R. S. G., van Baarle, D., Kootstra, N. A., Rietdijk, W. J. R., Schmitz, K. S., Gommers, L., Bogers, S., Nieuwkoop, N. J., van Dijk, L. L. A., et al. (2022) · iScience · doi:10.1016/j.isci.2022.105753 · Cited by 12
Self-citationCheng, S. M. S., Mok, C. K. P., Li, J. K. C., Chan, K. P., Luk, K. S., Lee, B. H. W., Gu, H., Chan, K., Tsang, L. C. H., Yiu, K. Y. S., et al. (2024) · Virology Journal · doi:10.1186/s12985-024-02335-9 · Cited by 12
Chao, C.-H., Cheng, D., Huang, S., Chuang, Y., Yeh, T., & Wang, J. (2022) · Frontiers in Immunology · doi:10.3389/fimmu.2022.1023943 · Cited by 11
Omicron infection increases IgG binding to spike protein of predecessor variants
Mahalingam, G., Periyasami, Y., Arjunan, P., Subaschandrabose, R. K., Mathivanan, T. V., Mathew, R. S., Devi, R., Premkumar, P. S., Muliyil, J., Srivastava, A., et al. (2022) · Journal of Medical Virology · doi:10.1002/jmv.28419 · Cited by 11
Schröder, S., Richter, A. M., Veith, T., Emanuel, J., Gudermann, L., Friedmann, K., Jeworowski, L. M., Mühlemann, B., Jones, T. C., Müller, M. A., et al. (2023) · Virology Journal · doi:10.1186/s12985-023-02154-4 · Cited by 9
Wang, W., Bhushan, G. L., Paz, S., Stauft, C. B., Selvaraj, P., Goguet, E., Bishop‐Lilly, K. A., Subramanian, R., Vassell, R. A., Lusvarghi, S., et al. (2024) · Journal of Virology · doi:10.1128/jvi.00948-24 · Cited by 10
Suntronwong, N., Kanokudom, S., Duangchinda, T., Chantima, W., Pakchotanon, P., Klinfueng, S., Puenpa, J., Thatsanathorn, T., Wanlapakorn, N., & Poovorawan, Y. (2025) · Scientific Reports · doi:10.1038/s41598-024-84138-0 · Cited by 10
Coombes, N. S., Bewley, K. R., Duff, Y. L., Hurley, M., Smith, L. J., Weldon, T. M., Osman, K. L., Pullan, S. T., Berry, N. J., Hallis, B., et al. (2023) · Viruses · doi:10.3390/v15030633 · Cited by 10
Port, J. R., Yinda, C. K., Riopelle, J. C., Weishampel, Z. A., Saturday, T. A., Avanzato, V. A., Schulz, J. E., Holbrook, M. G., Barbian, K., Perry-Gottschalk, R., et al. (2023) · Nature Communications · doi:10.1038/s41467-023-42346-8 · Cited by 13
Hong, W., Hong, L., Peng, D., Huang, Y., He, C., Yang, H. J., Zhou, Y., Liu, J., Pan, X., Que, H., et al. (2024) · MedComm · doi:10.1002/mco2.539 · Cited by 10
Resch, M. D., Wen, K., Mazboudi, R., Maasz, H. M., Persaud, M., Garvey, K., Gallardo, L., Gottlieb, P., Alimova, A., Khayat, R., et al. (2022) · Vaccines · doi:10.3390/vaccines10121997 · Cited by 10
Brazer, N., Morris, M. K., Servellita, V., Anglin, K., Saldhi, P., Garcia-Knight, M., Bethancourt, S., Sotomayor-González, A., Wang, B., Foresythe, A., et al. (2022) · The Journal of Infectious Diseases · doi:10.1093/infdis/jiac384 · Cited by 9
Aguilar-Bretones, M., den Hartog, Y., van Dijk, L. L. A., Malahe, S. R. K., Dieterich, M., Mora, H. T., Mueller, Y. M., Koopmans, M., Reinders, M. E. J., Baan, C. C., et al. (2024) · npj Vaccines · doi:10.1038/s41541-024-00886-0 · Cited by 8
Self-citationEinhauser, S., Asam, C., Weps, M., Senninger, A., Peterhoff, D., Bauernfeind, S., Asbach, B., Carnell, G., Heeney, J. L., Wytopil, M., et al. (2024) · EBioMedicine · doi:10.1016/j.ebiom.2024.105438 · Cited by 9
Tan, N. H., Sablerolles, R. S. G., Rietdijk, W. J. R., Goorhuis, A., Postma, D. F., Visser, L. G., Bogers, S., Geers, D., Zaeck, L. M., Koopmans, M., et al. (2022) · Frontiers in Immunology · doi:10.3389/fimmu.2022.1067749 · Cited by 9
Self-citationden Hartog, Y., Malahe, S. R. K., Rietdijk, W. J. R., Dieterich, M., Gommers, L., Geers, D., Bogers, S., van Baarle, D., Diavatopoulos, D. A., Messchendorp, A. L., et al. (2023) · npj Vaccines · doi:10.1038/s41541-023-00664-4 · Cited by 8
Self-citationFrancis, M. E., Jansen, E. B., Yourkowski, A., Selim, A., Swan, C. L., MacPhee, B. K., Thivierge, B. M., Buchanan, R. M., Lavender, K. J., Darbellay, J., et al. (2023) · Nature Communications · doi:10.1038/s41467-023-41761-1 · Cited by 10
Antibody Response after SARS-CoV-2 Infection with the Delta and Omicron Variant
Błaszczuk, A., Michalski, A., Sikora, D., Malm, M., Drop, B., & Polz‐Dacewicz, M. (2022) · Vaccines · doi:10.3390/vaccines10101728 · Cited by 9
Impact of Reinfection with SARS-CoV-2 Omicron Variants in Previously Infected Hamsters
Shiwa-Sudo, N., Sakai, Y., Iwata‐Yoshikawa, N., Watanabe, S., Yamada, S., Kuroda, Y., Yamamoto, T., Shirakura, M., Fujisaki, S., Miyazaki, K., et al. (2023) · Journal of Virology · doi:10.1128/jvi.01366-22 · Cited by 9
Zendt, M., Carrillo, F. A. B., Kelly, S., Saturday, T. A., DeGrange, M., Ginigeme, A., Wu, L., Callier, V., Ortega‐Villa, A. M., Faust, M. T., et al. (2023) · Science Advances · doi:10.1126/sciadv.adh3150 · Cited by 11
Direct comparison of SARS-CoV-2 variant specific neutralizing antibodies in human and hamster sera
Rössler, A., Netzl, A., Knabl, L., Wilks, S., Mühlemann, B., Türeli, S., Mykytyn, A. Z., von Laer, D., Haagmans, B. L., Smith, D. J., et al. (2024) · npj Vaccines · doi:10.1038/s41541-024-00888-y · Cited by 9
Self-citationAstakhova, E. A., Morozov, A. A., Byazrova, M. G., Sukhova, M. M., Mikhailov, A. A., Minnegalieva, A. R., Gorchakov, A. A., & Filatov, A. V. (2023) · International Journal of Molecular Sciences · doi:10.3390/ijms241310493 · Cited by 9
Springer, D. N., Traugott, M. T., Reuberger, E., Kothbauer, K. B., Borsodi, C., Naegeli, M., Oelschlägel, T., Kelani, H., Lammel, O., Deutsch, J., et al. (2023) · Diagnostics · doi:10.3390/diagnostics13132278 · Cited by 7
A Global Collaborative Comparison of SARS-CoV-2 Antigenicity Across 15 Laboratories
Brangel, P., Türeli, S., Mühlemann, B., Liechti, N., Zysset, D., Engler, O. B., Hunger‐Glaser, I., Ghiga, I., Mattiuzzo, G., Eckerle, I., et al. (2024) · Viruses · doi:10.3390/v16121936 · Cited by 8
Self-citationYan, J. R., Yang, W., Liu, R., Xie, Y., Jiang, S., Li, P., Wang, C., Sui, Q., Liu, T., & Jiang, M. (2023) · Journal of Lightwave Technology · doi:10.1109/jlt.2023.3338849 · Cited by 7
McLelland, D. J., Lynch, M., Vogelnest, L., Eden, P. A., Wallace, A. M., Weller, J., Young, S., Vaughan‐Higgins, R., Antipov, A., Honda‐Okubo, Y., et al. (2024) · Journal of Veterinary Pharmacology and Therapeutics · doi:10.1111/jvp.13429 · Cited by 7
Chen, J., Huang, Z., Xiao, J., Du, S., Bu, Q., Guo, H., Ye, J., Chen, S., Gao, J., Li, Z., et al. (2024) · Cell Reports Methods · doi:10.1016/j.crmeth.2024.100856 · Cited by 7
Managing sources of error during pandemics
Cauchemez, S., Bosetti, P., & Cowling, B. J. (2023) · Science · doi:10.1126/science.add3173 · Cited by 7
Diego, J. G.-B., Singh, G., Jangra, S., Handrejk, K., Laporte, M., Chang, L. A., Zahed, S. S. E., Pache, L., Chang, M. W., Warang, P., et al. (2024) · PLoS Pathogens · doi:10.1371/journal.ppat.1011805 · Cited by 8
Changes in serum-neutralizing antibody potency and breadth post-SARS-CoV-2 mRNA vaccine boost
Nair, M. S., Ribeiro, R. M., Wang, M., Bowen, A. D., Liu, L., Guo, Y., Chang, J. Y., Wang, P., Sheng, Z., Sobieszczyk, M. E., et al. (2023) · iScience · doi:10.1016/j.isci.2023.106345 · Cited by 5
Port, J. R., Yinda, C. K., Riopelle, J. C., Weishampel, Z. A., Saturday, T. A., Avanzato, V. A., Schulz, J. E., Holbrook, M. G., Barbian, K., Perry-Gottschalk, R., et al. (2022) · bioRxiv (Cold Spring Harbor Laboratory) · doi:10.1101/2022.07.29.502072 · Cited by 6
Wang, W., Bhushan, G. L., Paz, S., Stauft, C. B., Selvaraj, P., Goguet, E., Bishop‐Lilly, K. A., Subramanian, R., Vassell, R. A., Lusvarghi, S., et al. (2024) · bioRxiv (Cold Spring Harbor Laboratory) · doi:10.1101/2024.04.05.588359 · Cited by 6
Marvelde, M. R. T., Mykytyn, A. Z., Kroeze, E. J. B. V., Bouffier, A., van Eck—Schipper, D., van den Doel, P., Handrejk, K., Koel, B. F., Rissmann, M., & Haagmans, B. L. (2026) · npj Vaccines · doi:10.1038/s41541-025-01348-x · Cited by 6
Self-citationMapping antibody footprints using binding profiles
Azulay, A., Cohen-Lavi, L., Friedman, L. M., McGargill, M. A., & Hertz, T. (2023) · Cell Reports Methods · doi:10.1016/j.crmeth.2023.100566 · Cited by 5
Oyebanji, O. A., Sundheimer, N., Ragavapuram, V., Wilson, B. M., Abul, Y., Gravenstein, S., Bosch, J., King, C. L., & Canaday, D. H. (2024) · GeroScience · doi:10.1007/s11357-024-01215-y · Cited by 5
Breugem, T. I., Riesebosch, S., Schipper, D., Mykytyn, A. Z., van den Doel, P., Segalés, J., Lamers, M. M., & Haagmans, B. L. (2024) · npj Viruses · doi:10.1038/s44298-024-00054-0 · Cited by 6
Self-citationJia, T., Wang, F., Chen, Y., Liao, G., Xu, Q., Chen, J., Wu, J., Li, N., Wang, L., Yuan, L., et al. (2024) · Journal of Infection · doi:10.1016/j.jinf.2024.106362 · Cited by 7
van Beek, J., Teesing, G. R., Munnink, B. B. O., Meima, A., Vriend, H. J., Elzakkers, J., de Graaf, M., Langeveld, J., Medema, G. J., Molenkamp, R., et al. (2022) · PLoS ONE · doi:10.1371/journal.pone.0276696 · Cited by 5
Self-citationExploring geometry of genome space via Grassmann manifolds
Li, X., Zhou, T., Feng, X., Yau, S., & Yau, S. S. ‐. (2024) · The Innovation · doi:10.1016/j.xinn.2024.100677 · Cited by 6
Metadata
- Authors
- Mykytyn, A. Z., Rissmann, M., Kok, A., Rosu, M. E., Schipper, D., Breugem, T. I., van den Doel, P. B., Chandler, F., Bestebroer, T., de Wit, M., van Royen, M. E., Molenkamp, R., Oude Munnink, B. B., de Vries, R. D., GeurtsvanKessel, C., Smith, D. J., Koopmans, M. P. G., Rockx, B., Lamers, M. M., Fouchier, R. A. M., & Haagmans, B. L.
- Affiliations
- Erasmus MC (NL)
- Viroscience Department, Erasmus Medical Center, Rotterdam, Netherlands.
- Department of Neurology, Erasmus University Medical Center, Rotterdam, Netherlands.
- Department of Pathology, Erasmus University Medical Center, Rotterdam, Netherlands.
- University of Cambridge (GB)
- Corresponding author
- Rissmann, Melanie
- Kok, Adinda
- Rosu, Miruna E.
- Haagmans, Bart L.
- ORCID
- Mykytyn, Anna Z.
- Rissmann, Melanie
- Kok, Adinda
- Rosu, Miruna E.
- Schipper, Debby
- Breugem, Tim I.
- van den Doel, Petra B.
- Chandler, Felicity
- de Wit, Maurice
- van Royen, Martin E.
- Molenkamp, Richard
- Oude Munnink, Bas B.
- de Vries, Rory D.
- GeurtsvanKessel, Corine
- Smith, Derek J.
- Koopmans, Marion P. G.
- Rockx, Barry
- Lamers, Mart M.
- Fouchier, Ron A. M.
- Haagmans, Bart L.
- Venue
- Science Immunology
- Published
- 2022-09-30
- Volume
- 7
- Issue
- 75
- Pages
- eabq4450-eabq4450
- ISSN
- 2470-9468 (ISSN-L)
- PMC
- PMC9273038
- OpenAlex
- W4283330057
- Cited by
- 153
- References
- 35
- Citations by year
- 2026: 11 · 2025: 16 · 2024: 43 · 2023: 49 · 2022: 34
- FWCI
- 17.33
- Type
- journal article
- Language
- en
- Open access
- green
- www.ncbi.nlm.nih.gov
- Licence
- cc-by
- Locations
- Science Immunology (publishedVersion)
- PubMed Central (publishedVersion, cc-by)
- PubMed (publishedVersion)
- EUR Research Repository (Erasmus University Rotterdam) (publishedVersion, other-oa)
- EUR Research Repository (Erasmus University Rotterdam) (submittedVersion)
- Apollo (University of Cambridge) (submittedVersion, cc-by)
- Apollo (cc-by)
- Funders
- Health~Holland (EMCLHS20017, LSHM19136)
- European Commission (874735, 101003589, 75N93021C00014)
- ZonMw (10150062010008)
- Erasmus Medisch Centrum
- National Institutes of Health (75N93021C00014, 874735, 101003589)
- National Institute of Allergy and Infectious Diseases (#75N93021C00014, 101003589, 874735)
- Topics
- Health Sciences › Medicine › Infectious Diseases › SARS-CoV-2 and COVID-19 Research
- Life Sciences › Biochemistry, Genetics and Molecular Biology › Molecular Biology › vaccines and immunoinformatics approaches
- Life Sciences › Agricultural and Biological Sciences › Animal Science and Zoology › Animal Virus Infections Studies
- Keywords
- SARS-CoV-2, Omicron BA.1, Omicron BA.2, antigenic cartography, antigenic drift, spike protein mutations, neutralizing antibodies, vaccine escape, spike protein, Calu-3 cells, Vero E6 cells, SARS-CoV-2 variants
- MeSH terms
- COVID-19, SARS-CoV-2, Animals, Cell Line, Cricetinae, Humans, Immune Sera
About these checks
Registry, retraction, Cites and statistics results are computed, not judged, with one exception: a printed reference that no index lists is read once by a model before it counts as a citation error. Claims are extracted by a model and kept only when their quote appears verbatim in the text; each cited source is then checked, with a model’s help, for whether it says what the claim relies on. Those verdicts can be wrong — read the claim’s quote and the cited source before relying on one.
Statistics and arithmetic are recomputed, not judged.
Confidence bands are shown only for fields calibrated on our annotated test set. None is calibrated yet, so no band is shown.
What counts as a claim ›How we measure confidence ›How we check this ›
Are you an author, or do you see a problem with this page? Request a review
