

The DOI matches its Crossref record; 57 of the 57 references it cites were found in a registry or an index.
Molecular dissection of the chromosome partitioning protein RocS and regulation by phosphorylation
Open accessPublished version of a preprint
Abstract
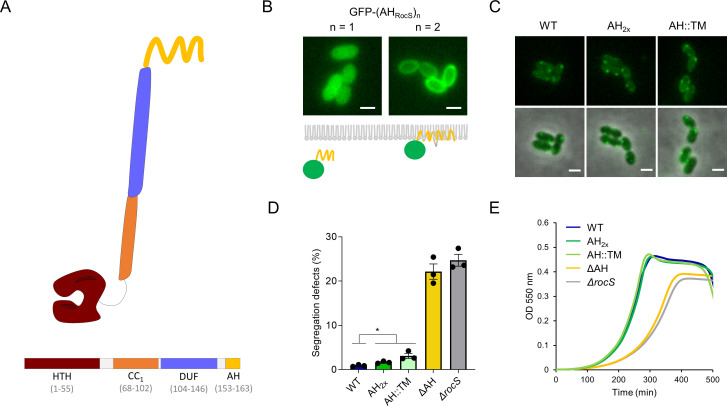
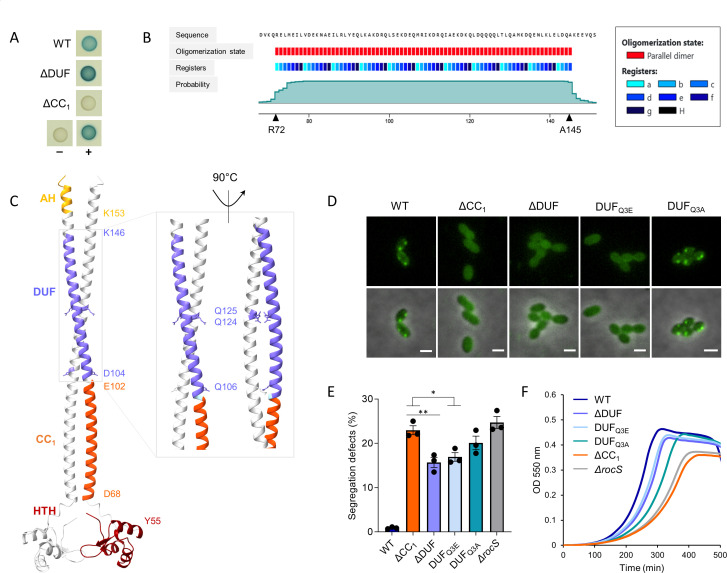
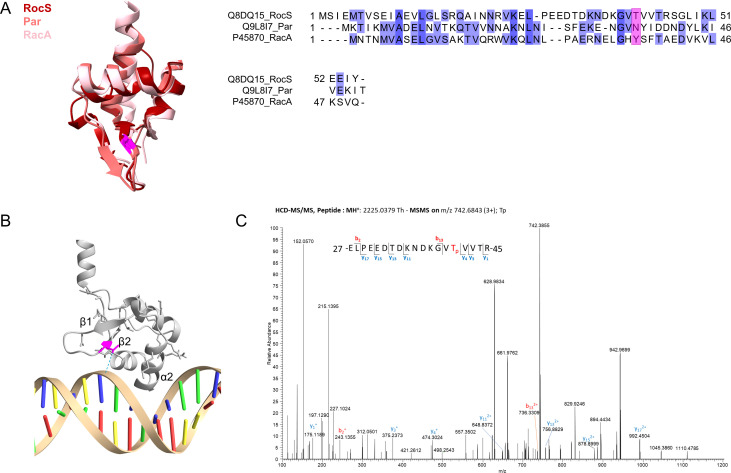
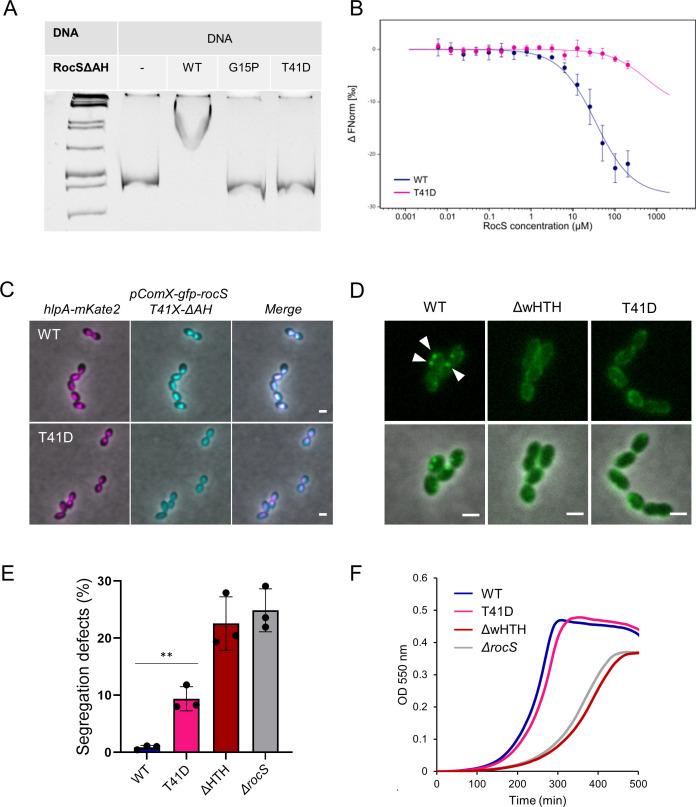
Chromosome segregation in bacteria is a critical process ensuring that each daughter cell receives an accurate copy of the genetic material during cell division. Active segregation factors, such as the ParABS system or SMC complexes, are usually essential for this process, but they are surprisingly dispensable in Streptococcus pneumoniae . Rather, chromosome segregation in S. pneumoniae relies on the protein Regulator of Chromosome Segregation (RocS), although the molecular mechanisms involved remain elusive. By combining genetics, in vivo imaging, and biochemical approaches, we dissected the molecular features of RocS involved in chromosome segregation. We investigated the respective functions of the three RocS domains, specifically the C-terminal amphipathic helix (AH), the N-terminal DNA-binding domain (DBD), and the coiled-coil domain (CCD) separating the AH and the DBD. Notably, we found that a single AH is not sufficient for membrane binding and that RocS requires prior oligomerization to interact with the membrane. We further demonstrated that this self-interaction was driven by the N-terminal part of the CCD. On the other hand, we revealed that the C-terminal part of the CCD corresponds to a domain of unknown function (DUF 536) and is defined by three conserved glutamines, which play a crucial role in RocS-mediated chromosome segregation. Finally, we showed that the DBD is phosphorylated by the unique serine-threonine kinase of S. pneumoniae StkP and that mimicking this phosphorylation abrogated RocS binding to DNA. Overall, this study offers new insights into chromosome segregation in Streptococci and paves the way for a deeper understanding of RocS-like proteins in other bacteria. IMPORTANCE: Bacteria have evolved a variety of mechanisms to properly segregate their genetic material during cell division. In this study, we performed a molecular dissection of the chromosome partitioning protein Regulator of Chromosome Segregation (RocS), a pillar element of chromosome segregation in S. pneumoniae that is also generally conserved in the Streptococcaceae family. Our systematic investigation sheds light on the molecular features required for successful pneumococcal chromosome segregation and the regulation of RocS by phosphorylation. In addition, our study also revealed that RocS shares functional domains with the Par protein, involved in an atypical plasmid segregation system. Therefore, we expect that our findings may serve to extend our understanding of RocS and RocS-like proteins while broadening the repertoire of partitioning systems used in bacteria.
Overview
The claims and statistics of this paper haven’t been checked yet.
Run the check — free, no account needed. It reads the open-access text and checks the sources it cites.
Integrity signals
Registry
Cites
Statistics
Figures
Verification
Claims the paper makes
The claims and statistics of this paper haven’t been checked yet.
Run the check — free, no account needed. It reads the open-access text and checks the sources it cites.
Self-check
Percentages, sums and reported differences re-computed from the paper’s own numbers.
The self-check needs the paper’s full text.
Citations
Cites
MAFFT Multiple Sequence Alignment Software Version 7: Improvements in Performance and Usability
Katoh, K., & Standley, D. M. (2013) · Molecular Biology and Evolution · doi:10.1093/molbev/mst010 · Cited by 46,209
Highly accurate protein structure prediction with AlphaFold
Jumper, J., Evans, R., Pritzel, A., Green, T., Figurnov, M., Ronneberger, O., Tunyasuvunakool, K., Bates, R., Žídek, A., Potapenko, A., et al. (2021) · Nature · doi:10.1038/s41586-021-03819-2 · Cited by 43,764
Accurate structure prediction of biomolecular interactions with AlphaFold 3
Abramson, J., Adler, J., Dunger, J., Evans, R., Green, T., Pritzel, A., Ronneberger, O., Willmore, L., Ballard, A. J., Bambrick, J., et al. (2024) · Nature · doi:10.1038/s41586-024-07487-w · Cited by 15,861
Jalview Version 2—a multiple sequence alignment editor and analysis workbench
Waterhouse, A. M., Procter, J. B., Martin, D. M. A., Clamp, M., & Barton, G. J. (2009) · Bioinformatics · doi:10.1093/bioinformatics/btp033 · Cited by 10,235
UCSF ChimeraX: Structure visualization for researchers, educators, and developers
Pettersen, E. F., Goddard, T. D., Huang, C. C., Meng, E. C., Couch, G. S., Croll, T. I., Morris, J. H., & Ferrin, T. E. (2021) · Protein Science · doi:10.1002/pro.3943 · Cited by 9,514
Pfam: The protein families database in 2021
Mistry, J., Chuguransky, S., Williams, L., Qureshi, M., Salazar, G. A., Sonnhammer, E. L. L., Tosatto, S. C. E., Paladin, L., Raj, S., Richardson, L. J., et al. (2021) · Nucleic Acids Research · doi:10.1093/nar/gkaa913 · Cited by 7,452
Letunic, I., & Bork, P. (2024) · Nucleic Acids Research · doi:10.1093/nar/gkae268 · Cited by 4,497
A bacterial two-hybrid system based on a reconstituted signal transduction pathway
Karimova, G., Pidoux, J., Ullmann, A., & Ladant, D. (1998) · Proceedings of the National Academy of Sciences · doi:10.1073/pnas.95.10.5752 · Cited by 1,661
MicrobeJ, a tool for high throughput bacterial cell detection and quantitative analysis
Ducret, A., Quardokus, E. M., & Brun, Y. V. (2016) · Nature Microbiology · doi:10.1038/nmicrobiol.2016.77 · Cited by 1,010
Self-citationThe many faces of the helix-turn-helix domain: Transcription regulation and beyond
ARAVIND, L., ANANTHARAMAN, V, BALAJI, S., BABU, M., & IYER, L. (2005) · FEMS Microbiology Reviews · doi:10.1016/j.femsre.2004.12.008 · Cited by 700
DALI and the persistence of protein shape
Holm, L. (2020) · Protein Science · doi:10.1002/pro.3749 · Cited by 692
Species–function relationships shape ecological properties of the human gut microbiome
Vieira-Silva, S., Falony, G., Darzi, Y., Lima-Mendez, G., Garcia Yunta, R., Okuda, S., Vandeputte, D., Valles-Colomer, M., Hildebrand, F., Chaffron, S., et al. (2016) · Nature Microbiology · doi:10.1038/nmicrobiol.2016.88 · Cited by 483
Plasmid and chromosome partitioning: surprises from phylogeny
Gerdes, K., Møller‐Jensen, J., & Jensen, R. B. (2000) · Molecular Microbiology · doi:10.1046/j.1365-2958.2000.01975.x · Cited by 435
Jun, S., & Mulder, B. (2006) · Proceedings of the National Academy of Sciences · doi:10.1073/pnas.0605305103 · Cited by 410
An rpsL Cassette, Janus, for Gene Replacement through Negative Selection in Streptococcus pneumoniae
Sung, C. K., Li, H., Claverys, J. P., & Morrison, D. A. (2001) · Applied and Environmental Microbiology · doi:10.1128/aem.67.11.5190-5196.2001 · Cited by 403
Ireton, K., Gunther, N. W., & Grossman, A. D. (1994) · Journal of Bacteriology · doi:10.1128/jb.176.17.5320-5329.1994 · Cited by 363
RacA, a Bacterial Protein That Anchors Chromosomes to the Cell Poles
Ben-Yehuda, S., Rudner, D. Z., & Losick, R. (2003) · Science · doi:10.1126/science.1079914 · Cited by 314
Bordetella pertussis adenylate cyclase: a toxin with multiple talents
Ladant, D., & Ullmann, A. (1999) · Trends in Microbiology · doi:10.1016/s0966-842x(99)01468-7 · Cited by 293
How to get (a)round: mechanisms controlling growth and division of coccoid bacteria
Pinho, M. G., Kjos, M., & Veening, J.-W. (2013) · Nature Reviews Microbiology · doi:10.1038/nrmicro3088 · Cited by 289
Entropy as the driver of chromosome segregation
Jun, S., & Wright, A. (2010) · Nature Reviews Microbiology · doi:10.1038/nrmicro2391 · Cited by 244
Pei, J., & Grishin, N. V. (2013) · Methods in molecular biology · doi:10.1007/978-1-62703-646-7_17 · Cited by 241
MapZ marks the division sites and positions FtsZ rings in Streptococcus pneumoniae
Fleurie, A., Lesterlin, C., Manuse, S., Zhao, C., Cluzel, C., Lavergne, J.-P., Franz‐Wachtel, M., Maček, B., Combet, C., Kuru, E., et al. (2014) · Nature · doi:10.1038/nature13966 · Cited by 219
Self-citationHu, Z., & Lutkenhaus, J. (2003) · Molecular Microbiology · doi:10.1046/j.1365-2958.2003.03321.x · Cited by 197
Wu, L. J., & Errington, J. (2003) · Molecular Microbiology · doi:10.1046/j.1365-2958.2003.03643.x · Cited by 193
Control of cell division in Streptococcus pneumoniae by the conserved Ser/Thr protein kinase StkP
Beilharz, K., Nováková, L., Fadda, D., Branny, P., Massidda, O., & Veening, J. (2012) · Proceedings of the National Academy of Sciences · doi:10.1073/pnas.1119172109 · Cited by 190
The chromosome partitioning protein, ParB, is required for cytokinesis in Caulobacter crescentus
Mohl, D. A., Easter, J., & Gober, J. (2001) · Molecular Microbiology · doi:10.1046/j.1365-2958.2001.02643.x · Cited by 188
Martin, B., Prudhomme, M., Alloing, G., Granadel, C., & Claverys, J. (2000) · Molecular Microbiology · doi:10.1046/j.1365-2958.2000.02187.x · Cited by 181
The MinD Membrane Targeting Sequence Is a Transplantable Lipid-binding Helix
Szeto, T. H., Rowland, S., Habrukowich, C., & King, G. F. (2003) · Journal of Biological Chemistry · doi:10.1074/jbc.m306876200 · Cited by 180
Fleurie, A., Manuse, S., Zhao, C., Campo, N., Cluzel, C., Lavergne, J., Freton, C., Combet, C., Guiral, S., Soufi, B., et al. (2014) · PLoS Genetics · doi:10.1371/journal.pgen.1004275 · Cited by 177
Self-citationPrediction of amphipathic in-plane membrane anchors in monotopic proteins using a SVM classifier
Sapay, N., Guermeur, Y., & Deléage, G. (2006) · BMC Bioinformatics · doi:10.1186/1471-2105-7-255 · Cited by 170
SMC is recruited to oriC by ParB and promotes chromosome segregation in Streptococcus pneumoniae
Minnen, A., Attaiech, L., Thon, M., Gruber, S., & Veening, J. (2011) · Molecular Microbiology · doi:10.1111/j.1365-2958.2011.07722.x · Cited by 152
The bacterial chromosome: architecture and action of bacterial SMC and SMC-like complexes
Nolivos, S., & Sherratt, D. (2013) · FEMS Microbiology Reviews · doi:10.1111/1574-6976.12045 · Cited by 139
Fleurie, A., Cluzel, C., Guiral, S., Freton, C., Galisson, F., Zanella‐Cléon, I., Guilmi, A. M. D., & Grangeasse, C. (2011) · Molecular Microbiology · doi:10.1111/j.1365-2958.2011.07962.x · Cited by 131
Self-citationThe bacterial cell cycle, chromosome inheritance and cell growth.
Reyes-Lamothe, R., & Sherratt, D. J. (2019) · Nature Reviews Microbiology · doi:10.1038/s41579-019-0212-7 · Cited by 131
Bacterial chromosome segregation by the ParABS system
Jalal, A. S., & Le, T. (2020) · Open Biology · doi:10.1098/rsob.200097 · Cited by 130
LocZ Is a New Cell Division Protein Involved in Proper Septum Placement in Streptococcus pneumoniae
Holečková, N., Doubravová, L., Massidda, O., Molle, V., Buriánková, K., Benada, O., Kofroňová, O., Ulrych, A., & Branny, P. (2014) · mBio · doi:10.1128/mbio.01700-14 · Cited by 123
Ben‐Yehuda, S., Fujita, M., Liu, X. S., Gorbatyuk, B., Skoko, D., Yan, J., Marko, J. F., Liu, J. S., Eichenberger, P., Rudner, D. Z., et al. (2005) · Molecular Cell · doi:10.1016/j.molcel.2005.02.023 · Cited by 104
Shi, L., Pigeonneau, N., Ravikumar, V., Dobrinić, P., Maček, B., Franjević, D., Noirot‐Gros, M., & Mijakovic̀, I. (2014) · Frontiers in Microbiology · doi:10.3389/fmicb.2014.00495 · Cited by 75
Chromosome segregation drives division site selection in Streptococcus pneumoniae
van Raaphorst, R., Kjos, M., & Veening, J. (2017) · Proceedings of the National Academy of Sciences · doi:10.1073/pnas.1620608114 · Cited by 74
Identification of EloR (Spr1851) as a regulator of cell elongation in Streptococcus pneumoniae
Stamsås, G. A., Straume, D., Winther, A. R., Kjos, M., Frantzen, C. A., & Håvarstein, L. S. (2017) · Molecular Microbiology · doi:10.1111/mmi.13748 · Cited by 69
A Single Gene on the Staphylococcal Multiresistance Plasmid pSK1 Encodes a Novel Partitioning System
Simpson, A. E., Skurray, R. A., & Firth, N. (2003) · Journal of Bacteriology · doi:10.1128/jb.185.7.2143-2152.2003 · Cited by 62
Rewiring the Pneumococcal Cell Cycle with Serine/Threonine- and Tyrosine-kinases
Grangeasse, C. (2016) · Trends in Microbiology · doi:10.1016/j.tim.2016.04.004 · Cited by 60
Self-citationKjos, M., & Veening, J. (2014) · Molecular Microbiology · doi:10.1111/mmi.12517 · Cited by 55
Mechanisms for Chromosome Segregation in Bacteria
Gogou, C., Japaridze, A., & Dekker, C. (2021) · Frontiers in Microbiology · doi:10.3389/fmicb.2021.685687 · Cited by 49
Rules and Exceptions: The Role of Chromosomal ParB in DNA Segregation and Other Cellular Processes
Kawałek, A., Wawrzyniak, P., Bartosik, A. A., & Jagura-Burdzy, G. (2020) · Microorganisms · doi:10.3390/microorganisms8010105 · Cited by 44
Hirschfeld, C., Gómez-Mejía, A., Bartel, J., Hentschker, C., Rohde, M., Maaß, S., Hammerschmidt, S., & Becher, D. (2020) · Frontiers in Microbiology · doi:10.3389/fmicb.2019.03101 · Cited by 44
RocS drives chromosome segregation and nucleoid protection in Streptococcus pneumoniae
Mercy, C., Ducret, A., Slager, J., Lavergne, J.-P., Freton, C., Nagarajan, S. N., Garcia, P. S., Noirot‐Gros, M., Dubarry, N., Nourikyan, J., et al. (2019) · Nature Microbiology · doi:10.1038/s41564-019-0472-z · Cited by 39
Self-citationCoCoNat: a novel method based on deep learning for coiled-coil prediction
Madeo, G., Savojardo, C., Manfredi, M., Martelli, P. L., & Casadio, R. (2023) · Bioinformatics · doi:10.1093/bioinformatics/btad495 · Cited by 38
Peptide-Regulated Gene Depletion System Developed for Use in Streptococcus pneumoniae
Berg, K. H., Biørnstad, T. J., Straume, D., & Håvarstein, L. S. (2011) · Journal of Bacteriology · doi:10.1128/jb.05170-11 · Cited by 32
Baronian, G., Ginda, K., Berry, L., Cohen‐Gonsaud, M., Zakrzewska‐Czerwińska, J., Jakimowicz, D., & Molle, V. (2015) · PLoS ONE · doi:10.1371/journal.pone.0119907 · Cited by 30
Ulrych, A., Fabrik, I., Kupčík, R., Vajrychová, M., Doubravová, L., & Branny, P. (2021) · Journal of Molecular Biology · doi:10.1016/j.jmb.2021.167319 · Cited by 30
Schumacher, M. A., Lee, J., & Zeng, W. (2016) · Nucleic Acids Research · doi:10.1093/nar/gkw248 · Cited by 28
Loop-extruders alter bacterial chromosome topology to direct entropic forces for segregation
Harju, J., van Teeseling, M. C. F., & Broedersz, C. P. (2024) · Nature Communications · doi:10.1038/s41467-024-49039-w · Cited by 27
Feng, S.-H., Xia, C.-Q., & Shen, H.-B. (2022) · Bioinformatics · doi:10.1093/bioinformatics/btab744 · Cited by 21
Hitchhiking on chromosomes: A persistence strategy shared by diverse selfish DNA elements
Sau, S., Ghosh, S., Liu, Y., Ma, C.-H., & Jayaram, M. (2019) · Plasmid · doi:10.1016/j.plasmid.2019.01.004 · Cited by 21
Molecular basis of the final step of cell division in Streptococcus pneumoniae
Martínez‐Caballero, S., Freton, C., Molina, R., Bartual, S. G., Gueguen‐Chaignon, V., Mercy, C., Gago, F., Mahasenan, K. V., Muñoz, I. G., Lee, M., et al. (2023) · Cell Reports · doi:10.1016/j.celrep.2023.112756 · Cited by 21
Self-citationChan, H., Jensen, S. O., LeBard, R. J., et al. (2022) · Journal of Molecular Biology · doi:10.1016/j.jmb.2022.167770 · Cited by 7
Metadata
- Authors
- Demuysere, M., Ducret, A., & Grangeasse, C.
- Affiliations
- Centre National de la Recherche Scientifique (FR)
- Corresponding author
- Grangeasse, Christophe
- Venue
- Journal of Bacteriology
- Publisher
- American Society for Microbiology
- Published
- 2024-10-24
- Volume
- 206
- Issue
- 10
- Pages
- e0029124-e0029124
- ISSN
- 0021-9193 (ISSN-L)
- 1098-5530
- PMC
- PMC11500499
- OpenAlex
- W4402768642
- Cited by
- 1
- References
- 57
- Citations by year
- 2026: 1
- FWCI
- 0.26
- Type
- journal article
- Language
- en
- Open access
- hybrid
- doi.org
- Licence
- cc-by
- creativecommons.org/licenses/by/4.0/ (vor)
- journals.asm.org/non-commercial-tdm-license (tdm)
- Locations
- Journal of Bacteriology (publishedVersion, cc-by)
- bioRxiv (Cold Spring Harbor Laboratory) (acceptedVersion)
- PubMed Central (publishedVersion, cc-by)
- PubMed (publishedVersion)
- HAL (submittedVersion, cc-by)
- Funders
- European Commission (H2020, 955626)
- Centre National de la Recherche Scientifique (UMS344/US8)
- Université Claude Bernard Lyon 1
- Fondation Bettencourt Schueller
- Horizon 2020 Framework Programme (955626)
- HORIZON EUROPE Excellent Science
- H2020 Marie Skłodowska-Curie Actions (H2020, 955626)
- Topics
- Life Sciences › Biochemistry, Genetics and Molecular Biology › Genetics › Bacterial Genetics and Biotechnology
- Life Sciences › Biochemistry, Genetics and Molecular Biology › Cell Biology › Microtubule and mitosis dynamics
- Life Sciences › Biochemistry, Genetics and Molecular Biology › Molecular Biology › DNA Repair Mechanisms
- Keywords
- ROCS, chromosome segregation, Streptococcus pneumoniae, phosphorylation, amphipathic helix, coiled-coil domain, DNA-binding domain, protein oligomerization, membrane binding, PAR proteins, plasmid partitioning, Streptococcaceae
- MeSH terms
- Protein Domains, Bacterial Proteins, Chromosomes, Bacterial, Phosphorylation, Streptococcus pneumoniae, Gene Expression Regulation, Bacterial, Chromosome Segregation
About these checks
Registry, retraction, Cites and statistics results are computed, not judged, with one exception: a printed reference that no index lists is read once by a model before it counts as a citation error. Claims are extracted by a model and kept only when their quote appears verbatim in the text; each cited source is then checked, with a model’s help, for whether it says what the claim relies on. Those verdicts can be wrong — read the claim’s quote and the cited source before relying on one.
Statistics and arithmetic are recomputed, not judged.
Confidence bands are shown only for fields calibrated on our annotated test set. None is calibrated yet, so no band is shown.
What counts as a claim ›How we measure confidence ›How we check this ›
Are you an author, or do you see a problem with this page? Request a review
Data sources
Bibliographic data: Semantic Scholar, OpenAlex, Crossref.
Contains information from the Semantic Scholar Academic Graph Datasets, made available under the ODC Attribution License (ODC-BY 1.0).
Semantic Scholar’s data is described in: Kinney, R., et al. (2023). The Semantic Scholar Open Data Platform. arXiv:2301.10140.
