

The DOI matches its Crossref record; 29 of the 29 references it cites were found in a registry or an index.
Sedentary behaviour and life expectancy in the USA: a cause-deleted life table analysis
Open accessAbstract
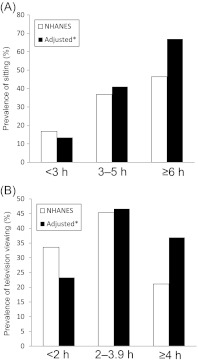
OBJECTIVES: To determine the impact of sitting and television viewing on life expectancy in the USA. DESIGN: Prevalence-based cause-deleted life table analysis. SETTING: Summary RRs of all-cause mortality associated with sitting and television viewing were obtained from a meta-analysis of available prospective cohort studies. Prevalences of sitting and television viewing were obtained from the US National Health and Nutrition Examination Survey. PRIMARY OUTCOME MEASURE: Life expectancy at birth. RESULTS: The estimated gains in life expectancy in the US population were 2.00 years for reducing excessive sitting to <3 h/day and a gain of 1.38 years from reducing excessive television viewing to <2 h/day. The lower and upper limits from a sensitivity analysis that involved simultaneously varying the estimates of RR (using the upper and lower bounds of the 95% CI) and the prevalence of television viewing (±20%) were 1.39 and 2.69 years for sitting and 0.48 and 2.51 years for television viewing, respectively. CONCLUSION: Reducing sedentary behaviours such as sitting and television viewing may have the potential to increase life expectancy in the USA.
Overview
The claims and statistics of this paper haven’t been checked yet.
Run the check — free, no account needed. It reads the open-access text and checks the sources it cites.
Integrity signals
Registry
Cites
Statistics
Figures
Verification
Claims the paper makes
The claims and statistics of this paper haven’t been checked yet.
Run the check — free, no account needed. It reads the open-access text and checks the sources it cites.
Claims other papers make about this one
Each is checked against this paper’s own text: does it say what the citing paper says it does?
In the citing paper
“In another study, Katzmarzyk and Lee [15] reported an 18%-45% increase in risk of all-cause mortality for higher levels of sitting, relative to the lowest level.”
From Daily Sitting Time and All-Cause Mortality: A Meta-Analysis (2013) · cites this paper as [15]
In the citing paper
“The main limitation of this meta-analysis is the small number of studies included, although this was greater than in some previous meta-analyses[13,15].”
From Daily Sitting Time and All-Cause Mortality: A Meta-Analysis (2013) · cites this paper as [15]
In the citing paper
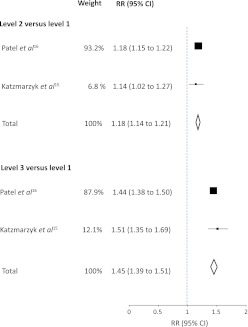
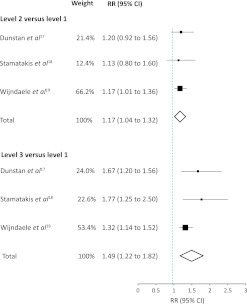
“Other meta-analyses have shown pooled HRs of 1.18-1.45 [15] and 1.49 [18] for the group with the highest level of sitting or sedentary time compared with the lowest group, respectively.”
From Daily Sitting Time and All-Cause Mortality: A Meta-Analysis (2013) · cites this paper as [15]
In the citing paper
“However, both studies combined different measures of sedentary behavior (TV-viewing mostly, and sitting time) in their analyses, and neither study examined dose-response relationships for daily total sitting time.”
From Daily Sitting Time and All-Cause Mortality: A Meta-Analysis (2013) · cites this paper as [15]
Self-check
Percentages, sums and reported differences re-computed from the paper’s own numbers.
The self-check needs the paper’s full text.
Citations
Cites
The Physical Activity Guidelines for Americans
Piercy, K. L., Troiano, R. P., Ballard, R. M., Carlson, S. A., Fulton, J. E., Galuska, D. A., George, S. M., & Olson, R. D. (2018) · JAMA · doi:10.1001/jama.2018.14854 · Cited by 9,755
Amount of Time Spent in Sedentary Behaviors in the United States, 2003-2004
Matthews, C. E., Chen, K. Y., Freedson, P. S., Buchowski, M. S., Beech, B. M., Pate, R. R., & Troiano, R. P. (2008) · American Journal of Epidemiology · doi:10.1093/aje/kwm390 · Cited by 2,631
A Potential Decline in Life Expectancy in the United States in the 21st Century
Olshansky, S. J., Passaro, D. J., Hershow, R. C., Layden, J., Carnes, B. A., Brody, J., Hayflick, L., Butler, R. N., Allison, D. B., & Ludwig, D. S. (2005) · New England Journal of Medicine · doi:10.1056/nejmsr043743 · Cited by 2,612
National Health and Nutrition Examination Survey
Rothwell, C. J. (2009) · Springer eBooks · doi:10.1007/978-0-387-78665-0_6177 · Cited by 2,093
A Potential Decline in Life Expectancy in the United States in the 21st Century
Olshansky, S. J., Passaro, D. J., Hershow, R. C., Layden, J. E., Carnes, B. A., Brody, J. A., Hayflick, L., Butler, R. N., Allison, D. B., & Ludwig, D. S. (2005) · Obstetrical & Gynecological Survey · doi:10.1097/01.ogx.0000167407.83915.e7 · Cited by 1,947
Use and misuse of population attributable fractions
Rockhill, B., Newman, B., & Weinberg, C. (1998) · American Journal of Public Health · doi:10.2105/ajph.88.1.15 · Cited by 1,683
Sitting time and mortality from all causes, cardiovascular disease, and cancer
KATZMARZYK, P. T., CHURCH, T. S., CRAIG, C. L., & BOUCHARD, C. (2009) · Medicine & Science in Sports & Exercise · doi:10.1249/mss.0b013e3181930355 · Cited by 1,611
Self-citationPhysiological and health implications of a sedentary lifestyle
Tremblay, M. S., Colley, R. C., Saunders, T. J., Healy, G. N., & Owen, N. G. (2010) · Applied Physiology, Nutrition, and Metabolism · doi:10.1139/h10-079 · Cited by 1,572
Sedentary Behaviors and Subsequent Health Outcomes in Adults
Thorp, A. A., Owen, N., Neuhaus, M., & Dunstan, D. W. (2011) · American Journal of Preventive Medicine · doi:10.1016/j.amepre.2011.05.004 · Cited by 1,455
Sedentary time and cardio-metabolic biomarkers in US adults: NHANES 2003–06
Healy, G. N., Matthews, C. E., Dunstan, D. W., Winkler, E. A. H., & Owen, N. (2011) · European Heart Journal · doi:10.1093/eurheartj/ehq451 · Cited by 1,368
Cited by
Sorted by citations
Items 201–217 of 217
Chen, C., Jiang, L., Lyu, S., & Marois, G. (2023) · China Population and Development Studies · doi:10.1007/s42379-023-00144-1
Meena, T., & Sarawadekar, K. P. (2023) · IEEE India Conference · doi:10.1109/indicon59947.2023.10440943
Aysia, D. A. Y., & Palit, H. C. (2024) · SHS Web of Conferences · doi:10.1051/shsconf/202418901018
Ching, J., Duff, S., & Hernandez, J. (2024) · medRxiv · doi:10.1101/2024.06.05.24306788
García-Witulski, C. (2024) · Journal of Public Health · doi:10.1093/pubmed/fdae291
Pathmanathan, R., Wheeler, M., Teychenne, M. J., Hallgren, M. Å., Sethi, P., Owen, N. G., & Dunstan, D. W. (2025) · Diabetes Research and Clinical Practice · doi:10.1016/j.diabres.2025.112240
Carlier, M., & Delevoye, Y. (2025) · Springer eBooks · doi:10.1007/978-3-031-90034-1_7 · Cited by 1
Neck Health Detection System with TinyML MCU
Yang, C., Jiang, Z.-H., Hsu, M., & Chen, J.-F. (2025) · IEEE International Conference on Consumer Electronics - Taiwan (ICCE-Taiwan) · doi:10.1109/icce-taiwan66881.2025.11208015
da Silva, L. S. L., de Freitas Batalhão, D., dos Santos Carvalho, A., Bohn, L., Ramos, N. C., & Abdalla, P. P. (2024) · Figshare · doi:10.6084/m9.figshare.26555795
da Silva, L. S. L., de Freitas Batalhão, D., dos Santos Carvalho, A., Bohn, L., Ramos, N. C., & Abdalla, P. P. (2024) · Figshare · doi:10.6084/m9.figshare.26555789
da Silva, L. S. L., de Freitas Batalhão, D., dos Santos Carvalho, A., Bohn, L., Ramos, N. C., & Abdalla, P. P. (2024) · Figshare · doi:10.6084/m9.figshare.26555792
Fabre-Estremera, B., Buño-Soto, A., García‐Esquinas, E., Cabanas‐Sánchez, V., Martínez-Gómez, D., Rodríguez-Artalejo, F., & Ortolá, R. (2023) · Figshare · doi:10.6084/m9.figshare.22621573
Daulatabad, V. S., Kamble, P., Patil, R., Vahini, G., & John, D. N. (2026) · Indian Journal of Cardiovascular Disease in Women · doi:10.25259/ijcdw_100_2025
Treat the Condition Not the Label
Swingle, P. G. (2015) · Springer eBooks · doi:10.1007/978-3-319-15527-2_3
The role of early life nutrition in obesity prevention
Binns, C. W., Lee, M. K., & Xu, R. (2013) · Murdoch University Research Portal
Metadata
- Authors
- Katzmarzyk, P. T., & Lee, I.-M.
- Affiliations
- Pennington Biomedical Research Center (US)
- Brigham and Women's Hospital (US)
- Corresponding author
- Katzmarzyk, Peter T
- Venue
- BMJ Open
- Publisher
- BMJ
- Published
- 2012
- Volume
- 2
- Issue
- 4
- Pages
- e000828
- ISSN
- 2044-6055 (ISSN-L)
- PMC
- PMC3400064
- OpenAlex
- W2172123562
- Cited by
- 218
- References
- 29
- Citations by year
- 2026: 2 · 2025: 8 · 2024: 16 · 2023: 12 · 2022: 12 · 2021: 12 · 2020: 11 · 2019: 17 · 2018: 20 · 2017: 17 · 2016: 15 · 2015: 24 · 2014: 19 · 2013: 28 · 2012: 5
- FWCI
- 16.30
- Type
- journal article
- Language
- en
- Open access
- gold
- doi.org
- Licence
- cc-by-nc
- Locations
- BMJ Open (publishedVersion, cc-by-nc)
- Europe PMC (PubMed Central) (publishedVersion, cc-by-nc)
- PubMed Central (publishedVersion, cc-by-nc)
- PubMed (publishedVersion)
- Digital Access to Scholarship at Harvard (DASH) (Harvard University) (submittedVersion, cc-by)
- HighWire Press Open Archive (submittedVersion)
- Topics
- Health Sciences › Medicine › Public Health, Environmental and Occupational Health › Physical Activity and Health
- Social Sciences › Demography › Insurance, Mortality, Demography, Risk Management
- Social Sciences › Health › Health disparities and outcomes
- Keywords
- sedentary behavior, sitting time, television viewing, life expectancy, all-cause mortality
About these checks
Registry, retraction, Cites and statistics results are computed, not judged, with one exception: a printed reference that no index lists is read once by a model before it counts as a citation error. Claims are extracted by a model and kept only when their quote appears verbatim in the text; each cited source is then checked, with a model’s help, for whether it says what the claim relies on. Those verdicts can be wrong — read the claim’s quote and the cited source before relying on one.
Statistics and arithmetic are recomputed, not judged.
Confidence bands are shown only for fields calibrated on our annotated test set. None is calibrated yet, so no band is shown.
What counts as a claim ›How we measure confidence ›How we check this ›
Are you an author, or do you see a problem with this page? Request a review
