

The DOI matches its Crossref record; 28 of the 30 references it cites were found in a registry or an index.
How accurate are digital symptom assessment apps for suggesting conditions and urgency advice? A clinical vignettes comparison to GPs
Open accessPublished version of a preprint
Abstract
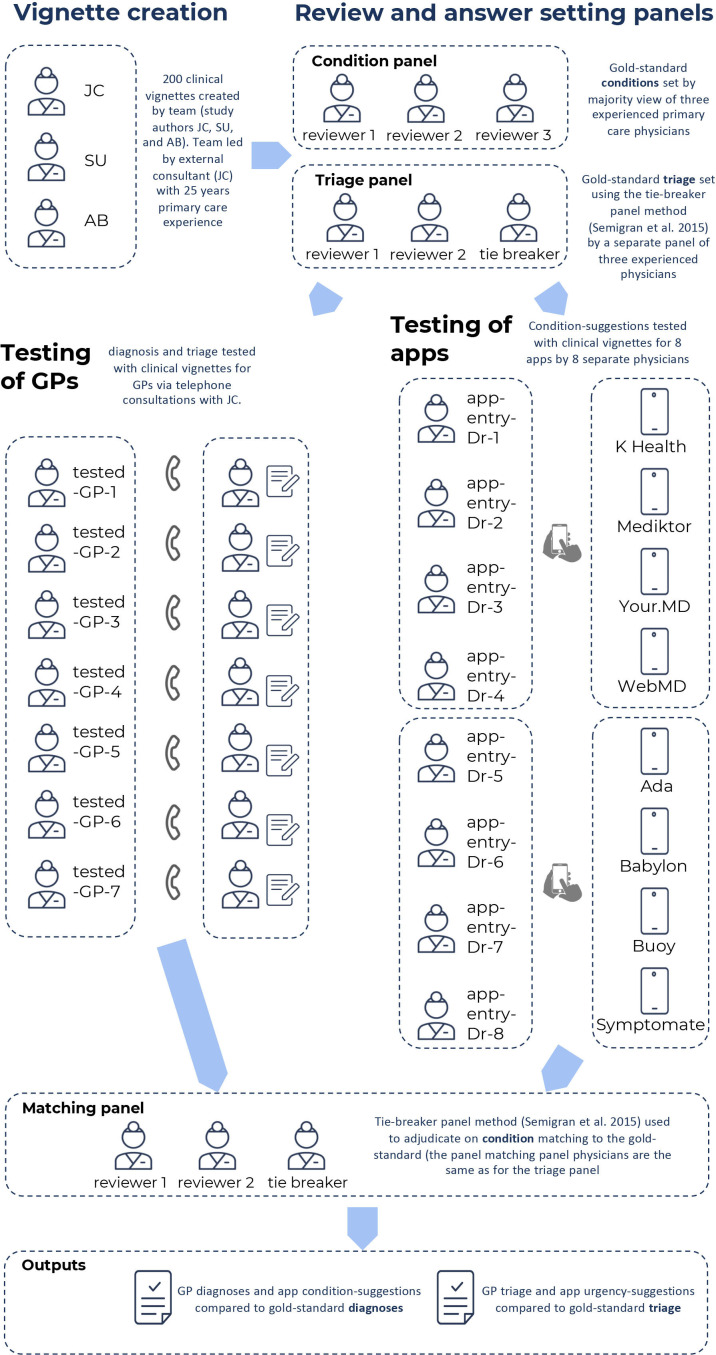
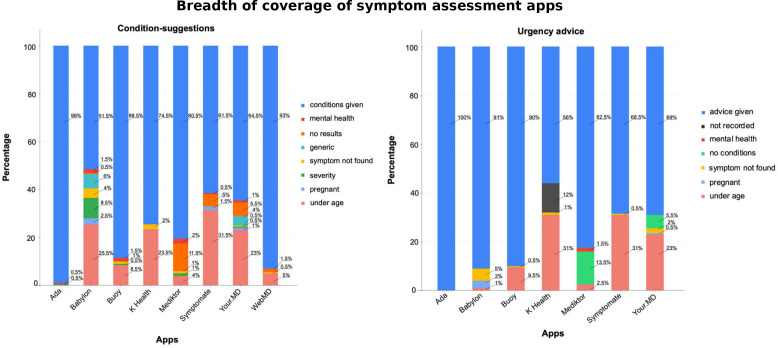
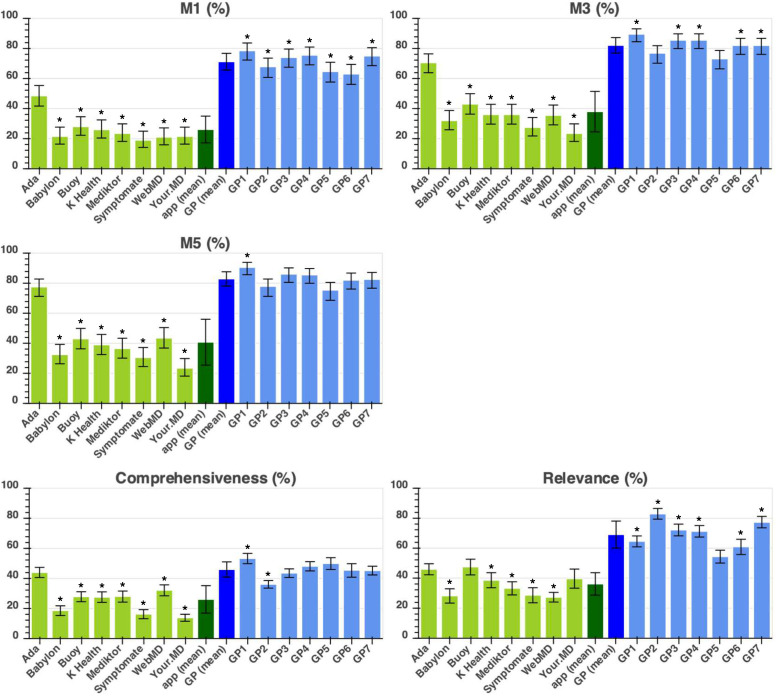
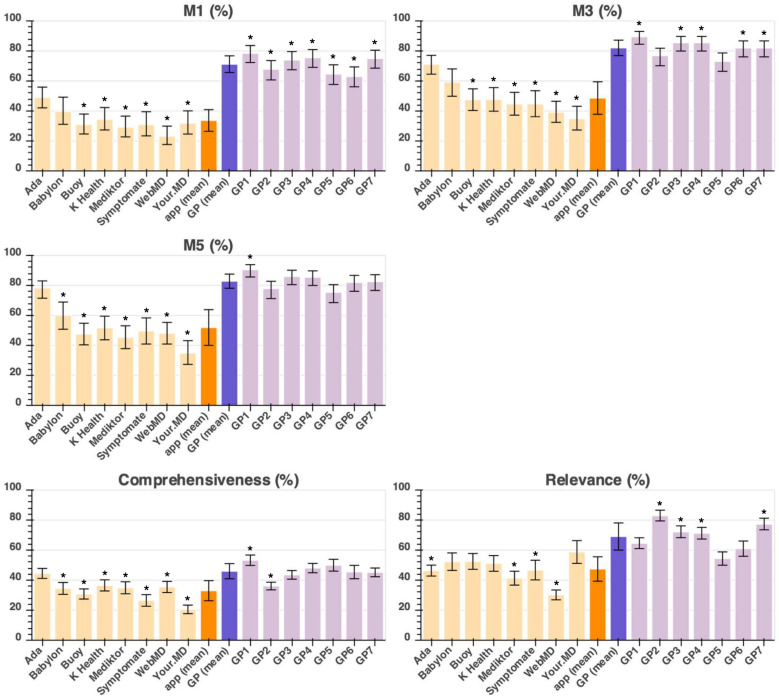
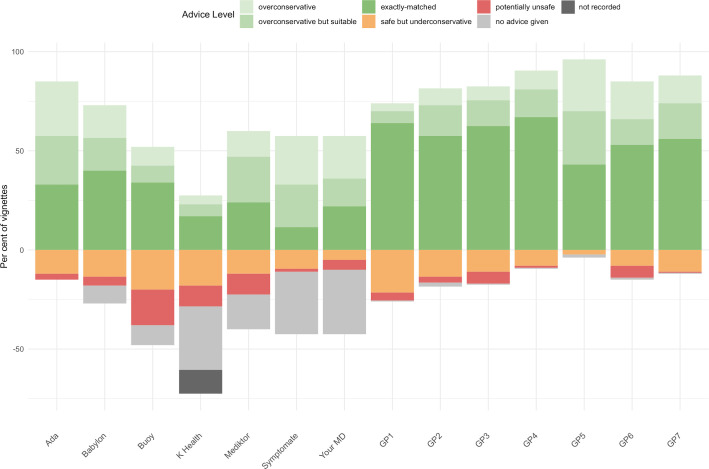
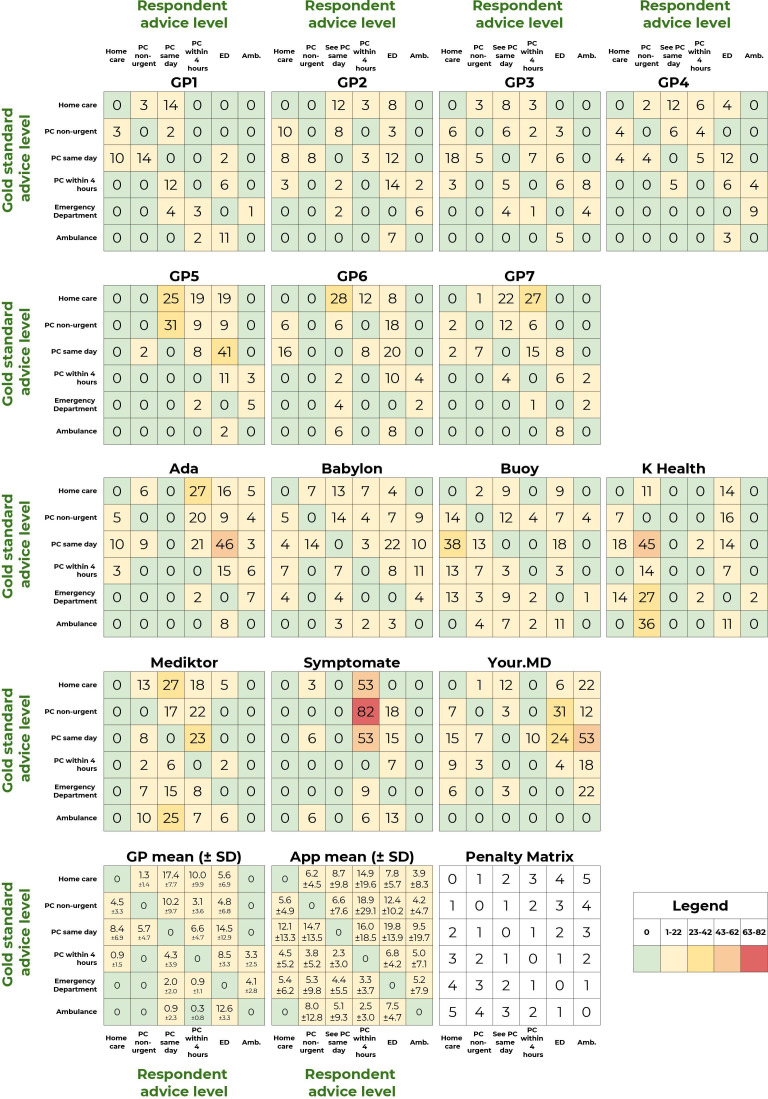
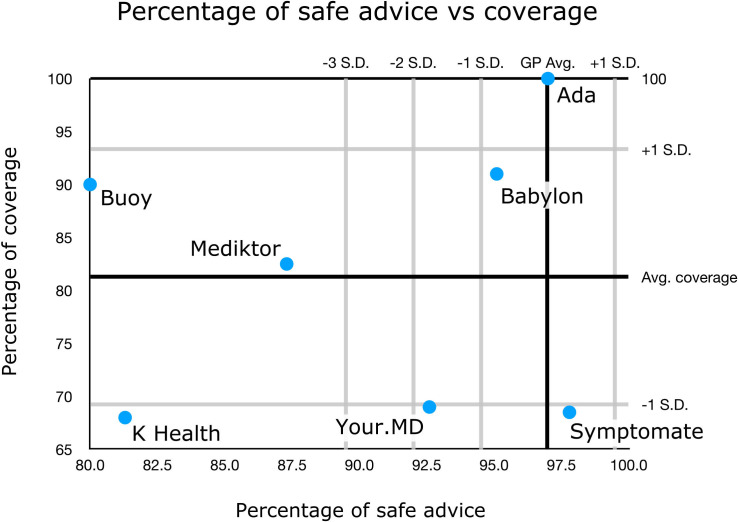
Objectives: To compare breadth of condition coverage, accuracy of suggested conditions and appropriateness of urgency advice of eight popular symptom assessment apps. Design: Vignettes study. Setting: 200 primary care vignettes. Intervention/comparator: For eight apps and seven general practitioners (GPs): breadth of coverage and condition-suggestion and urgency advice accuracy measured against the vignettes’ gold-standard. Primary outcome measures: (1) Proportion of conditions ‘covered’ by an app, that is, not excluded because the user was too young/old or pregnant, or not modelled; (2) proportion of vignettes with the correct primary diagnosis among the top 3 conditions suggested; (3) proportion of ‘safe’ urgency advice (ie, at gold standard level, more conservative, or no more than one level less conservative). Results: Condition-suggestion coverage was highly variable, with some apps not offering a suggestion for many users: in alphabetical order, Ada: 99.0%; Babylon: 51.5%; Buoy: 88.5%; K Health: 74.5%; Mediktor: 80.5%; Symptomate: 61.5%; Your.MD: 64.5%; WebMD: 93.0%. Top-3 suggestion accuracy was GPs (average): 82.1%±5.2%; Ada: 70.5%; Babylon: 32.0%; Buoy: 43.0%; K Health: 36.0%; Mediktor: 36.0%; Symptomate: 27.5%; WebMD: 35.5%; Your.MD: 23.5%. Some apps excluded certain user demographics or conditions and their performance was generally greater with the exclusion of corresponding vignettes. For safe urgency advice, tested GPs had an average of 97.0%±2.5%. For the vignettes with advice provided, only three apps had safety performance within 1 SD of the GPs—Ada: 97.0%; Babylon: 95.1%; Symptomate: 97.8%. One app had a safety performance within 2 SDs of GPs—Your.MD: 92.6%. Three apps had a safety performance outside 2 SDs of GPs—Buoy: 80.0% (p<0.001); K Health: 81.3% (p<0.001); Mediktor: 87.3% (p=1.3×10 -3 ). Conclusions: The utility of digital symptom assessment apps relies on coverage, accuracy and safety. While no digital tool outperformed GPs, some came close, and the nature of iterative improvements to software offers scalable improvements to care.
Overview
The claims and statistics of this paper haven’t been checked yet.
Run the check — free, no account needed. It reads the open-access text and checks the sources it cites.
Integrity signals
Registry
Cites
Statistics
Figures
Verification
Claims the paper makes
The claims and statistics of this paper haven’t been checked yet.
Run the check — free, no account needed. It reads the open-access text and checks the sources it cites.
Claims other papers make about this one
Each is checked against this paper’s own text: does it say what the citing paper says it does?
The source backs part of the claim, not all of it — or backs it for a different population, condition or comparison.
In the citing paper
“Furthermore, the accuracy observed in our study is close to the performance rate of ADA (48.5%) across a broad spectrum of medical conditions in the study by Gilbert et al [34] but lower than in another recent comparative study (72%) [35].”
From Diagnostic Performance of an App-Based Symptom Checker in Mental Disorders: Comparative Study in Psychotherapy Outpatients (2022) · cites this paper as [35]
Experimental — accuracy not yet measuredThe source backs part of the claim, not all of it — or backs it for a different population, condition or comparison.
In the citing paper
“In two-thirds (34/49, 67%) of cases, 1 in 5 condition suggestions aligned with any of the interview-based diagnoses, which is somewhat below the range of performance rates of ADA in previous studies using case vignettes (77%-84%) [34,35] or patients seeking emergency care (91.3%) [58].”
From Diagnostic Performance of an App-Based Symptom Checker in Mental Disorders: Comparative Study in Psychotherapy Outpatients (2022) · cites this paper as [35]
Experimental — accuracy not yet measuredThe source backs part of the claim, not all of it — or backs it for a different population, condition or comparison.
In the citing paper
“On this matter, evidence indicates that the use of algorithms over other methods, the inclusion of demographic information [57], or more rigorous questioning [35] could explain the differences between symptom checkers’ diagnostic performances.”
From Diagnostic Performance of an App-Based Symptom Checker in Mental Disorders: Comparative Study in Psychotherapy Outpatients (2022) · cites this paper as [35]
Experimental — accuracy not yet measuredThe cited source says what the claim attributes to it.
In the citing paper
“As previous studies have shown considerable differences between symptom checkers’ diagnostic accuracy [33,35], future studies could compare various symptom checkers for the formal diagnosis of mental disorders.”
From Diagnostic Performance of an App-Based Symptom Checker in Mental Disorders: Comparative Study in Psychotherapy Outpatients (2022) · cites this paper as [35]
Self-check
Percentages, sums and reported differences re-computed from the paper’s own numbers.
The self-check needs the paper’s full text.
Citations
Cites
Controlling the False Discovery Rate: A Practical and Powerful Approach to Multiple Testing
Benjamini, Y., & Hochberg, Y. (1995) · Journal of the Royal Statistical Society Series B: Statistical Methodology · doi:10.1111/j.2517-6161.1995.tb02031.x · Cited by 109,482
Probable Inference, the Law of Succession, and Statistical Inference
Wilson, E. B. (1927) · Journal of the American Statistical Association · doi:10.1080/01621459.1927.10502953 · Cited by 4,476
Controlling the false discovery rate in behavior genetics research
Benjamini, Y., Drai, D., Elmer, G., Kafkafi, N., & Golani, I. (2001) · Behavioural Brain Research · doi:10.1016/s0166-4328(01)00297-2 · Cited by 4,146
COVID-19: what is next for public health?
Heymann, D. L., & Shindo, N. (2020) · The Lancet · doi:10.1016/s0140-6736(20)30374-3 · Cited by 1,146
Video consultations for covid-19
Greenhalgh, T., Wherton, J., Shaw, S., & Morrison, C. (2020) · BMJ · doi:10.1136/bmj.m998 · Cited by 866 · cited 3×
“Other situations, such as the inability to search for certain symptoms, providing no condition-suggestions/urgency advice for certain input symptoms, or, excluding comorbidities, mental health or pregnancy are more problematic and can raise concerns about the safety and benefits of the app for…”
InfluentialEvans, S. C., Roberts, M. C., Keeley, J. W., Blossom, J. B., Amaro, C. M., Garcia, A. M., Stough, C. O., Canter, K. S., Robles, R., & Reed, G. M. (2015) · International Journal of Clinical and Health Psychology · doi:10.1016/j.ijchp.2014.12.001 · Cited by 757
Evaluation of symptom checkers for self diagnosis and triage: audit study
Semigran, H. L., Linder, J. A., Gidengil, C., & Mehrotra, A. (2015) · BMJ · doi:10.1136/bmj.h3480 · Cited by 489
Clinical Vignette-Based Surveys: A Tool for Assessing Physician Practice Variation
Veloski, J., Tai, S., Evans, A., & Nash, D. (2005) · American Journal of Medical Quality · doi:10.1177/1062860605274520 · Cited by 396
Performance of Four Computer-Based Diagnostic Systems
Berner, E. S., Webster, G. D., Shugerman, A. A., Jackson, J. R., Algina, J. J., Baker, A. L., Ball, E. V., Cobbs, C. G., Dennis, V. W., Frenkel, E. P., et al. (1994) · New England Journal of Medicine · doi:10.1056/nejm199406233302506 · Cited by 320
Fisher’s exact approach for post hoc analysis of a chi-squared test
Shan, G., & Gerstenberger, S. (2017) · PLoS ONE · doi:10.1371/journal.pone.0188709 · Cited by 234 · cited 1×
“MD and for this reason a subanalysis of the 150 vignettes for which full verification was possible for these apps is provided in online supplemental table 6 and 7.”
Research works printed but not linked: 1
- 10.2307/2276774 · DOI · Paper page
Cited by
Sorted by citations
The promise of digital healthcare technologies
Yeung, A. W. K., Torkamani, A., Butte, A. J., Glicksberg, B. S., Schuller, B. W., Rodríguez, B., Ting, D. S. W., Bates, D. W., Schaden, E., Peng, H., et al. (2023) · Frontiers in Public Health · doi:10.3389/fpubh.2023.1196596 · Cited by 284
“On the other hand, GPs and healthcare professionals need to learn computer science skills to master AI/ML programs and fully utilize their potentials.”
InfluentialThe Advent of Generative Language Models in Medical Education
Karabacak, M., Ozkara, B. B., Margetis, K., Wintermark, M., & Bisdas, S. (2023) · JMIR Medical Education · doi:10.2196/48163 · Cited by 208
“Moreover, GLMs’ enhanced comprehension of complex medical terminology and context might enable AI-powered health companions such as Ada Health to provide more precise diagnostic suggestions and individualized health advice to both clinicians and patients [9].”
The diagnostic and triage accuracy of digital and online symptom checker tools: a systematic review
Wallace, W. J., Chan, C., Chidambaram, S., Hanna, L., Iqbal, F. M., Acharya, A., Normahani, P., Ashrafian, H., Markar, S. R., Sounderajah, V., et al. (2022) · npj Digital Medicine · doi:10.1038/s41746-022-00667-w · Cited by 213
“[1,16,18,19,21–24]”
BackgroundMethodResultInfluentialFraser, H., Crossland, D., Bacher, I., Ranney, M., Madsen, T., & Hilliard, R. (2023) · JMIR mHealth and uHealth · doi:10.2196/49995 · Cited by 128
“As has been seen with the use of search engines such as Google [36] and existing SCs [7,20], a substantial proportion of the population are likely to use such tools.”
BackgroundMethodResultInfluentialSelf-citationAccuracy of online symptom checkers and the potential impact on service utilisation
Ceney, A., Tolond, S., Glowinski, A., Marks, B., Swift, S., & Palser, T. (2021) · PLOS ONE · doi:10.1371/journal.pone.0254088 · Cited by 125
“[15]) and one published at the end of last year [16] examined multiple presentations and conditions; the others focused on single condition studies such as those examining system performance for cervical myelopathy, inflammatory arthritis, HIV / Hepatitis C and ophthalmic conditions [17–20].”
BackgroundResult
Metadata
- Authors
- Gilbert, S., Mehl, A., Baluch, A., Cawley, C., Challiner, J., Fraser, H., Millen, E., Montazeri, M., Multmeier, J., Pick, F., Richter, C., Türk, E., Upadhyay, S., Virani, V., Vona, N., Wicks, P., & Novorol, C.
- Affiliations
- Brown University (US)
- Corresponding author
- Gilbert, Stephen
- ORCID
- Venue
- BMJ Open
- Publisher
- BMJ
- Published
- 2020-12
- Volume
- 10
- Issue
- 12
- Pages
- e040269
- ISSN
- 2044-6055 (ISSN-L)
- PMC
- PMC7745523
- OpenAlex
- W3112185662
- Cited by
- 183
- References
- 30
- Citations by year
- 2026: 20 · 2025: 25 · 2024: 31 · 2023: 37 · 2022: 40 · 2021: 27 · 2020: 3
- FWCI
- 27.92
- Type
- journal article
- Language
- en
- Open access
- gold
- doi.org
- Licence
- Locations
- BMJ Open (publishedVersion, cc-by-nc)
- medRxiv (acceptedVersion, cc-by-nc-nd)
- PubMed Central (publishedVersion, cc-by-nc)
- PubMed (publishedVersion)
- DOAJ (DOAJ: Directory of Open Access Journals) (submittedVersion, cc-by-sa)
- HighWire Press Open Archive (submittedVersion)
- Topics
- Health Sciences › Health Professions › General Health Professions › Mobile Health and mHealth Applications
- Health Sciences › Medicine › Health Informatics › Artificial Intelligence in Healthcare and Education
- Health Sciences › Health Professions › Health Information Management › Artificial Intelligence in Healthcare
- Keywords
- symptom checkers, clinical vignettes, general practitioners, Ada, Babylon, buoys, WebMD, primary care, diagnostic accuracy, patient safety, user demographics, mobile health apps, telemedicine, primary diagnosis
- MeSH terms
- Humans, Primary Health Care, General Practitioners, Symptom Assessment, Mobile Applications
About these checks
Registry, retraction, Cites and statistics results are computed, not judged, with one exception: a printed reference that no index lists is read once by a model before it counts as a citation error. Claims are extracted by a model and kept only when their quote appears verbatim in the text; each cited source is then checked, with a model’s help, for whether it says what the claim relies on. Those verdicts can be wrong — read the claim’s quote and the cited source before relying on one.
Statistics and arithmetic are recomputed, not judged.
Confidence bands are shown only for fields calibrated on our annotated test set. None is calibrated yet, so no band is shown.
What counts as a claim ›How we measure confidence ›How we check this ›
Are you an author, or do you see a problem with this page? Request a review
