

The DOI matches its Crossref record; 51 of the 51 references it cites were found in a registry or an index.
STING activation normalizes the intraperitoneal vascular-immune microenvironment and suppresses peritoneal carcinomatosis of colon cancer
Open accessAbstract
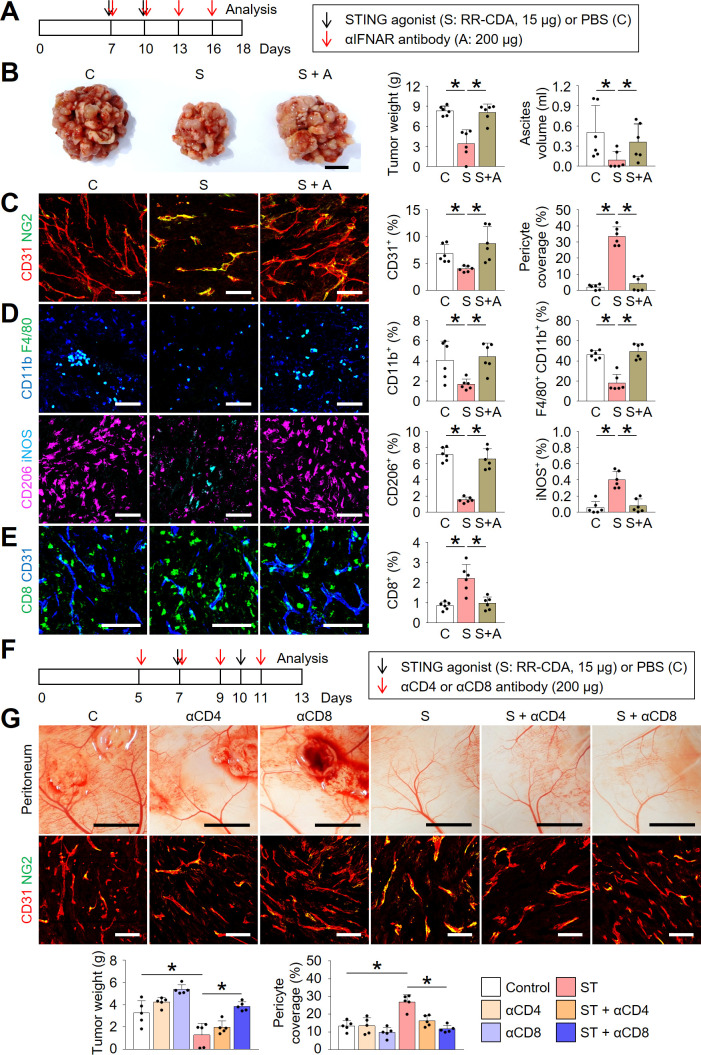
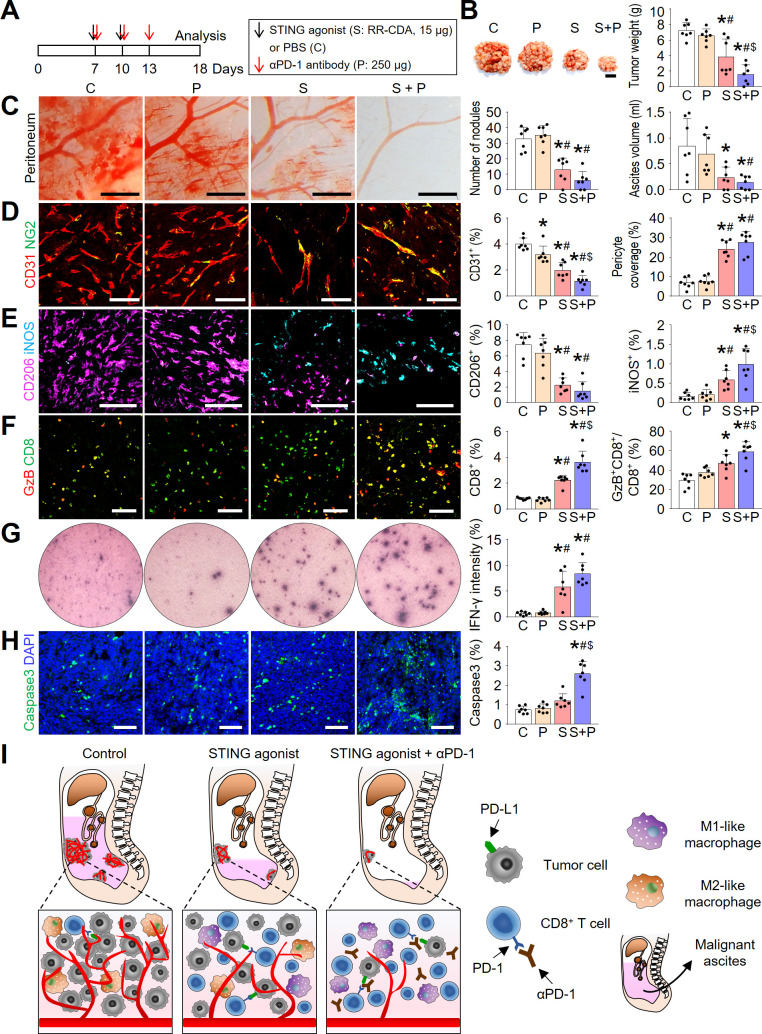
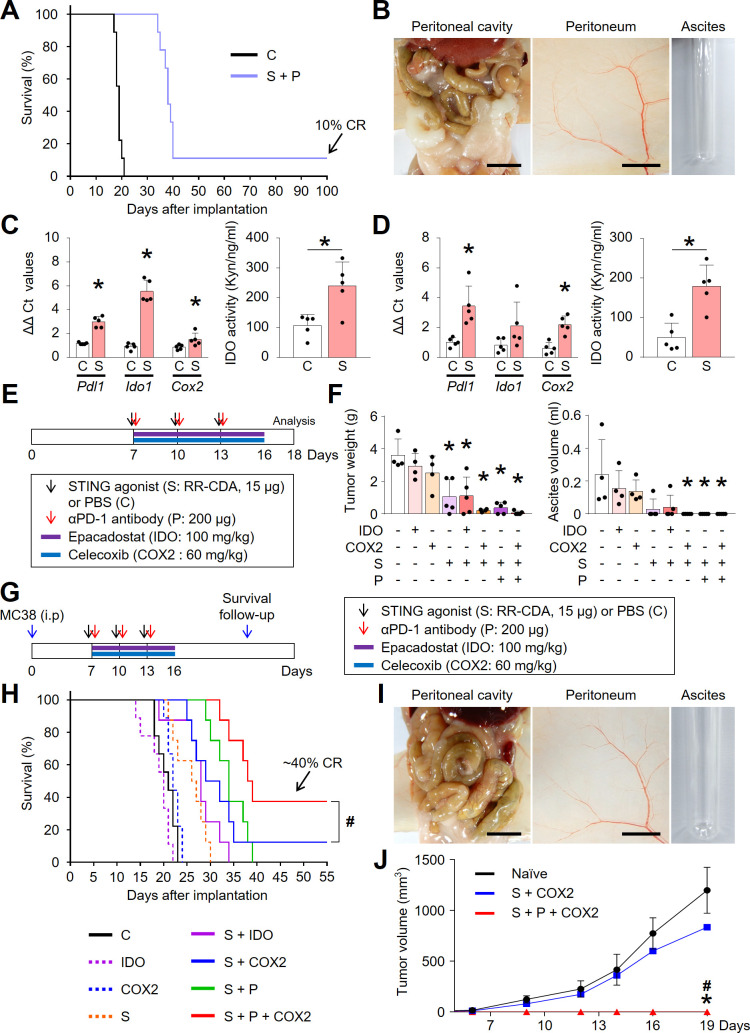
Background: Peritoneal carcinomatosis is a fatal clinical presentation of colon cancer, characterized by unresponsiveness to conventional anticancer therapies, including immune checkpoint inhibitors. Here, we elucidated the immune-evasion mechanisms during the peritoneal carcinomatosis of colon cancer and developed a novel immunotherapy by activating the stimulator of interferon genes (STING) pathway. Methods: We generated a syngeneic peritoneal carcinomatosis model of colon cancer. Mice were intraperitoneally treated with either STING agonist (MIW815, also known as ADU-S100) or PD-1 blockade or both. The tumor microenvironment was comprehensively analyzed using multiplexed immunofluorescence imaging, flow cytometry, and NanoString immune profiling. Results: Intraperitoneal colon cancer cells induce a massive influx of immunosuppressive M2-like macrophages, upregulate immune checkpoints, and impair effector T cell functions during peritoneal dissemination; these collectively create a highly angiogenic and immunosuppressive milieu that is resistant to anti-PD-1 monotherapy. Intraperitoneal administration of a STING agonist suppressed aberrant angiogenesis, increased pericyte coverage, and normalized tumor vessels, thereby facilitating the infiltration of activated CD8 + T cells into peritoneal tumor nodules. Moreover, STING activation reprogramed tumor-associated macrophages toward the M1 phenotype. STING activation converted immunologically cold peritoneal tumors into T-cell-inflamed tumors in a type-I interferon-dependent manner. Lastly, the STING agonist synergistically cooperated with PD-1 and/or COX2 blockade to further suppress the peritoneal dissemination of colon cancer, resulting in complete eradication of tumor and ascites, and inducing durable antitumor immunity. Conclusions: STING activation can normalize the peritoneal vascular and immune microenvironment, providing a rationale for a novel combination therapeutic strategy for peritoneal carcinomatosis in colon cancer.
Overview
The claims and statistics of this paper haven’t been checked yet.
Run the check — free, no account needed. It reads the open-access text and checks the sources it cites.
Integrity signals
Registry
Cites
Statistics
Figures
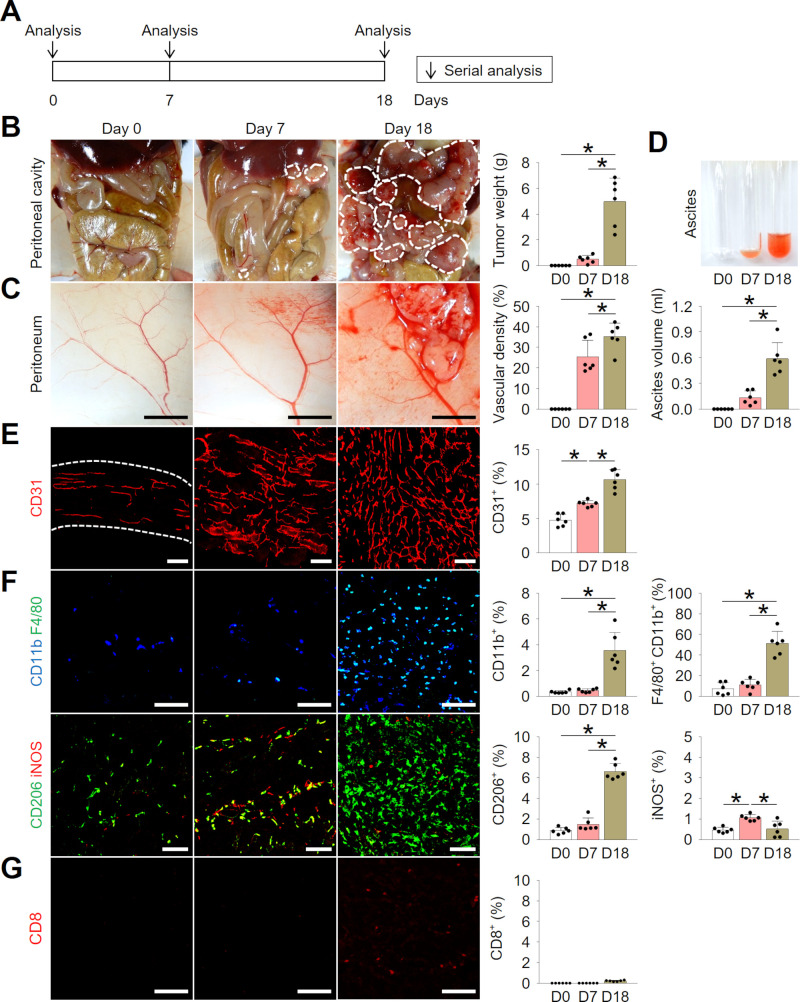
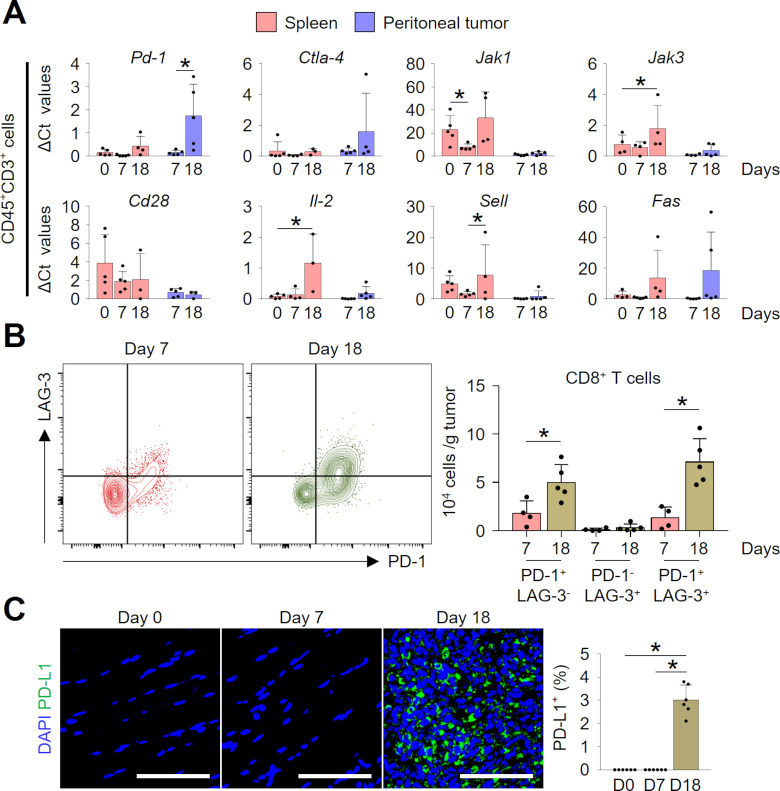
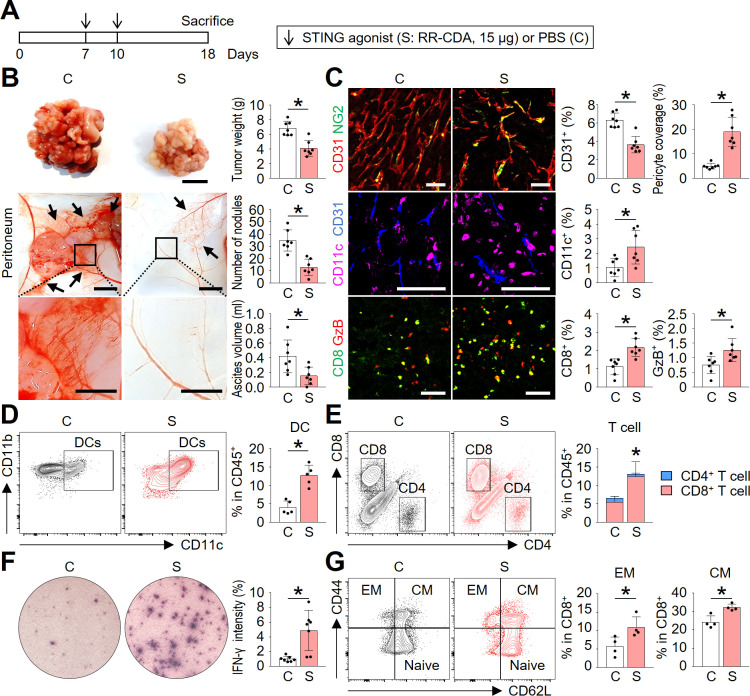
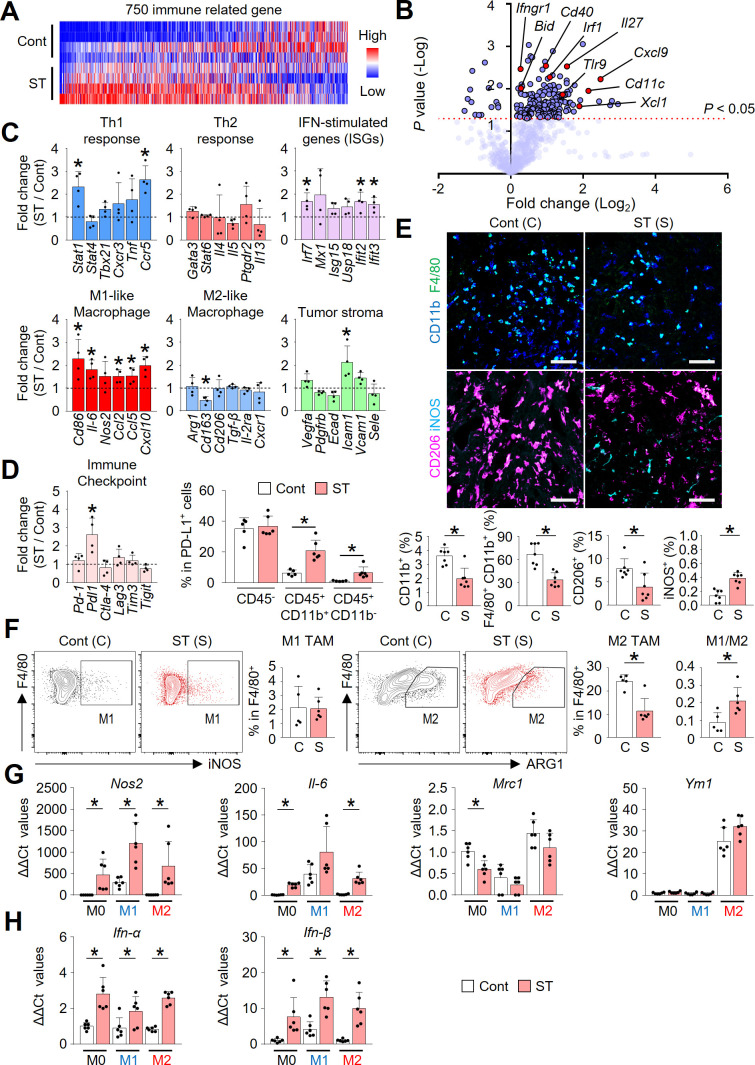
Verification
Claims the paper makes
The claims and statistics of this paper haven’t been checked yet.
Run the check — free, no account needed. It reads the open-access text and checks the sources it cites.
Claims other papers make about this one
Each is checked against this paper’s own text: does it say what the citing paper says it does?
In the citing paper
“Accumulating evidence indicates that chemotherapy, radiotherapy, angiogenesis inhibitor, stimulator of interferon genes (STING) agonist, fecal microbiota transplantation (FMT), epigenetic modulators, or other immunomodulators could synergize α-PD-1/PD-L1, by enhancing cancer antigen release, APC function, or effector activity [22–31].”
From Combination strategies with PD-1/PD-L1 blockade: current advances and future directions (2022) · cites this paper as [25]
Self-check
Percentages, sums and reported differences re-computed from the paper’s own numbers.
The self-check needs the paper’s full text.
Citations
Cites
Cancer immunotherapy using checkpoint blockade
Ribas, A., & Wolchok, J. D. (2018) · Science · doi:10.1126/science.aar4060 · Cited by 6,791
STING regulates intracellular DNA-mediated, type I interferon-dependent innate immunity
Ishikawa, H., Ma, Z., & Barber, G. N. (2009) · Nature · doi:10.1038/nature08476 · Cited by 2,759
Macrophages as regulators of tumour immunity and immunotherapy
DeNardo, D. G., & Ruffell, B. (2019) · Nature reviews. Immunology · doi:10.1038/s41577-019-0127-6 · Cited by 2,591
Regulation and function of the cGAS–STING pathway of cytosolic DNA sensing
Chen, Q., Sun, L., & Chen, Z. J. (2016) · Nature Immunology · doi:10.1038/ni.3558 · Cited by 2,333
STING-Dependent Cytosolic DNA Sensing Mediates Innate Immune Recognition of Immunogenic Tumors
Woo, S.-R., Fuertes, M. B., Corrales, L., Spranger, S., Furdyna, M. J., Leung, M. Y. K., Duggan, R., Wang, Y., Barber, G. N., Fitzgerald, K. A., et al. (2014) · Immunity · doi:10.1016/j.immuni.2014.10.017 · Cited by 1,917
Microenvironmental regulation of tumour angiogenesis
De Palma, M., Biziato, D., & Petrova, T. V. (2017) · Nature Reviews Cancer · doi:10.1038/nrc.2017.51 · Cited by 1,847
Corrales, L., Glickman, L. H., McWhirter, S. M., Kanne, D. B., Sivick, K. E., Katibah, G. E., Woo, S.-R., Lemmens, E., Banda, T., Leong, J. J., et al. (2015) · Cell Reports · doi:10.1016/j.celrep.2015.04.031 · Cited by 1,560
Neoadjuvant checkpoint blockade for cancer immunotherapy
Topalian, S. L., Taube, J. M., & Pardoll, D. M. (2020) · Science · doi:10.1126/science.aax0182 · Cited by 1,001
Matsuzaki, J., Gnjatic, S., Mhawech-Fauceglia, P., Beck, A., Miller, A., Tsuji, T., Eppolito, C., Qian, F., Lele, S., Shrikant, P., et al. (2010) · Proceedings of the National Academy of Sciences · doi:10.1073/pnas.1003345107 · Cited by 859
Mutual regulation of tumour vessel normalization and immunostimulatory reprogramming
Tian, L., Goldstein, A., Wang, H., Ching Lo, H., Sun Kim, I., Welte, T., Sheng, K., Dobrolecki, L. E., Zhang, X., Putluri, N., et al. (2017) · Nature · doi:10.1038/nature21724 · Cited by 841
Cited by
Sorted by citations
Combination strategies with PD-1/PD-L1 blockade: current advances and future directions
Yi, M., Zheng, X., Niu, M., Zhu, S., Ge, H., & Wu, K. (2022) · Molecular Cancer · doi:10.1186/s12943-021-01489-2 · Cited by 1,445
Targeting cytokine and chemokine signaling pathways for cancer therapy
Yi, M., Li, T., Niu, M., Zhang, H., Wu, Y., Wu, K., & Dai, Z. (2024) · Signal Transduction and Targeted Therapy · doi:10.1038/s41392-024-01868-3 · Cited by 528
Type I interferon-mediated tumor immunity and its role in immunotherapy
Yu, R., Zhu, B., & Chen, D. (2022) · Cellular and Molecular Life Sciences · doi:10.1007/s00018-022-04219-z · Cited by 309
“Consequently, the combination of ADU-S100 and anti-PD-1 antibody further enhanced the antitumor effect [139].”
BackgroundChen, Y., Jia, K., Sun, Y. L., Zhang, C., Li, Y., Zhang, L., Chen, Z., Zhang, J., Hu, Y., Yuan, J., et al. (2022) · Nature Communications · doi:10.1038/s41467-022-32570-z · Cited by 210
The cGAS/STING Pathway: A Novel Target for Cancer Therapy
Gan, Y., Li, X., Han, S., Liang, Q., Ma, X., Rong, P., Wang, W., & Li, W. (2022) · Frontiers in Immunology · doi:10.3389/fimmu.2021.795401 · Cited by 194
“During peritoneal metastasis, type I IFN signaling also inhibited the recruitment of CD206 M2-like macrophages (84).”
BackgroundThe cGAS‒STING pathway in cancer immunity: mechanisms, challenges, and therapeutic implications
Shen, M., Jiang, X., Qiu, P., Oyang, L., Ren, Z., Wang, J., Peng, M., Zhou, Y., Deng, X., & Liao, Q. (2025) · Journal of Hematology & Oncology · doi:10.1186/s13045-025-01691-5 · Cited by 210
“STING agonists have been shown to directly induce tumor cell death, enhance antigen processing and presentation, promote T cell activation, and remodel the tumor immune microenvironment, thereby suppressing tumor growth [34, 141, 142].”
InfluentialPericytes in the tumor microenvironment
Jiang, Z., Zhou, J., Li, L., Liao, S., He, J., Zhou, S., & Zhou, Y. (2023) · Cancer Letters · doi:10.1016/j.canlet.2023.216074 · Cited by 168
The Development of STING Agonists and Emerging Results as a Cancer Immunotherapy
Hines, J. B., Kacew, A. J., & Sweis, R. F. (2023) · Current Oncology Reports · doi:10.1007/s11912-023-01361-0 · Cited by 133
Demystifying the cGAS-STING pathway: precision regulation in the tumor immune microenvironment
Wang, Q., Yu, Y., Zhuang, J., Liu, R., & Sun, C. (2025) · Molecular Cancer · doi:10.1186/s12943-025-02380-0 · Cited by 152
“Preclinical studies using a variety of mouse tumor models have shown that intratumoral injection of ADU-S100 can induce tumor-specific CD8 + T cell responses, demonstrating exceptional anti-tumor efficacy [159, 160].”
Combining Cancer Vaccines with Immunotherapy: Establishing a New Immunological Approach
Kim, C.-G., Sang, Y. B., Lee, J. H., & Chon, H. J. (2021) · International Journal of Molecular Sciences · doi:10.3390/ijms22158035 · Cited by 78
Self-citationZhang, Y., Yang, Y., Chen, W., Mi, C., Xu, X., Shen, Y., Zheng, Z., Xu, Z., Zhao, J., Wan, S., et al. (2023) · Environment International · doi:10.1016/j.envint.2023.108237 · Cited by 77
DNA Damage and Activation of cGAS/STING Pathway Induce Tumor Microenvironment Remodeling
Shen, R., Liu, D., Wang, X., Guo, Z., Sun, H., Song, Y., & Wang, D. (2022) · Frontiers in Cell and Developmental Biology · doi:10.3389/fcell.2021.828657 · Cited by 77
“In addition, ADU-S100, one of promising agonists of STING, exhibits significant inhibition on colon tumor and ascites in the case of synergistically cooperating with anti-PD-1 and anti-COX2 (Lee et al., 2021), which is investigated in clinical phase I trials of solid tumors and lymphomas (Sivick et al.”
BackgroundTumour-associated vasculature in T cell homing and immunity: opportunities for cancer therapy
Lanitis, E., Irving, M. B., & Coukos, G. (2025) · Nature reviews. Immunology · doi:10.1038/s41577-025-01187-w · Cited by 81
“Moreover, administration of STING agonist in a colon cancer model facilitated vascular normalization and intratumoural T cell infiltration by promoting M1 macrophage polarization 160 .”
Lipid‐based nanoparticles as drug delivery systems for cancer immunotherapy
Hao, Y., Ji, Z., Zhou, H., Wu, D., Gu, Z., Wang, D., & ten Dijke, P. (2023) · MedComm · doi:10.1002/mco2.339 · Cited by 71
Zhang, L., Xin, Y., Wu, Z., Song, R., Miao, H., Zheng, W., Li, Y., Zhang, D., & Zhao, X. (2022) · Journal of Neurochemistry · doi:10.1111/jnc.15678 · Cited by 66
“Subsequently, the cGAS- STING complex phosphorylates interferon regulating factor 3 (IRF3), resulting in activation of the target genes such as type I interferon (Li et al., 2019).”
BackgroundThe molecular biology of peritoneal metastatic disease
Bootsma, S., Bijlsma, M. F., & Vermeulen, L. (2023) · EMBO Molecular Medicine · doi:10.15252/emmm.202215914 · Cited by 65
Targeting STING for cancer immunotherapy: From mechanisms to translation
Huang, R., Ning, Q., Zhao, J., Zhao, X., Zeng, L., Yi, Y., & Tang, S. (2022) · International Immunopharmacology · doi:10.1016/j.intimp.2022.109304 · Cited by 64
STING Agonists and How to Reach Their Full Potential in Cancer Immunotherapy
Gehrcken, L., Deben, C., Smits, E., & Audenaerde, J. R. M. V. (2025) · Advanced Science · doi:10.1002/advs.202500296 · Cited by 66
Targeting STING in cancer: Challenges and emerging opportunities
Zhao, K., Huang, J., Zhao, Y., Wang, S., Xu, J., & Yin, K. (2023) · Biochimica et Biophysica Acta (BBA) - Reviews on Cancer · doi:10.1016/j.bbcan.2023.188983 · Cited by 57
Kim, C. W., Chon, H. J., & Kim, C. (2021) · Cancers · doi:10.3390/cancers13194906 · Cited by 56
“A previous study showed that intratumoral STING treatment suppressed tumor growth and improved survival in a preclinical model of CRC [20,82,83].”
BackgroundSelf-citationcGAS–STING signaling pathway in gastrointestinal inflammatory disease and cancers
Ke, X., Hu, T., & Jiang, M. (2021) · The FASEB Journal · doi:10.1096/fj.202101199r · Cited by 52
He, T., Hao, Z., Lin, M., Xin, Z., Chen, Y., Ouyang, W., Yang, Q., Chen, X., Zhou, H., Zhang, W., et al. (2022) · OncoImmunology · doi:10.1080/2162402x.2022.2093054 · Cited by 54
cGAS-STING signaling pathway in intestinal homeostasis and diseases
Yang, Y., Wang, L., Peugnet-González, I., Parada‐Venegas, D., Dijkstra, G. D. H., & Faber, K. N. (2023) · Frontiers in Immunology · doi:10.3389/fimmu.2023.1239142 · Cited by 51
Liu, J., Liu, C., Ma, Y., Pan, X., Chu, R., Yao, S., Chen, J., Liu, C., Chen, Z., Sheng, C., et al. (2024) · Cancer Letters · doi:10.1016/j.canlet.2024.216700 · Cited by 51
Cancer immunotherapy strategies that target the cGAS-STING pathway
Tian, Z., Zeng, Y., Peng, Y., Liu, J., & Wu, F. (2022) · Frontiers in Immunology · doi:10.3389/fimmu.2022.996663 · Cited by 47
“These genes induce the normalization of tumor vasculature with increased pericyte coverage and more intact basement membrane, facilitating infiltration of CTLs into tumor tissue (33, 52, 53).”
BackgroundXie, Q., Liu, X., Liu, R., Pan, J., & Liang, J. (2024) · Molecular Cancer · doi:10.1186/s12943-024-02166-w · Cited by 41
“…plus αPD-1 and normalization of the intraperitoneal vascular-immune microenvironment is dependent on both CD8 + T cells and Type I IFN signaling [63] Liu et al. also confirmed that TME-responsive nanoparticles (PMM NPs) which induce STING activation augment the efficacy of αPD-1 in colon tumor…”
Peritoneal Metastasis: A Dilemma and Challenge in the Treatment of Metastatic Colorectal Cancer
Xia, W., Geng, Y., & Hu, W. (2023) · Cancers · doi:10.3390/cancers15235641 · Cited by 40
“The intraperitoneal injection of STING agonists into mice inhibited tumor cell angiogenesis and activated CD8 + T cells, which resulted in restraint of peritoneal dissemination of colon cancer, complete elimination of tumors and ascites, and induction of long-lasting anti-tumor immunity [260].”
BackgroundLee, W. S., Kim, D. S., Kim, J. H., Heo, Y., Yang, H., Go, E., Kim, J. H., Lee, S. J., Ahn, B. C., Yum, J. S., et al. (2022) · Journal for ImmunoTherapy of Cancer · doi:10.1136/jitc-2022-004799 · Cited by 39
Self-citationVicencio, J. M., Evans, R., Green, R., An, Z., Deng, J., Treacy, C. A., Mustapha, R., Monypenny, J., Costoya, C., Lawler, K., et al. (2022) · Cell Death and Disease · doi:10.1038/s41419-022-04701-3 · Cited by 33
“However, tumor-associated macrophages (TAM; or M2-like) can shift towards their classic proinflammatory phenotype (M1-like) via type-I IFN responses and activation of the cGAS/stimulator of interferon genes (STING) pathway [19], which is critical for initiating anticancer immune responses.”
BackgroundEmerging mechanisms and implications of cGAS-STING signaling in cancer immunotherapy strategies
Zhang, J., Yu, S., Peng, Q., Wang, P., & Fang, L. (2024) · Cancer Biology and Medicine · doi:10.20892/j.issn.2095-3941.2023.0440 · Cited by 38
“STING activation has been shown to reprogram TAMs into an M1 phenotype, and to transform immunologically “cold” peritoneal tumors into T cell-inflamed tumors in an IFN-α / β -dependent manner 60 .”
BackgroundLuo, J., Pang, S. S., Hui, Z., Zhao, H., Xu, S., Yu, W., Yang, L., Sun, Q., Hao, X., Wei, F., et al. (2023) · Theranostics · doi:10.7150/thno.86792 · Cited by 35
“In S100 monotherapy, intratumoral (IT) injection of S100 presented potent anti-tumor immunity in various murine tumor models [39-41].”
BackgroundBreaking barriers: The cGAS‐STING pathway as a novel frontier in cancer immunotherapy
Yan, Y., Tan, X., Song, B., Yi, M., Chu, Q., & Wu, K. (2025) · 癌症:英文版 · doi:10.1002/cac2.70067 · Cited by 35
“Reportedly, intraperitoneal administration of the STING agonist ADU-S100 significantly suppressed aberrant angiogenesis and normalized tumor vessels, which recovered effector T cell function in a type-I interferon-dependent manner [255].”
Park, H. S., Kim, Y. M., Kim, S., Lee, W. S., Kong, S. J., Yang, H., Kang, B., Cheon, J., Shin, S., Kim, C., et al. (2021) · Journal for ImmunoTherapy of Cancer · doi:10.1136/jitc-2021-003353 · Cited by 33
Self-citationHargadon, K. M. (2023) · Cellular and Molecular Life Sciences · doi:10.1007/s00018-023-04689-9 · Cited by 30
STING in cancer immunoediting: Modeling tumor-immune dynamics throughout cancer development
Zhang, X., Chen, Y., Liu, X., Li, G., Zhang, S., Zhang, Q., Cui, Z., Qin, M., Simon, H., Terzić, J., et al. (2025) · Cancer Letters · doi:10.1016/j.canlet.2024.217410 · Cited by 28
Potential therapeutic strategies for colitis and colon cancer: bidirectional targeting STING pathway
Qu, J., Cai, Y., Li, F., Li, X., & Liu, R. (2024) · EBioMedicine · doi:10.1016/j.ebiom.2024.105491 · Cited by 24
Xu, X., Yu, T., & Wang, Z. (2025) · Cancer Treatment Reviews · doi:10.1016/j.ctrv.2025.103012 · Cited by 23
Li, Z. Y., Zheng, W., Liu, Y., Cao, R., Wei, J., & Jia, H. (2025) · Journal of Experimental & Clinical Cancer Research · doi:10.1186/s13046-025-03555-9 · Cited by 22
The tumor immune microenvironment in peritoneal carcinomatosis
Demuytere, J., Ernst, S., van Ovost, J., Cosyns, S., & Ceelen, W. P. (2022) · International review of cytology · doi:10.1016/bs.ircmb.2022.04.015 · Cited by 21
Biomaterial-enabled therapeutic modulation of cGAS-STING signaling for enhancing antitumor immunity
Liu, Y., Yang, F., Wang, X., Yang, B., Li, M., & Luo, Z. Y. (2023) · Molecular Therapy · doi:10.1016/j.ymthe.2023.03.026 · Cited by 24
Shakfa, N. E., Li, D., Conseil, G., Lightbody, E. D., Wilson‐Sanchez, J., Hamade, A., Chenard, S. W., Jawa, N. A., Laight, B. J., Afriyie-Asante, A., et al. (2023) · Journal for ImmunoTherapy of Cancer · doi:10.1136/jitc-2022-006170 · Cited by 21
Go, E., Yang, H., Park, W., Lee, S. J., Han, J., Kong, S. J., Lee, W. S., Han, D. K., Chon, H. J., & Kim, C. (2023) · Small · doi:10.1002/smll.202300544 · Cited by 21
Self-citationThe battle between the innate immune cGAS-STING signaling pathway and human herpesvirus infection
Jin, X., Wang, W., Zhao, X., Jiang, W., Shao, Q., Chen, Z., & Huang, C. M. (2023) · Frontiers in Immunology · doi:10.3389/fimmu.2023.1235590 · Cited by 21
“ADUS100can normalize tumor vascularity and induce the formation of tertiary lymphoid structure in a tumor microenvironment (106), thereby promoting activated CD8+ T-cell infiltrate peritoneal tumor nodules (107).”
BackgroundTargeting the stimulator of interferon genes (STING) in breast cancer
Ying-rui, M., Bu-Fan, B., Deng, L., Rong, S., & Zhou, Q. (2023) · Frontiers in Pharmacology · doi:10.3389/fphar.2023.1199152 · Cited by 18
“Additionally, ADU-S100 in combination with PD-1/cyclooxygenase-2 blockade suppresses peritoneal dissemination of colon cancer and elicits durable tumour immunity in colon cancer (Lee et al., 2021).”
BackgroundTherapeutic challenge for immunotherapy targeting cold colorectal cancer: A narrative review
Ma, S., Li, L., Cai, H., Guo, T., & Zhang, L. (2023) · World Journal of Clinical Oncology · doi:10.5306/wjco.v14.i2.81 · Cited by 18
Role of tumor-associated macrophages in common digestive system malignant tumors
Shen, Y. G., Chen, J., Li, M., Xiang, Z., Wu, J., & Wang, Y. (2023) · World Journal of Gastrointestinal Oncology · doi:10.4251/wjgo.v15.i4.596 · Cited by 18
STINGing Cancer: Development, Clinical Application, and Targeted Delivery of STING Agonists
Nerdinger, Y. G., Binder, A. K., Bremm, F., Feuchter, N., Schaft, N., & Dörrie, J. (2025) · International Journal of Molecular Sciences · doi:10.3390/ijms26189008 · Cited by 21
“Although STING signaling has the potential to induce STAT6 expression and M2-like polarization [1,117], the reviewed data indicate a predominant polarization of macrophages into the M1-like state following STING agonist treatment [76,92,101].”
InfluentialGuo, Q., Liu, X., Jiang, N., Zhang, W.-J., Guo, S.-W., Yang, H., Ji, Y., Zhou, J. Y., Guo, J., Zhang, J., et al. (2022) · PubMed Central · Cited by 17
Self-citationThymidine phosphorylase facilitates retinoic acid inducible gene-I induced endothelial dysfunction
Baris, A. M., Fraile‐Bethencourt, E., Eubanks, J., Khou, S., & Anand, S. (2023) · Cell Death and Disease · doi:10.1038/s41419-023-05821-0 · Cited by 17
Zhao, H., Liu, Z., Tao, J., Mao, S., Wang, M., He, M., Wen, B., Gao, W., & Sun, D. (2025) · Cell chemical biology · doi:10.1016/j.chembiol.2025.01.004 · Cited by 15
He, Q., Li, X., Luo, Y., Wang, R., Zheng, C., Gao, Y., & Yao, H. (2025) · Frontiers in Immunology · doi:10.3389/fimmu.2025.1642091 · Cited by 21
Gan, L., Lin, X., Zhong, Z., Zheng, Y., Chen, X., Chen, J., Xiao, Y., Liu, Y., Pan, X., Wu, C., et al. (2025) · Acta Pharmaceutica Sinica B · doi:10.1016/j.apsb.2025.09.043 · Cited by 15
“Furthermore, the activation of STING not only polarizes TAM towards anti-tumor M1 macrophages but also reprograms M2-TAM to the M1 phenotype 138-141 .”
Wang, L., Zhu, S., Ding, Z., Hong, J., Zheng, L., Sun, J., Tang, Y., Chen, X., Yong, X., Hu, M., et al. (2026) · Journal of Translational Medicine · doi:10.1186/s12967-025-07645-2 · Cited by 16
Kim, Y., Yang, H., Lee, W. S., Cheon, J., Sang, Y. B., Kang, B., Chon, H. J., & Kim, C. (2023) · Journal of Cancer · doi:10.7150/jca.81384 · Cited by 14
“Studies on mechanisms of resistance to ICI therapies are ongoing, but are not yet fully understood [25-28].”
BackgroundSelf-citationThe cGAS-STING pathway in cancer: friend or foe
Li, Q., Song, Q., Ma, L., Kang, K., Zhu, X., Li, Y., Lin, X., Lu, X., Zeng, Z., Li, G., et al. (2026) · Cell Death and Disease · doi:10.1038/s41419-026-08607-2 · Cited by 15
“STING activation promotes polarization to the antitumor M1 phenotype, enhancing phagocytosis, antigen presentation, and pro-in fl ammatory cytokine secretion [36, 185].”
STING agonists: a range of eminent mediators in cancer immunotherapy
Wen, Z., Sun, F., Wang, R., Wang, W., Zhang, H., Yang, F., Wang, M., Wang, Y., & Li, B. (2025) · Cellular Signalling · doi:10.1016/j.cellsig.2025.111914 · Cited by 14
Keivany, M. R., Asrami, E. S., Besharatloo, M., Latifi, H., & Barjasteh, A. H. (2026) · Cancer Cell International · doi:10.1186/s12935-026-04177-7 · Cited by 14
“…pharmacologic STING agonism remodels the myeloid compartment toward an M1 phenotype, normalizes tumor vasculature, and increases intratumoral CD8 ⁺ T-cell density, thereby augmenting and sometimes restoring responsiveness to PD-1 blockade and enabling eradication of peritoneal tumors [71, 74].”
Jiang, T., Zhang, H., Li, Y., Jayakumar, P., Liao, H., Huang, H., Billiar, T. R., & Deng, M. (2022) · JCI Insight · doi:10.1172/jci.insight.160063 · Cited by 12
“The peritoneal immune environment regulates the progression of metastases and the response to ICB therapy (7).”
BackgroundAntagonism of regulatory ISGs enhances the anti-melanoma efficacy of STING agonists
Filderman, J. N., Taylor, J. L., Wang, J., Zhang, Y., Singh, P. K., Ross, M. A., Watkins, S. C., Al-Bzour, A. N., Karapetyan, L., Kaliński, P., et al. (2024) · Frontiers in Immunology · doi:10.3389/fimmu.2024.1334769 · Cited by 11
Liu, X., Cui, S., Zhang, L., Wu, S., Feng, C., Liu, B., & Yang, H. (2024) · World Journal of Surgical Oncology · doi:10.1186/s12957-024-03487-2 · Cited by 11
“In mice with peritoneal metastasis of CRC, intra-peritoneal injection of STING agonist can normalize the peritoneal immune microenvironment of mice and prevent peritoneal spread of CRC cells [16].”
BackgroundSelf-citationThe cGAS/STING Pathway—A New Potential Biotherapeutic Target for Gastric Cancer?
Tian, M., Zhang, S., & Tan, F. (2024) · Journal of Personalized Medicine · doi:10.3390/jpm14070736 · Cited by 10
“Clinical trials have further shown that MIW815, either alone or in combination with the PD-1 inhibitor Spartalizumab, improves outcomes in patients with advanced metastatic lymphoma [64,65].”
BackgroundChu, X., Bao, H., Lin, Y.-J., Chen, R., Zhang, Y., Huang, T., He, J., Huangfu, S., Pan, Y., & Ding, H. (2022) · Frontiers in Immunology · doi:10.3389/fimmu.2022.965492 · Cited by 10
Qin, X., Xu, H., Zhao, S., Kong, L., Yang, C., & Zhang, Z. (2024) · Chemical Engineering Journal · doi:10.1016/j.cej.2024.149224 · Cited by 10
Dazio, G., Epistolio, S., Frattini, M., & Saletti, P. (2022) · Journal of Clinical Medicine · doi:10.3390/jcm11247523 · Cited by 10
Wen, S., He, X., Wang, J., Wen, Z., Ai, H., Cai, M., Yang, Y. A., Li, H., Li, S., Shi, G., et al. (2025) · Biomaterials · doi:10.1016/j.biomaterials.2025.123424 · Cited by 8
Trejo, J., Koegeboehn, H., Faizuddin, F., Logan, R., Toutoungy, M., Sheikh, A. A., Fandy, T. E., Saucedo, S., Vasquez, V., Nguyen, T., et al. (2026) · Cells · doi:10.3390/cells15020136 · Cited by 10
“Reprogramming strategies using HDAC inhibitors [111], STING agonists [112], or metabolic modulators (e.g., PPAR-γ inhibitors) [113] have shown promise in shifting macrophage phenotypes toward an M1-like, tumoricidal state.”
Pharmacological activation of cGAS-STING pathway to reverse cancer drug resistance
Wang, Y., Wang, Y., Gao, Q., Zhu, Y., Li, Y., Chen, Z.-S., Zhang, J., Zhang, G., & Wang, H. (2026) · Pharmacology & Therapeutics · doi:10.1016/j.pharmthera.2026.108991 · Cited by 9
Ho, Y. K., Woo, J. Y., Loke, K. M., Deng, L., & Too, H. (2024) · Journal of Translational Medicine · doi:10.1186/s12967-024-05278-5 · Cited by 8
“Lee et al. has shown that the cGAS-STING pathway plays a critical role in converting immunologically “cold” peritoneal tumours to immuno-logically favourable phenotypes in a type I IFN-depend-ent manner, resulting in the eradication of tumour and ascites [32].”
BackgroundDong, W., Xu, L., Chang, C. J., Jiang, T., Chen, C., & Zhang, G. (2023) · Colloids and Surfaces B Biointerfaces · doi:10.1016/j.colsurfb.2023.113597 · Cited by 8
Wei, G.-X., Du, Y., Zhou, Y., Li, L., & Qiu, M. (2022) · Expert Review of Gastroenterology & Hepatology · doi:10.1080/17474124.2022.2125866 · Cited by 7
“efficacy of STING agonist was improved when combined with PD-1 and/or COX2 blockade in mouse models with PC [22].”
BackgroundMethodInfluentialShen, R., Jiang, Q., Li, P., Wang, D., Yu, C., Meng, T., Hu, F., & Yuan, H. (2023) · International Journal of Pharmaceutics · doi:10.1016/j.ijpharm.2023.123512 · Cited by 7
Decoding STING’s roles in cancer: immunity, pain, dormancy, and autophagy
Lin, H., Tang, Y., & Liang, X. (2025) · Molecular and Cellular Biochemistry · doi:10.1007/s11010-025-05281-4 · Cited by 6
Luo, S., Li, S., Liu, C., Yu, D., Sun, L., Zhang, S., Zhao, N., Zhang, M., Nie, J., Zhao, Y., et al. (2024) · Cancer Letters · doi:10.1016/j.canlet.2024.216992 · Cited by 7
A Therapeutic Vaccine in Combination with Cyclic GMP–AMP Cures More Differentiated Melanomas in Mice
Alam, M. M., Gower, T., Jiang, M., Oppenheim, J. J., & Yang, D. (2023) · The Journal of Immunology · doi:10.4049/jimmunol.2200371 · Cited by 5
Ferroptosis induction enhances anti-PD-1 efficacy in NSCLC via HIF-1α/PD-L1 modulation
Wang, Z., Liu, H., Liang, J., Zhang, Y., Cho, W. C. S., Ye, M., Ma, D., Kong, M., Zhu, C., Shen, J., et al. (2026) · Translational Oncology · doi:10.1016/j.tranon.2026.102685 · Cited by 5
“In accordance with existing research, several strategies can be employed to reinforce therapeutic effects of immune checkpoint inhibitors upon tumor cells, including chemotherapy [28], toll-like receptor agonists [29], STING agonists [30], and radiotherapy [31].”
Namakshenas, P., Crezee, J., Tuynman, J. B., Tanis, P. J., Oei, A. L., & Kok, H. P. (2025) · Journal of Drug Delivery Science and Technology · doi:10.1016/j.jddst.2024.106571 · Cited by 5
The cGAS–STING pathway in cancer immunotherapy: prognostic value and therapeutic potential
Alabi, F. A., Imodoye, S. O., Adedokun, K. A., Eltokhy, M. A., Curcic, M., Okoyeocha, E., Thapa, I., Tiwari, S., Ogundele, A. V., Ayo, T. E., et al. (2026) · Frontiers in Immunology · doi:10.3389/fimmu.2026.1760947 · Cited by 5
“Notably, combining the STING agonist with anti-PD-1 therapy signi fi cantly enhanced therapeutic ef fi cacy, resulting in the dramatic tumor regression, robust activation of CD8 + T cells, and increased in fl ammatory macrophage in fi ltration (143).”
Wei, Z.-J., Wang, L., Wang, R., Wang, Y., Chen, H., Ma, H., & Xu, Y.-J. (2025) · World Journal of Clinical Oncology · doi:10.5306/wjco.v16.i3.101251 · Cited by 4
Patel, M., Limbach, K. E., Martin, E., Burow, M. E., & Sullivan, K. M. (2025) · Journal of Surgical Oncology · doi:10.1002/jso.70090 · Cited by 3
Wang, H.-T., Yu, Y., Lo, W.-J., Lin, M., Chu, C.-L., Chen, C., Wang, S.-T., Chiu, C., Bai, E.-J., & Bai, L. (2025) · International Journal of Clinical Oncology · doi:10.1007/s10147-025-02930-y · Cited by 3
“These immature and hyperpermeable blood vessels not only promote ascites accumulation but also increase interstitial pressure, thereby impeding the penetration of anticancer drugs and immune cells into the tumor microenvironment [9, 10].”
Sun, Y., Xin, H. W., Fan, Q., Yue, X., Lin, Y., Chen, X., Xie, J., Li, P., Xing, S., Yang, C., et al. (2025) · Nature Communications · doi:10.1038/s41467-025-67026-7 · Cited by 3
“Total RNAs were extracted from Swan 71 cells, human villous tissues, and mouse placental tissues using Trizol (Invitrogen, Carlsbad, USA) 120,121 .”
Loss of ZNF408 attenuates STING-mediated immune surveillance in breast carcinogenesis
Cheng, X. L., Yu, C., Zhang, Y., Peng, Y., Liu, Y., Fa, H., Xia, L., Qin, L., Guan, S., Wu, X., et al. (2024) · iScience · doi:10.1016/j.isci.2024.110276 · Cited by 4
HIV-1 p17 matrix protein enhances type I interferon responses through the p17–OLA1–STING axis
Zhang, L., Li, S. C., Xu, X., Ma, C., Zhang, P., Ji, W., & Liu, X. (2023) · Journal of Cell Science · doi:10.1242/jcs.261500 · Cited by 3
Bady, E., Ebner, J., Mandelkow, T., Huang, Z., Neipp, M., Mofid, H., Lárusson, H., Daniels, T., Isbert, C. M., Coerper, S., et al. (2025) · Pathology · doi:10.1016/j.pathol.2025.05.008 · Cited by 2
Kothadiya, S., Cutshaw, G., Mathew, A. P., Zielinski, C., & Bardhan, R. (2026) · Nanoscale Horizons · doi:10.1039/d5nh00687b · Cited by 3
The Signaling Networks of TIM-3, TGF-β, and STING in Glioblastoma
Ahmady, F., Carnie, B. M. H., Anderson, G. E. C., Achari, E., Sharma, A., Achuthan, A. A., Kannourakis, G., & Luwor, R. B. (2026) · Cells · doi:10.3390/cells15110991 · Cited by 2
“These consist of the polarization of TAMs to M1 macrophage phenotypes [204,205], inhibiting the activity of Tregs [180,205,206], and inhibiting myeloid-derived suppressor cells (MDSCs) [207–209], decreasing immunosuppression in the TME.”
Lu, C., Zhu, W., Han, X., Du, X., Zhang, H., Yao, Q., Liu, T., & Zhang, C. (2024) · Frontiers in Oncology · doi:10.3389/fonc.2024.1492498 · Cited by 2
C5aR1 and cGAS/STING and their possible involvement in radiosensitivity of colorectal cancer
Pham, Q. T. T., Lee, P.-J., & Le, N. Q. K. (2026) · iScience · doi:10.1016/j.isci.2026.115009 · Cited by 1
“69,199,214 For instance, the incorporation of anti-PD-1 therapy into a 5-FU/oxaliplatin regimen significantly improved therapeutic outcomes in CRC models, achieving greater tumor reduction than chemotherapy alone.”
Malignant ascites as an immune organ and implications for cancer immunotherapy
Basov, D. D., Dorman, M. J., Burton, K. A., Metropulos, A. E., Munshi, H. G., & Principe, D. R. (2026) · Cancer Letters · doi:10.1016/j.canlet.2026.218533 · Cited by 1
Mechanism and Therapeutic Potential of Viral Mimicry in Cancer Immunotherapy
Kirkland, A. P., Shah, M., & Spruck, C. (2026) · Biomolecules · doi:10.3390/biom16050709 · Cited by 1
“Synthetic STING agonists, such as ADU-S100, mimic cyclic dinucleotides to activate cGAS–STING signaling downstream of cytosolic DNA sensing, promoting CD8 + T cell priming and tumor regression in mouse models [128].”
Zeng, Y., Xu, J., Wang, J., Xue, L., Liu, J., Geisler, H. C., Xu, M., Melamed, J. R., Shi, Q., Padilla, M. S., et al. (2026) · Proceedings of the National Academy of Sciences · doi:10.1073/pnas.2525718123 · Cited by 1
New Approaches Targeting Immuno-oncology and Tumor Microenvironment
Zhu, D., & He, F. (2022) · Interdisciplinary cancer research · doi:10.1007/16833_2022_89 · Cited by 1
Go, E., Yang, H., Lee, S. J., Yang, H. G., Shin, J. A., Lee, W. S., Lim, H. S., Chon, H. J., & Kim, C. (2023) · OncoImmunology · doi:10.1080/2162402x.2023.2259212 · Cited by 1
“Immune profiling was performed with a digital multiplexed NanoString nCounter PanCancer Immune Profiling mouse panel (NanoString Technologies) using 100 ng of total RNA isolated from tumor samples as previously described.(30,31) Data analysis was performed using nSolver software (NanoString Technologies), as previousl…”
MethodSelf-citationShakfa, N. E., Li, D., Conseil, G., Lightbody, E. D., Wilson‐Sanchez, J., Hamade, A., Chenard, S. W., Laight, B. J., Afriyie-Asante, A., Tyryshkin, K., et al. (2022) · bioRxiv (Cold Spring Harbor Laboratory) · doi:10.1101/2022.06.27.497846 · Cited by 1
Bella, Á. (2024) · Deposito Adademico Digital Universidad De Navarra (University of Navarra) · doi:10.15581/10171/69184
He, Q., Sheng, N., Wang, J., Gong, J., Gu, Y., Liu, Z., Jiao, Q., Chen, H., Zhang, Z., & Wang, Z. (2025) · Research Square · doi:10.21203/rs.3.rs-6741598/v1
Mo, Q., Chang, R., Zhang, L., Huang, L., Huang, W., Liang, X., Xue, X., Zhang, Q., Hou, X., Yc, L., et al. (2025) · bioRxiv (Cold Spring Harbor Laboratory) · doi:10.1101/2025.10.25.683839
“STING is a key immune regulator influencing macrophage differentiation and phagocytosis 40,41 .”
Ho, Y. K., Woo, J. Y., Loke, K. M., Deng, L.-W., & Too, H. (2024) · Figshare · doi:10.6084/m9.figshare.26721213
Ho, Y. K., Woo, J. Y., Loke, K. M., Deng, L.-W., & Too, H. (2024) · Figshare · doi:10.6084/m9.figshare.26721225
Ho, Y. K., Woo, J. Y., Loke, K. M., Deng, L.-W., & Too, H. (2024) · Figshare · doi:10.6084/m9.figshare.26721201
Metadata
- Authors
- Lee, S. J., Yang, H., Kim, W. R., Lee, Y. S., Lee, W. S., Kong, S. J., Lee, H. J., Kim, J. H., Cheon, J., Kang, B., Chon, H. J., & Kim, C.
- Affiliations
- CHA University (KR)
- CHA University Bundang Medical Center (KR)
- Corresponding author
- Chon, Hong Jae
- Kim, Chan
- ORCID
- Venue
- Journal for ImmunoTherapy of Cancer
- Publisher
- BMJ
- Published
- 2021-06
- Volume
- 9
- Issue
- 6
- Pages
- e002195
- ISSN
- 2051-1426 (ISSN-L)
- PMC
- PMC8215239
- OpenAlex
- W3168539558
- Cited by
- 118
- References
- 50
- Citations by year
- 2026: 24 · 2025: 23 · 2024: 24 · 2023: 24 · 2022: 19 · 2021: 4
- FWCI
- 6.47
- Type
- journal article
- Language
- en
- Open access
- gold
- doi.org
- Locations
- Journal for ImmunoTherapy of Cancer (publishedVersion, cc-by)
- PubMed Central (publishedVersion, cc-by)
- PubMed (publishedVersion)
- DOAJ (DOAJ: Directory of Open Access Journals) (submittedVersion, cc-by-sa)
- Funders
- Korea Medical Device Development Fund (202012D21-01)
- National Research Foundation of Korea (NRF-2020R1A2C2004530, NRF-2020R1C1C1010722)
- Topics
- Health Sciences › Medicine › Oncology › Cancer Immunotherapy and Biomarkers
- Life Sciences › Immunology and Microbiology › Immunology › interferon and immune responses
- Health Sciences › Medicine › Surgery › Intraperitoneal and Appendiceal Malignancies
- Keywords
- STING activation, peritoneal carcinomatosis, colon cancer, vascular normalization, tumor microenvironment, M2 macrophages, M1 macrophage polarization, anti-PD-1 therapy, type I interferon, angiogenesis, pericyte coverage, CD8+ T cell infiltration, immune evasion, immunotherapy
- MeSH terms
- STING Protein, Animals, Colonic Neoplasms, Disease Models, Animal, Humans, Immunotherapy, Membrane Proteins, Peritoneal Neoplasms, Cell Line, Tumor, Mice, Tumor Microenvironment
About these checks
Registry, retraction, Cites and statistics results are computed, not judged, with one exception: a printed reference that no index lists is read once by a model before it counts as a citation error. Claims are extracted by a model and kept only when their quote appears verbatim in the text; each cited source is then checked, with a model’s help, for whether it says what the claim relies on. Those verdicts can be wrong — read the claim’s quote and the cited source before relying on one.
Statistics and arithmetic are recomputed, not judged.
Confidence bands are shown only for fields calibrated on our annotated test set. None is calibrated yet, so no band is shown.
What counts as a claim ›How we measure confidence ›How we check this ›
Are you an author, or do you see a problem with this page? Request a review
