

The DOI matches its Crossref record; 68 of the 70 references it cites were found in a registry or an index.
Diffusion tensor imaging studies of mild traumatic brain injury: a meta-analysis
Open accessAbstract
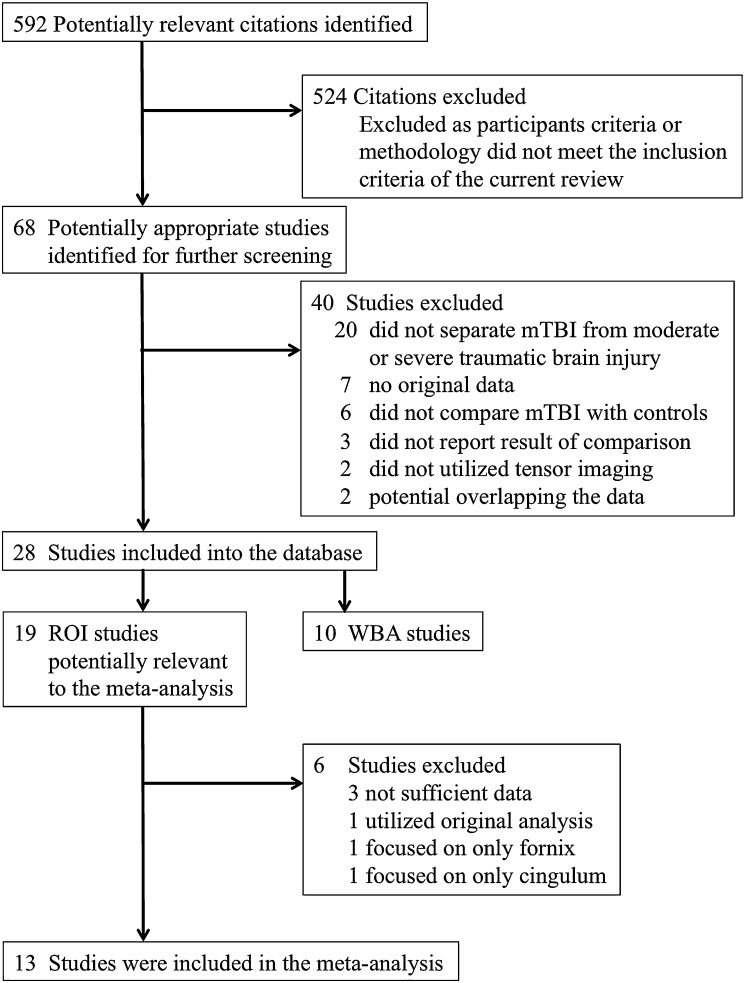
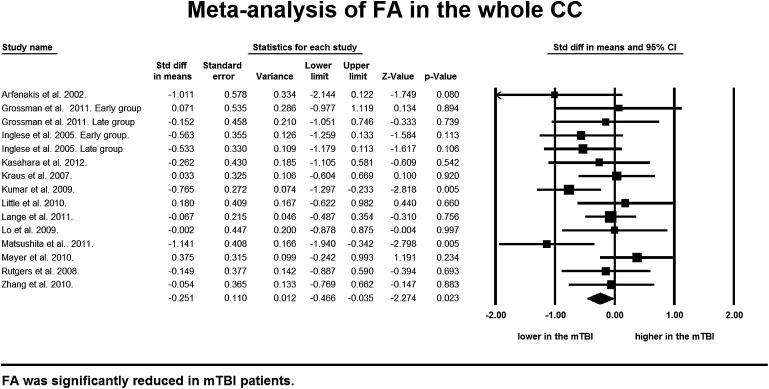
OBJECTIVES: To assess the possibility that diffusion tensor imaging (DTI) can detect white matter damage in mild traumatic brain injury (mTBI) patients via systematic review and meta-analysis. METHODS: DTI studies that compared mTBI patients and controls were searched using MEDLINE, Web of Science, and EMBASE, (1980 through April 2012). RESULTS: A comprehensive literature search identified 28 DTI studies, of which 13 independent DTI studies of mTBI patients were eligible for the meta-analysis. Random effect model demonstrated significant fractional anisotropy (FA) reduction in the corpus callosum (CC) (p=0.023, 95% CIs -0.466 to -0.035, 280 mTBIs and 244 controls) with no publication bias and minimum heterogeneity, and a significant increase in mean diffusivity (MD) (p=0.015, 95% CIs 0.062 to 0.581, 154 mTBIs and 100 controls). Meta-analyses of the subregions of the CC demonstrated in the splenium FA was significantly reduced (p=0.025, 95% CIs -0.689 to -0.046) and MD was significantly increased (p=0.013, 95% CIs 0.113 to 0.950). FA was marginally reduced in the midbody (p=0.099, 95% CIs -0.404 to 0.034), and no significant change in FA (p=0.421, 95% CIs -0.537 to 0.224) and MD (p=0.264, 95% CIs -0.120 to 0.438) in the genu of the CC. CONCLUSIONS: Our meta-analysis revealed the posterior part of the CC was more vulnerable to mTBI compared with the anterior part, and suggested the potential utility of DTI to detect white matter damage in the CC of mTBI patients.
Overview
The claims and statistics of this paper haven’t been checked yet.
Run the check — free, no account needed. It reads the open-access text and checks the sources it cites.
Integrity signals
Registry
Cites
Statistics
Figures
Verification
Claims the paper makes
The claims and statistics of this paper haven’t been checked yet.
Run the check — free, no account needed. It reads the open-access text and checks the sources it cites.
Claims other papers make about this one
Each is checked against this paper’s own text: does it say what the citing paper says it does?
In the citing paper
“Diffusion tensor imaging (DTI), however, provides information about the white matter microstructure and fiber tract integrity and is emerging as a valuable tool in refining the diagnosis, prognosis, and management of mTBI [5, 149, 196].”
From The neuropathology of sport (2014) · cites this paper as [5]
Self-check
Percentages, sums and reported differences re-computed from the paper’s own numbers.
The self-check needs the paper’s full text.
Citations
Cites
Cochrane Handbook for Systematic Reviews of Interventions: Cochrane Book Series
(2008) · doi:10.1002/9780470712184 · Cited by 25,048
Dermyshi, E., Wang, Y., Yan, C., Hong, W., Qiu, G., Gong, X., & Zhang, T. (2017) · Neonatology · doi:10.1159/000454668 · Cited by 24,586
Meta-analysis of Observational Studies in Epidemiology<SUBTITLE>A Proposal for Reporting</SUBTITLE>
Stroup, D. F. (2000) · JAMA · doi:10.1001/jama.283.15.2008 · Cited by 20,623
Tract-based spatial statistics: Voxelwise analysis of multi-subject diffusion data
Smith, S. M., Jenkinson, M., Johansen‐Berg, H., Rueckert, D., Nichols, T. E., Mackay, C. E., Watkins, K. E., Ciccarelli, O., Cader, M. Z., Matthews, P. M., et al. (2006) · NeuroImage · doi:10.1016/j.neuroimage.2006.02.024 · Cited by 6,598
Cochrane Handbook for Systematic Reviews of Interventions
Higgins, J. P. T., Green, S., & Ben Van Den, A. (2020) · International Coaching Psychology Review · doi:10.53841/bpsicpr.2020.15.2.123 · Cited by 5,670
Ghajar, J. (2000) · The Lancet · doi:10.1016/s0140-6736(00)02689-1 · Cited by 2,244
Position statement: definition of traumatic brain injury
Menon, D. K., Schwab, K., Wright, D. W., & Maas, A. I. (2010) · Archives of Physical Medicine and Rehabilitation · doi:10.1016/j.apmr.2010.05.017 · Cited by 1,678
Diffuse axonal injury and traumatic coma in the primate
Gennarelli, T. A., Thibault, L. E., Adams, J. H., Graham, D. I., Thompson, C. J., & Marcincin, R. P. (1982) · Annals of Neurology · doi:10.1002/ana.410120611 · Cited by 1,528
Activation Likelihood Estimation meta-analysis revisited
Eickhoff, S., Bzdok, D., Laird, A., Kurth, F., & Fox, P. (2011) · NeuroImage · doi:10.1016/j.neuroimage.2011.09.017 · Cited by 1,448
Kraus, M. F., Susmaras, T. M., Caughlin, B., Walker, C. J., Sweeney, J. A., & Little, D. M. (2007) · Brain · doi:10.1093/brain/awm216 · Cited by 994
Cited by
Sorted by citations
Items 101–200 of 236
Mohammadian, M., Roine, T., Hirvonen, J., Kurki, T., Posti, J., Katila, A., Takala, R., Tallus, J., Maanpää, H.-R., Frantzén, J., et al. (2020) · Journal of Neurotrauma · doi:10.1089/neu.2020.7081 · Cited by 20
A Mechanistic End-to-End Concussion Model That Translates Head Kinematics to Neurologic Injury
Ng, L. J., Volman, V., Gibbons, M. M., Phohomsiri, P., Cui, J., Swenson, D. J., & Stuhmiller, J. H. (2017) · Frontiers in Neurology · doi:10.3389/fneur.2017.00269 · Cited by 24
Terry, D. P., Mewborn, C. M., & Miller, L. S. (2019) · Journal of the International Neuropsychological Society · doi:10.1017/s1355617719000754 · Cited by 22
Functional Magnetic Resonance Imaging in Court
Gaudet, L. M., Lushing, J. R., & Kiehl, K. A. (2014) · AJOB Neuroscience · doi:10.1080/21507740.2014.884192 · Cited by 19
Exposure to Surgery and Anesthesia After Concussion Due to Mild Traumatic Brain Injury
Abcejo, A. S., Savica, R., Lanier, W. L., & Pasternak, J. J. (2017) · Mayo Clinic Proceedings · doi:10.1016/j.mayocp.2017.03.012 · Cited by 19
Hunter, L. E., Lubin, N., Glassman, N. R., Xue, X., Spira, M., & Lipton, M. L. (2018) · Journal of Neurotrauma · doi:10.1089/neu.2018.5838 · Cited by 19
Hurtubise, J. M., Gorbet, D. J., Hynes, L. M., Macpherson, A., & Sergio, L. E. (2020) · Journal of Neurotrauma · doi:10.1089/neu.2019.6765 · Cited by 20
Kawata, K., Steinfeldt, J. A., Huibregtse, M. E., Nowak, M. K., Macy, J. T., Kercher, K. A., Rettke, D. J., Shin, A., Chen, Z., Ejima, K., et al. (2020) · Frontiers in Neurology · doi:10.3389/fneur.2020.581781 · Cited by 19
Womack, K. B., Paliotta, C., Strain, J. F., Ho, J. S., Skolnick, Y., Lytton, W. W., Turtzo, L. C., McColl, R. W., Diaz-Arrastia, R. R., & Bergold, P. J. (2016) · Journal of Neurotrauma · doi:10.1089/neu.2016.4670 · Cited by 19
McCunn, P., Xu, X., Moszczynski, A. J., Li, A., Brown, A. M., & Bartha, R. (2021) · Journal of Neuroimaging · doi:10.1111/jon.12917 · Cited by 18
TractLearn: A geodesic learning framework for quantitative analysis of brain bundles
Attyé, A., Renard, F., Baciu, M. V., Roger, É., Lamalle, L., Dehail, P., Cassoudesalle, H., & Calamante, F. (2021) · NeuroImage · doi:10.1016/j.neuroimage.2021.117927 · Cited by 18
Harrington, D. L., Hsu, P., Theilmann, R. J., Angeles‐Quinto, A., Robb, A., Nichols, S., Song, T., Le, L., Rimmele, C. T., Matthews, S. C., et al. (2022) · Diagnostics · doi:10.3390/diagnostics12040987 · Cited by 18
Oehr, L. E., Yang, J. Y., Chen, J., Maller, J. J., Seal, M. L., & Anderson, J. F. I. (2020) · Journal of Neurotrauma · doi:10.1089/neu.2020.7310 · Cited by 18
Mahan, M. Y., Rafter, D., Truwit, C. L., Oswood, M. C., & Samadani, U. (2020) · Magnetic Resonance Imaging · doi:10.1016/j.mri.2020.12.012 · Cited by 17
Blast-Related Mild Traumatic Brain Injury: Neuropsychological Evaluation and Findings
Nelson, N. W., Davenport, N. D., Sponheim, S. R., & Anderson, C. R. (2015) · UST Research Online (University of St. Thomas - Minnesota) · Cited by 17
Liang, W., Han, B. R., Hai, Y., Yin, P., Chen, Y., & Zou, C. (2020) · European Spine Journal · doi:10.1007/s00586-020-06556-8 · Cited by 16
Sport-Related Traumatic Brain Injury
Clark, M., & Guskiewicz, K. M. (2015) · Frontiers in neuroscience · doi:10.1201/b18959-3 · Cited by 16
Næss‐Schmidt, E. T., Blicher, J. U., Tietze, A., Rask, C. U., Svendsen, S. W., Schröder, A., Thastum, M. M., Tuborgh, A. H., Frederiksen, O.-V., Østergaard, L., et al. (2017) · Brain Injury · doi:10.1080/02699052.2017.1377352 · Cited by 17
The Chaos of Combat: An Overview of Challenges in Military Mild Traumatic Brain Injury Research
Davenport, N. D. (2016) · Frontiers in Psychiatry · doi:10.3389/fpsyt.2016.00085 · Cited by 16
Białuńska, A., & Salvatore, A. P. (2017) · Brain and Behavior · doi:10.1002/brb3.874 · Cited by 17
Douglas, D., Muldermans, J., & Wintermark, M. (2018) · Current Opinion in Neurology · doi:10.1097/wco.0000000000000567 · Cited by 17
Grant, M., Liu, J., Wintermark, M., Bağcı, U., & Douglas, D. (2023) · Neuroimaging Clinics of North America · doi:10.1016/j.nic.2023.01.004 · Cited by 15
Clark, A. L., Sorg, S. F., Schiehser, D. M., Bigler, E. D., Bondi, M. W., Jacobson, M. W., Jak, A. J., & Delano‐Wood, L. (2015) · Journal of Head Trauma Rehabilitation · doi:10.1097/htr.0000000000000183 · Cited by 16
Internationale Klassifikation von Kopfschmerzerkrankungen
Göbel, H., & Evers, S. (2019) · Nervenheilkunde · doi:10.1055/a-0930-5739 · Cited by 15
Jain, B., Das, A. K., Agrawal, M., Babal, R., & Purohit, D. K. (2021) · Child s Nervous System · doi:10.1007/s00381-021-05240-6 · Cited by 15
Aoki, A., Aoki, Y. Y., & Harima, H. (2012) · Translational Psychiatry · doi:10.1038/tp.2012.98 · Cited by 15
Self-citationKushner, D. S. (2015) · Neural Regeneration Research · doi:10.4103/1673-5374.158329 · Cited by 15
Advances in imaging explosive blast mild traumatic brain injury
Hetherington, H. P., Bandak, A., Ling, G. S. F., & Bandak, F. A. (2015) · Handbook of clinical neurology · doi:10.1016/b978-0-444-52892-6.00020-9 · Cited by 15
Deleterious effect of sustained neuroinflammation in pediatric traumatic brain injury
Jacquens, A., Csaba, Z., Soleimanzad, H., Bokobza, C., Delmotte, P.-R., Userovici, C., Boussemart, P., Chhor, V., Bouvier, D., van de Looij, Y., et al. (2024) · Brain Behavior and Immunity · doi:10.1016/j.bbi.2024.04.029 · Cited by 15
Kobeissy, F. H. (2015) · CRC Press eBooks · doi:10.1201/b18126-30 · Cited by 14
Tóth, A. (2015) · CRC Press/Taylor & Francis, Boca Raton (FL) eBooks · Cited by 14
Gimbel, S. I., Hungerford, L. D., Twamley, E. W., & Ettenhofer, M. L. (2023) · Journal of Neurotrauma · doi:10.1089/neu.2023.0336 · Cited by 13
Thomas, A. W., Watts, R., Filippi, C. G., Nickerson, J. P., Andrews, T. J., Lieberman, G., Naylor, M. R., Eppstein, M. J., & Freeman, K. (2017) · PLoS ONE · doi:10.1371/journal.pone.0178360 · Cited by 13
Abdelrahman, H. A. F., Ubukata, S., Ueda, K., Fujimoto, G., Oishi, N., Aso, T., & Murai, T. (2022) · Neuropsychiatric Disease and Treatment · doi:10.2147/ndt.s354265 · Cited by 14
White Matter Alterations in Military Service Members With Remote Mild Traumatic Brain Injury
Kim, S. Y., Ollinger, J. M., Song, C., Raiciulescu, S., Seenivasan, S., Wolfgang, A. S., Kim, H., Werner, J. K., & Yeh, P. (2024) · JAMA Network Open · doi:10.1001/jamanetworkopen.2024.8121 · Cited by 14
Alcohol Consumption Does not Impede Recovery from Mild to Moderate Traumatic Brain Injury
Silverberg, N. D., Panenka, W. J., Iverson, G. L., Brubacher, J. R., Shewchuk, J. R., Heran, M. K. S., Oh, G. C. S., Honer, W. G., & Lange, R. T. (2016) · Journal of the International Neuropsychological Society · doi:10.1017/s1355617716000692 · Cited by 12
Spatiotemporal profile of atrophy in the first year following moderate‐severe traumatic brain injury
Brennan, D. J., Duda, J., Ware, J. B., Whyte, J., Choi, J. Y., Gugger, J. J., Focht, K., Walter, A. E., Bushnik, T. L., Gee, J. C., et al. (2023) · Human Brain Mapping · doi:10.1002/hbm.26410 · Cited by 11
Emotional Regulation and Adolescent Concussion: Overview and Role of Neuroimaging
Santos, J. P. L., Jia-Richards, M., Kontos, A., Collins, M., & Versace, A. (2023) · International Journal of Environmental Research and Public Health · doi:10.3390/ijerph20136274 · Cited by 13
Hilz, M. J., Wang, R., Liu, M., Muresanu, D. F., Flanagan, S. R., Winder, K., Hösl, K. M., & Hummel, T. R. (2019) · Journal of Neurotrauma · doi:10.1089/neu.2018.6215 · Cited by 12
Turner, S. B., Lazarus, R. C., Marion, D. W., & Main, K. (2021) · Journal of Neurotrauma · doi:10.1089/neu.2020.7259 · Cited by 11
Diaz-Pacheco, V., Vargas‐Medrano, J., Tran, E., Nicolas, M., Price, D., Patel, R., Tonarelli, S., & Gadad, B. S. (2022) · Journal of Alzheimer s Disease · doi:10.3233/jad-215158 · Cited by 11
CT, MRI, and PET Imaging in Patients with Traumatic Brain Injury
Patil, S., Subtirelu, R. C., Teichner, E. M., Kata, R., Gerlach, A. L., Ayubcha, C., Alnemri, A. G., Werner, T. J., Alavi, A. A., & Newberg, A. B. (2024) · PET Clinics · doi:10.1016/j.cpet.2024.09.002 · Cited by 10
Liu, C., Li, H., Wang, L., Zhu, L., Jiang, X., Yang, M., Li, B., Zhang, C., Yang, H., & Xu, X. X. (2018) · Clinical Radiology · doi:10.1016/j.crad.2018.08.015 · Cited by 10
Xu, L., Chang, S., Yang, L., & Zhang, L. (2020) · Clinical Neurology and Neurosurgery · doi:10.1016/j.clineuro.2020.106442 · Cited by 10
Microstructural changes in the brain after long‐term post‐concussion symptoms: A randomized trial
Næss‐Schmidt, E. T., Blicher, J. U., Thastum, M. M., Rask, C. U., Svendsen, S. W., Schröder, A., Tuborgh, A. H., Østergaard, L., Sangill, R., Lund, T. E., et al. (2020) · Journal of Neuroscience Research · doi:10.1002/jnr.24773 · Cited by 9
Asturias, A., Knoblauch, T., Rodriguez, A., Vanier, C. H., Tohic, C. L., Barrett, B., Eisenberg, M., Gibbert, R., Zimmerman, L., Parikh, S., et al. (2023) · Frontiers in Neuroimaging · doi:10.3389/fnimg.2023.1153115 · Cited by 9
Shinoda, J., & Asano, Y. (2017) · Neurologia medico-chirurgica · doi:10.2176/nmc.ra.2016-0293 · Cited by 9
To, X. V., Benetatos, J., Soni, N., Liu, D., Abraha, H. M., Yan, W., Panagiotopoulou, O., & Nasrallah, F. A. (2020) · Journal of Neurotrauma · doi:10.1089/neu.2019.6944 · Cited by 9
A population‐based study of head injury, cognitive function and pathological markers
James, S., Nicholas, J. M., Lane, C., Parker, T. D., Lu, K., Keshavan, A., Buchanan, S. M., Keuss, S. E., Murray‐Smith, H., Wong, A., et al. (2021) · Annals of Clinical and Translational Neurology · doi:10.1002/acn3.51331 · Cited by 9
Cognitive performance in older adults at three months following mild traumatic brain injury
Gryffydd, L., Mitra, B., Wright, B. J., & Kinsella, G. (2021) · Journal of Clinical and Experimental Neuropsychology · doi:10.1080/13803395.2021.1933915 · Cited by 10
A meta‐analysis of the role of diffusion tensor imaging in cervical spinal cord compression
Ouyang, Z., Zhang, N., Li, M., Hong, T., Ouyang, T., & Meng, W. (2023) · Journal of Neuroimaging · doi:10.1111/jon.13093 · Cited by 8
Rate of abnormalities in quantitative MR neuroimaging of persons with chronic traumatic brain injury
Rahmani, F., Batson, R. D., Zimmerman, A., Reddigari, S., Bigler, E. D., Lanning, S. C., Ilasa, E., Grafman, J. H., Lu, H., Lin, A. P., et al. (2024) · BMC Neurology · doi:10.1186/s12883-024-03745-6 · Cited by 9
Emerging MRI and metabolic neuroimaging techniques in mild traumatic brain injury
Li, W., Lu, L., Wei, X., Li, M., & Li, Y. (2014) · Neurology India · doi:10.4103/0028-3886.144434 · Cited by 8
Microstructure of the Corpus Callosum Long after Pediatric Concussion
Sohn, M. N., Virani, S., Carlson, H. L., MacPhail, S., Low, T. A., Plourde, V., Yeates, K. O., Lebel, C. A., & Brooks, B. L. (2020) · Journal of the International Neuropsychological Society · doi:10.1017/s1355617720000223 · Cited by 8
Lin, J. C., Mueller, C., Campbell, K. A., Thannickal, H. H., Daredia, A., Sheriff, S., Maudsley, A. A., Brunner, R. C., & Younger, J. (2021) · PM&R · doi:10.1002/pmrj.12623 · Cited by 8
Wang, Z., Ding, J., Li, X., Shi, L., Yin, B., Bai, G., Fang, M., Lao, L., Tian, J., & Bai, L. (2025) · Radiology · doi:10.1148/radiol.250315 · Cited by 8
Latini, F., Fahlström, M., Vedung, F., Stenson, S., Larsson, E., Lubberink, M., Tegner, Y., Haller, S., Johansson, J., Wall, A. E., et al. (2022) · Journal of Clinical Medicine · doi:10.3390/jcm11020358 · Cited by 7
Exaggerated reaction to novelty as a subclinical consequence of mild traumatic brain injury
Suchy, Y., Euler, M. J., & Eastvold, A. D. (2014) · Brain Injury · doi:10.3109/02699052.2014.888766 · Cited by 7
Silver, J. (2012) · American Journal of Psychiatry · doi:10.1176/appi.ajp.2012.12091230 · Cited by 7
Cortical Gyrification Morphology in Adult Males with Mild Traumatic Brain Injury
Gharehgazlou, A., Jetly, R., Rhind, S., Reichelt, A., da Costa, L., & Dunkley, B. (2022) · Neurotrauma Reports · doi:10.1089/neur.2021.0032 · Cited by 6
Kalkstein, S., Scott, J. C., Biester, R. C., Brownlow, J. A., Harpaz‐Rotem, I., & Gur, R. C. (2016) · Applied Neuropsychology Adult · doi:10.1080/23279095.2015.1119693 · Cited by 7
Assessing Postconcussive Reaction Time Using Transport-Based Morphometry of Diffusion Tensor Images
Kundu, S., Ghodadra, A. G., Fakhran, S., Alhilali, L. M., & Rohde, G. K. (2019) · American Journal of Neuroradiology · doi:10.3174/ajnr.a6087 · Cited by 6
A cross‐comparative analysis of in vivo versus ex vivo MRI indices in a mouse model of concussion
Vinh To, X., Kurniawan, N. D., Cumming, P., & Nasrallah, F. A. (2023) · Brain Research · doi:10.1016/j.brainres.2023.148562 · Cited by 5
Zane, K. L., Gfeller, J. D., Roskos, P. T., Stout, J., Buchanan, T. W., Malone, T. M., & Bucholz, R. D. (2021) · Brain Injury · doi:10.1080/02699052.2021.1887521 · Cited by 5
Impaired Visual Integration in Children with Traumatic Brain Injury: An Observational Study
Königs, M., Weeda, W. D., van Heurn, E. L. W., Vermeulen, R. J., Goslings, J. C., Luitse, J. S. K., Poll‐The, B. T., Beelen, A., van der Wees, M., Kemps, R. J. J. K., et al. (2015) · PLoS ONE · doi:10.1371/journal.pone.0144395 · Cited by 5
Haider, M. N., & Bezherano, I. (2019) · IntechOpen eBooks · doi:10.5772/intechopen.85432 · Cited by 5
Blast-Related Mild Traumatic Brain Injury: Neuropsychological Evaluation and Findings
Kobeissy, F. H. (2015) · CRC Press eBooks · doi:10.1201/b18126-39 · Cited by 5
Chen, Y.-N., Hoffmann, J., Syeda, W., Mito, R., & Moffat, B. A. (2026) · NeuroImage: Clinical · doi:10.1016/j.nicl.2026.104024 · Cited by 3
Anderson, J. F. I., Oehr, L. E., Chen, J., Maller, J. J., Seal, M. L., & Yang, J. Y. (2023) · Frontiers in Neurology · doi:10.3389/fneur.2023.1278908 · Cited by 4
Patil, S., Karabacak, M., Aydin, S., Sagi, I., Soddu, A., Ozkara, B. B., Margetis, K. D., & Bisdas, S. (2025) · Journal of Neurotrauma · doi:10.1177/08977151251363258 · Cited by 7
Jacquens, A., Delmotte, P.-R., Gourbeix, C., Farny, N., Liaudet, B. P., Hijazi, D., Batisti, V., Torkomian, G., Cassereau, D., Debarle, C., et al. (2023) · Annals of Physical and Rehabilitation Medicine · doi:10.1016/j.rehab.2023.101783 · Cited by 4
Suchy, Y., Franchow, E. I., Niermeyer, M. A., Ziemnik, R. E., Williams, P., & Pennington, N. N. (2018) · Journal of Clinical and Experimental Neuropsychology · doi:10.1080/13803395.2018.1457627 · Cited by 4
Feedback learning and behavior problems after pediatric traumatic brain injury
Königs, M., van Heurn, E. L. W., Vermeulen, R. J., Goslings, J. C., Luitse, J. S. K., Poll‐The, B. T., Beelen, A., van der Wees, M., Kemps, R. J. J. K., Catsman‐Berrevoets, C. E., et al. (2016) · Psychological Medicine · doi:10.1017/s0033291716000106 · Cited by 5
Bognár, D., Petneházy, Z., Laár, P., Doczi, T. P., Schwarcz, A., Környei, B. S., & Tóth, A. (2025) · Frontiers in Neurology · doi:10.3389/fneur.2025.1630427 · Cited by 3
Chung, S., Bacon, T. E., Rath, J. F., Alivar, A., Coelho, S., Amorapanth, P. X., Fieremans, E., Novikov, D. S., Flanagan, S. R., Bacon, J. H., et al. (2024) · American Journal of Neuroradiology · doi:10.3174/ajnr.a8213 · Cited by 3
Blast-Related Mild Traumatic Brain Injury
Nelson, N. W., Davenport, N. D., Sponheim, S. R., & Anderson, C. R. (2015) · Cited by 3
Advanced neuroimaging in the clinic: critical appraisal of the evidence base
Fink, A. Z., Mogil, L. B., & Lipton, M. L. (2016) · British Journal of Radiology · doi:10.1259/bjr.20150753 · Cited by 3
Brain Imaging in Traumatic Brain Injury
Alves, T. I. (2017) · Elsevier eBooks · doi:10.1016/b978-0-12-804064-5.00007-2 · Cited by 3
Genetics of brain networks and connectivity
Dennis, E. L., Thompson, P. M., & Jahanshad, N. (2018) · Elsevier eBooks · doi:10.1016/b978-0-12-813838-0.00008-x · Cited by 3
van Velkinburgh, J. C., Herbst, M. D., & Casper, S. M. (2023) · World Journal of Clinical Cases · doi:10.12998/wjcc.v11.i19.4477 · Cited by 3
Clarifying the Robust Foundation for and Appropriate Use of DTI in mTBI Patients
Lipton, M. L., & Bigler, E. D. (2014) · AJOB Neuroscience · doi:10.1080/21507740.2014.884191 · Cited by 3
White matter abnormalities in blast mild traumatic brain injury in the military
Cogan, A. M. (2015) · Journal of Occupational Science · doi:10.1080/14427591.2015.1113494 · Cited by 3
Christensen, B. A., Clark, B., Muir, A. M., Allen, W., Corbin, E. M., Jaggi, T., Alder, N. N., Clawson, A., Farrer, T. J., Bigler, E. D., et al. (2023) · Frontiers in Human Neuroscience · doi:10.3389/fnhum.2023.1161156 · Cited by 2
Yeung, A., & Rapoport, M. J. (2020) · Brain Injury · doi:10.1080/02699052.2020.1805125 · Cited by 2
The role of diffusion tensor imaging in idiopathic sensorineural hearing loss: is it significant?
Mahmoud, W., Elshawaf, W., & Tawfik, A. M. (2021) · Polish Journal of Radiology · doi:10.5114/pjr.2021.108372 · Cited by 2
Walter, A. E., Savalia, K. K., Yoon, J. T., Morrison, J., Schneider, A. L. C., Diaz-Arrastia, R. R., & Sandsmark, D. K. (2024) · Neurotrauma Reports · doi:10.1089/neur.2024.0026 · Cited by 3
Diffusion Tensor Imaging in Traumatic Brain Injury
Sener, S., Parizel, P. M., & Maas, A. I. R. (2015) · Springer eBooks · doi:10.1007/978-1-4939-3118-7_19 · Cited by 2
Pecoul, T., Renard, A., Foucher, S., Guitierrez, D. F., Sellier, A., & Dagain, A. (2018) · Journal de Traumatologie du Sport · doi:10.1016/j.jts.2018.09.002 · Cited by 2
To, X. V., Vegh, V., Owusu-Amoah, N., Cumming, P. D., & Nasrallah, F. A. (2023) · Experimental Neurology · doi:10.1016/j.expneurol.2023.114406 · Cited by 2
MRI biomarkers in mild traumatic brain injury
Hähnel, S., & Herweh, C. (2015) · Neurology · doi:10.1212/wnl.0000000000001244 · Cited by 2
Bunnage, M. (2013) · Social Care and Neurodisability · doi:10.1108/scn-03-2013-0010 · Cited by 1
Moazamian, D., Xie, S., Athertya, J., Tang, Q., Lee, R. R., Chang, E. Y., Tomlin, J. M., Johnson, C. E., Du, J., & Ma, Y. (2025) · International Journal of Molecular Sciences · doi:10.3390/ijms26125431 · Cited by 1
Karr, J. E., Powell, D. K., White, A. E., Leong, S. E., Maisel, M. T., & Bahrani, A. A. (2025) · Journal of Neurotrauma · doi:10.1177/08977151251360777 · Cited by 2
Investigating microbleeds and white matter hyperintensities in TBI at a tract-level: A DTI study
Petneházy, Z., Bognár, D., Laar, P., Doczi, T. P., Schwarcz, A., Környei, B. S., & Tóth, A. (2025) · Magnetic Resonance Imaging · doi:10.1016/j.mri.2025.110541 · Cited by 1
Quantified Head-Ball Impacts in Soccer: A Preliminary, Prospective Study
McCloskey, H., McNabb, C. B., Laguna, P. A. L., Keenan, B. E., Evans, J., Jones, D. K., Palombo, M., Barnes-Wood, M., Adams, R., Connelly, S., et al. (2025) · Neurotrauma Reports · doi:10.1177/2689288x251380145 · Cited by 2
Bergamino, M., Ott, L. R., McElvogue, M. M., Jha, R. M., Moreno, C., & Stokes, A. M. (2025) · NeuroSci · doi:10.3390/neurosci6040123 · Cited by 1
Pairwise, Ordinal Outlier Detection of Traumatic Brain Injuries
Higger, M., Shenton, M. E., & Sylvain Bouix, A. (2018) · Lecture notes in computer science · doi:10.1007/978-3-319-75238-9_9 · Cited by 1
Generative Adversarial Networks for Neuroimage Translation
Czobit, C., & Samavi, R. (2024) · Journal of Computational Biology · doi:10.1089/cmb.2024.0635 · Cited by 1
Neuroimaging in Fetal Alcohol Spectrum Disorder
Adler, R. S. (2021) · Springer eBooks · doi:10.1007/978-3-030-73628-6_7 · Cited by 1
Traumatic Brain Injury and Neurodegenerative Disease
McGuire, D. (2018) · Wiley eBooks · doi:10.1002/9781118772034.ch26 · Cited by 2
Metadata
- Authors
- Aoki, Y., Inokuchi, R., Gunshin, M., Yahagi, N., & Suwa, H.
- Affiliations
- Ebara Hospital (JP)
- University of Tokyo Hospital (JP)
- Corresponding author
- Aoki, Yuta
- Venue
- Journal of Neurology, Neurosurgery & Psychiatry
- Publisher
- BMJ
- Published
- 2012-07-14
- Volume
- 83
- Issue
- 9
- Pages
- 870-876
- ISSN
- 0022-3050 (ISSN-L)
- 1468-330X
- PMC
- PMC3415311
- OpenAlex
- W2140653640
- Cited by
- 237
- References
- 70
- Citations by year
- 2026: 11 · 2025: 11 · 2024: 10 · 2023: 12 · 2022: 9 · 2021: 16 · 2020: 18 · 2019: 14 · 2018: 17 · 2017: 22 · 2016: 24 · 2015: 30 · 2014: 20 · 2013: 20 · 2012: 3
- FWCI
- 2.91
- Type
- journal article
- Language
- en
- Open access
- hybrid
- doi.org
- Licence
- cc-by-nc
- Locations
- Journal of Neurology Neurosurgery & Psychiatry (publishedVersion, cc-by-nc)
- PubMed Central (publishedVersion, cc-by-nc)
- PubMed (publishedVersion)
- HighWire Press Open Archive (submittedVersion)
- Topics
- Health Sciences › Medicine › Clinical Neurology › Traumatic Brain Injury Research
- Health Sciences › Medicine › Radiology, Nuclear Medicine and Imaging › Advanced Neuroimaging Techniques and Applications
- Physical Sciences › Engineering › Biomedical Engineering › Automotive and Human Injury Biomechanics
- Keywords
- mild traumatic brain injury, diffusion tensor imaging, white matter injury, corpus callosum, fractional anisotropy, mean diffusivity, splenium, genu, midbody, white matter microstructure
- MeSH terms
- Brain Injuries, Corpus Callosum, Humans, Nerve Fibers, Myelinated, Anisotropy, Diffusion Tensor Imaging, Neuroimaging
About these checks
Registry, retraction, Cites and statistics results are computed, not judged, with one exception: a printed reference that no index lists is read once by a model before it counts as a citation error. Claims are extracted by a model and kept only when their quote appears verbatim in the text; each cited source is then checked, with a model’s help, for whether it says what the claim relies on. Those verdicts can be wrong — read the claim’s quote and the cited source before relying on one.
Statistics and arithmetic are recomputed, not judged.
Confidence bands are shown only for fields calibrated on our annotated test set. None is calibrated yet, so no band is shown.
What counts as a claim ›How we measure confidence ›How we check this ›
Are you an author, or do you see a problem with this page? Request a review
