

The DOI matches its Crossref record; 81 of the 82 references it cites were found in a registry or an index, and 1 are not checked yet; none of the 13 sources its claims cite is checked for support yet.
Enhancing AI-Assisted Group Decision Making through LLM-Powered Devil's Advocate
Open accessAbstract
Group decision making plays a crucial role in our complex and interconnected world. The rise of AI technologies has the potential to provide data-driven insights to facilitate group decision making, although it is found that groups do not always utilize AI assistance appropriately. In this paper, we aim to examine whether and how the introduction of a devil’s advocate in the AI-assisted group decision making processes could help groups better utilize AI assistance and change the perceptions of group processes during decision making. Inspired by the exceptional conversational capabilities exhibited by modern large language models (LLMs), we design four different styles of devil’s advocate powered by LLMs, varying their interactivity (i.e., interactive vs. non-interactive) and their target of objection (i.e., challenge the AI recommendation or the majority opinion within the group). Through a randomized human-subject experiment, we find evidence suggesting that LLM-powered devil’s advocates that argue against the AI model’s decision recommendation have the potential to promote groups’ appropriate reliance on AI. Meanwhile, the introduction of LLM-powered devil’s advocate usually does not lead to substantial increases in people’s perceived workload for completing the group decision making tasks, while interactive LLM-powered devil’s advocates are perceived as more collaborating and of higher quality. We conclude by discussing the practical implications of our findings.
Checked 2026-11-14 · 1 reference not checked yet
Overview
CoChat Summary
TL;DR
This paper tests LLM-powered devil’s advocates in AI-assisted group decision making through a randomized Prolific experiment. It finds that an interactive devil’s advocate challenging AI recommendations improves groups’ appropriate reliance and accuracy, while challenging the majority opinion has limited effects and interactive advocates are perceived as more collaborating and higher quality.
Key findings
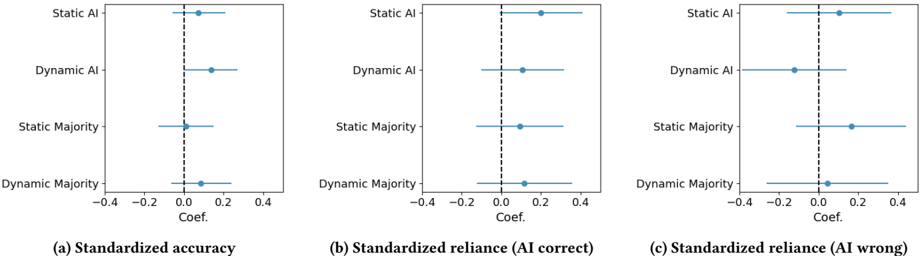
- Groups in the Dynamic-AI treatment had significantly higher standardized decision accuracy than Control (β = 0.135, SE = 0.068, 95% CI [0.002, 0.269], p = 0.047); Static-AI marginally increased reliance on correct AI recommendations (β = 0.200, SE = 0.107, 95% CI [−0.010, 0.410], p = 0.062).
- Target of objection had a marginal main effect on standardized accuracy (F(1, 92) = 3.500, p = 0.064, η² = 0.029), with AI-target higher (M = 0.042, SD = 0.261) than majority-target (M = −0.036, SD = 0.227); interactive devil’s advocates marginally reduced reliance on incorrect AI versus non-interactive (M = −0.013, SD = 0.351 vs. M = 0.029, SD = 0.252; F(1, 91) = 3.554, p = 0.063, η² = 0.038).
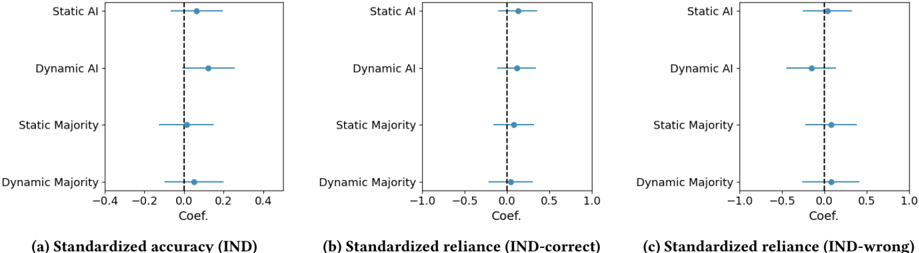
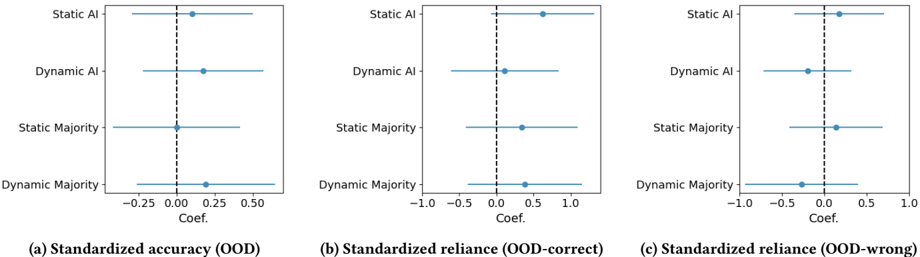
- Dynamic-AI’s accuracy increase mainly occurred on in-distribution tasks (β = 0.122, SE = 0.067, 95% CI [−0.009, 0.254], p = 0.069); Static-AI’s increase in reliance on correct AI mainly came from out-of-distribution tasks (β = 0.619, SE = 0.355, 95% CI [−0.077, 1.315], p = 0.081).
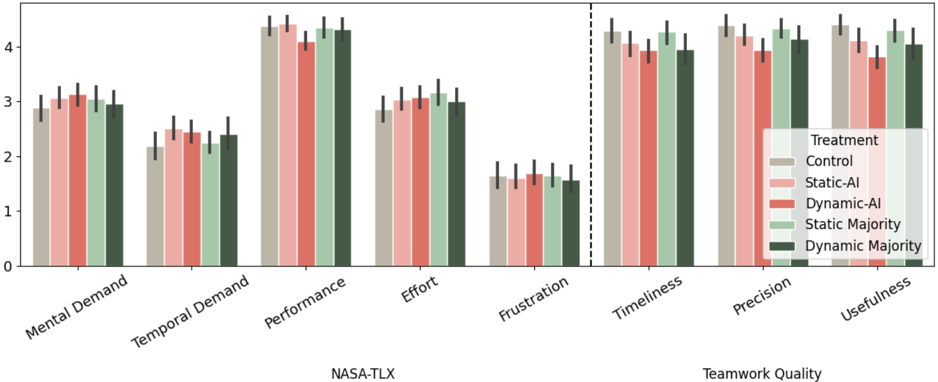
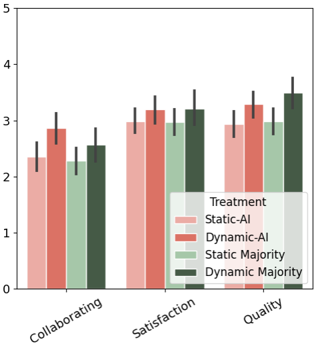
- Interactive devil’s advocates were perceived as more collaborating (F(1, 268) = 9.757, p = 0.002, η² = 0.035) and of higher quality (F(1, 268) = 11.211, p = 0.001, η² = 0.040); Dynamic-AI participants reported the lowest self-perceived performance (M = 4.107, SD = 0.791) and lower perceived teammate precision/usefulness than Control or Static-Majority.
Methods
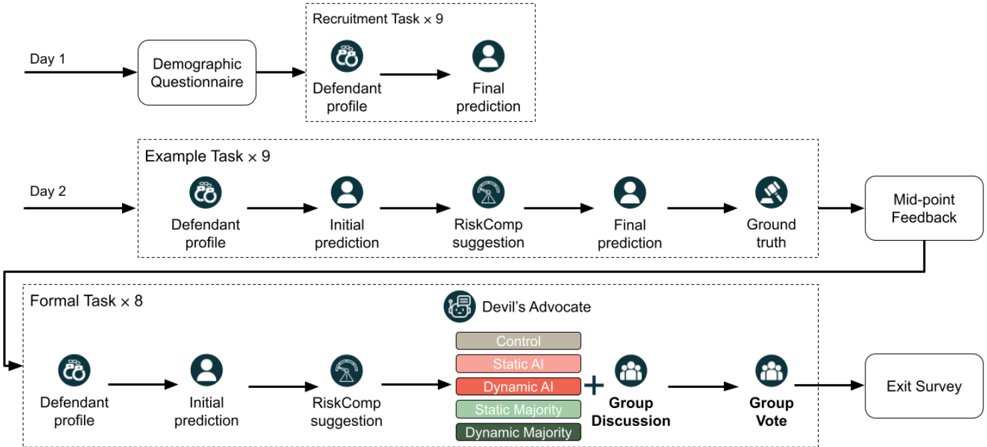
- Randomized human-subject experiment on Prolific: 350 participants formed 120 groups (Control: 24, Static-AI: 28, Static-Majority: 23, Dynamic-AI: 28, Dynamic-Majority: 17), completing 8 formal recidivism risk prediction tasks using COMPAS profiles and AI model RiskComp.
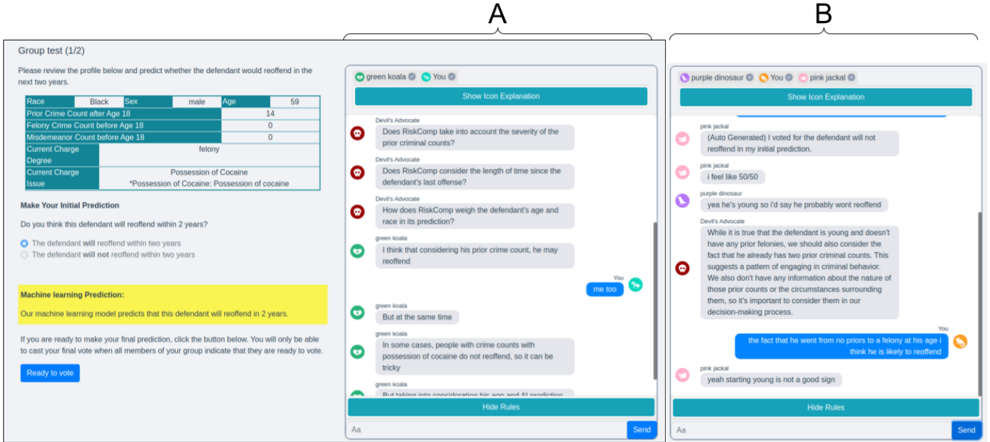
- Five treatments: Control plus a 2×2 LLM-powered devil’s advocate design varying target of objection (AI recommendation vs. majority opinion) and interactivity (static vs. dynamic), implemented with OpenAI GPT-3.5-turbo.
- Main analysis used linear regression with Control as reference, two-way ANOVA for design factors, one-way ANOVA for perceptions, and qualitative coding of chat logs (Cohen’s Kappa = 0.75); outcomes included standardized accuracy/reliance z-scores, NASA-TLX workload, teamwork quality, and devil’s advocate perceptions.
Limitations
- Stated: online setting may not generalize to in-person group decision making; anonymity, one-shot collaborations, no domain expertise, and one recidivism domain limit generalizability; no data on dropouts; the intentionally biased AI model limits generalizability to other biases or performance levels.
- Stated/evident: the LLM devil’s advocate sometimes repeated arguments, suggested unavailable features, and had time lag/out-of-context responses in multi-person chat; participants sometimes ignored, mocked, or expressed frustration toward it.
- Evident: groups could end with only two members due to dropout/removal, and effects on out-of-distribution over-reliance were not statistically significant.
Model-written summary. Check it against the paper before relying on it.
Integrity signals
Registry
Cites
Statistics
Figures
Verification
Claims the paper makes
0 Valid · 0 Not valid · 9 Not checked · 80 Own results and interpretations
A result the paper reports from its own data — it cites no other source for it, so there is none to check. The quote shows it is in the paper.
In the paper
“Overall, we find that the increase in groups' decision accuracy that is brought about by the interactive devil's advocate challenging the correctness of the AI model's recommendation (i.e., the one used in the Dynamic-AI treatment) mainly occurs on in-distribution task instances (Figure 4a, 𝛽 = 0.122, SE = 0.067, 95% CI = [-0.009,0.254], 𝑝 = 0.069).”
§ Enhancing AI-Assisted Group Decision Making through LLM-Powered Devil's Advocate > 4.3 RQ3: How does LLM-powered devil's
plainstates a cause- Asserted: passes — The authors put it forward as true.
- Checkable: passes — It can be checked against evidence.
- Load-bearing: passes — The paper’s conclusions depend on it.
- Based: passes — The paper gives a reason why it holds.
A result the paper reports from its own data — it cites no other source for it, so there is none to check. The quote shows it is in the paper.
In the paper
“we found that its overall accuracy was 66%.”
§ Enhancing AI-Assisted Group Decision Making through LLM-Powered Devil's Advocate > 3.1 Experimental Task
plain- Asserted: passes — The authors put it forward as true.
- Checkable: passes — It can be checked against evidence.
- Load-bearing: unclear — It is unclear whether the paper’s conclusions depend on it.
- Based: passes — The paper gives a reason why it holds.
A result the paper reports from its own data — it cites no other source for it, so there is none to check. The quote shows it is in the paper.
In the paper
“In general, participants' satisfaction with the devil's advocate is also not significantly different across treatments.”
§ Enhancing AI-Assisted Group Decision Making through LLM-Powered Devil's Advocate > 4.4 RQ4: How does LLM-powered devil's
plain- Asserted: passes — The authors put it forward as true.
- Checkable: passes — It can be checked against evidence.
- Load-bearing: unclear — It is unclear whether the paper’s conclusions depend on it.
- Based: passes — The paper gives a reason why it holds.
A result the paper reports from its own data — it cites no other source for it, so there is none to check. The quote shows it is in the paper.
In the paper
“However, on those decision making tasks where AI recommendations are wrong, we find that the use of an interactive devil's advocate marginally reduces groups' reliance on AI than a non-interactive devil's advocate (non-interactive: 𝑀 = 0.029, 𝑆𝐷 = 0.252; interactive: 𝑀 = -0.013,𝑆𝐷 = 0.351; 𝐹 (1, 91) = 3.554, 𝑝 = 0.063, 𝜂 2 = 0.038).”
§ Enhancing AI-Assisted Group Decision Making through LLM-Powered Devil's Advocate > 4.2 RQ2: How do the target of objection and
plainstates a cause- Asserted: passes — The authors put it forward as true.
- Checkable: passes — It can be checked against evidence.
- Load-bearing: passes — The paper’s conclusions depend on it.
- Based: passes — The paper gives a reason why it holds.
A result the paper reports from its own data — it cites no other source for it, so there is none to check. The quote shows it is in the paper.
In the paper
“In addition, we also find that participants in different treatments exhibited significantly different perceptions regarding the precision and usefulness of the information provided by other members of their group (𝐹 (4, 328) = 3.396, 𝑝 = 0.010, 𝜂 2 = 0.040 for precision, and 𝐹 (4, 328) = 4.813, 𝑝 < 0.001, 𝜂 2 = 0.055 for usefulness).”
§ Enhancing AI-Assisted Group Decision Making through LLM-Powered Devil's Advocate > 4.4 RQ4: How does LLM-powered devil's
plainstates an association- Asserted: passes — The authors put it forward as true.
- Checkable: passes — It can be checked against evidence.
- Load-bearing: passes — The paper’s conclusions depend on it.
- Based: passes — The paper gives a reason why it holds.
42 more claims
Create a free account to see all 89 claims and every source verdict.
- It may state two separate claims as one. 29
- The quote only partly states this claim. 1
- Probably not a substantial claim. 19
Statistics that don’t add up
Each reported p-value recomputed from its test statistic and degrees of freedom.
Rated minor: it would not touch a result — a value no result rests on, a p-value that stays on the same side of the significance level, or a conflict that is clerical, resolved elsewhere in the paper, or outside its own findings.
In the paper
“𝐹 (1, 92) = 3.500, 𝑝 = 0.064”
§ Enhancing AI-Assisted Group Decision Making through LLM-Powered Devil's Advocate > 4.2 RQ2: How do the target of objection and
Reported p = .064 · recomputed p = .065
Statistics recomputed
Every reported test result, recomputed from its test statistic and degrees of freedom. A result shows as not adding up only once an independent check has confirmed it.
- Doesn’t add upF(1, 92) = 3.5reported p = .064 · recomputed p = .065
“F (1, 92) = 3.500, p = .064”
- Not confirmedF(4, 328) = 2.417reported p = .048 · recomputed p = .049
“F (4, 328) = 2.417, p = .048”
- ConsistentF(1, 91) = 3.554reported p = .063 · recomputed p = .063
“F (1, 91) = 3.554, p = .063”
- ConsistentF(4, 328) = 3.396reported p = .01 · recomputed p = .010
“F (4, 328) = 3.396, p = .010”
- ConsistentF(4, 328) = 4.813reported p < .001 · recomputed p < .001
“F (4, 328) = 4.813, p < .001”
2 more recomputed tests
Create a free account to see every test the Stats check recomputed.
Self-check
Percentages, sums and reported differences re-computed from the paper’s own numbers.
Self-check results appear here once an independent check has confirmed them.
Citations
Cites
Language Models are Few-Shot Learners
Brown, T. B., Mann, B., Ryder, N., Subbiah, M., Kaplan, J., Dhariwal, P., Neelakantan, A., Shyam, P., Sastry, G., Askell, A., et al. (2020) · arXiv · doi:10.48550/arxiv.2005.14165 · Cited by 23,372
Training language models to follow instructions with human feedback
Ouyang, L., Wu, J., Jiang, X., Almeida, D., Wainwright, C. L., Mishkin, P., Zhang, C., Agarwal, S., Slama, K., Ray, A., et al. (2022) · arXiv · doi:10.48550/arxiv.2203.02155 · Cited by 4,208
What is AI Literacy? Competencies and Design Considerations
Long, D., & Magerko, B. (2020) · Proceedings of the 2020 CHI Conference on Human Factors in Computing Systems · doi:10.1145/3313831.3376727 · Cited by 3,241 · cited 1×
“…that can influence people’s trust in AI recommendations, including the AI model’s accuracy and confidence [80, 111, 112], people’s AI literacy [16, 55], the degree of alignment between the AI model’s recommendations and people’s own judgments [59, 115], the timing and nature of errors made by the…”
BackgroundBuçinca, Z., Malaya, M. B., & Gajos, K. Z. (2021) · arXiv · doi:10.48550/arxiv.2102.09692 · Cited by 1,124
Does the Whole Exceed its Parts? The Effect of AI Explanations on Complementary Team Performance
Bansal, G., Wu, T., Zhou, J., Fok, R., Nushi, B., Kamar, E., Ribeiro, M. T., & Weld, D. (2021) · Proceedings of the 2021 CHI Conference on Human Factors in Computing Systems · doi:10.1145/3411764.3445717 · Cited by 757 · cited 1×
“To enhance human-AI decision performance in AI-assisted decision making, a long line of research has looked into how humans trust and rely on the decision recommendations provided by AI models [7, 9, 50, 57].”
BackgroundDoes the Whole Exceed its Parts? The Effect of AI Explanations on Complementary Team Performance
Bansal, G., Wu, T., Zhou, J., Fok, R., Nushi, B., Kamar, E., Ribeiro, M. T., & Weld, D. S. (2020) · arXiv · doi:10.48550/arxiv.2006.14779 · Cited by 754
Manipulating and Measuring Model Interpretability
Poursabzi-Sangdeh, F., Goldstein, D. G., Hofman, J. M., Wortman Vaughan, J. W., & Wallach, H. (2021) · Proceedings of the 2021 CHI Conference on Human Factors in Computing Systems · doi:10.1145/3411764.3445315 · Cited by 728
Schweiger, D. M., Sandberg, W. R., & Ragan, J. W. (1986) · Academy of Management Journal · doi:10.2307/255859 · Cited by 682
Cai, C. J., Winter, S., Steiner, D., Wilcox, L., & Terry, M. (2019) · Proceedings of the ACM on Human-Computer Interaction · doi:10.1145/3359206 · Cited by 594
Understanding the Effect of Accuracy on Trust in Machine Learning Models
Yin, M., Wortman Vaughan, J., & Wallach, H. (2019) · Proceedings of the 2019 CHI Conference on Human Factors in Computing Systems · doi:10.1145/3290605.3300509 · Cited by 527 · cited 1×
“…identified a wide range of factors that can influence people’s trust in AI recommendations, including the AI model’s accuracy and confidence [80, 111, 112], people’s AI literacy [16, 55], the degree of alignment between the AI model’s recommendations and people’s own judgments [59, 115], the…”
BackgroundSelf-citation
Research works printed but not linked: 34
- Ramon J Aldag and Sally R Fuller. 1993. Beyond fiasco: A reappraisal of the groupthink phenomenon and a new model of group decision processes.Psychological bulletin 113, 3 (1993), 533.
- Kiana Alikhademi, Emma Drobina, Diandra Prioleau, Brianna Richardson, Duncan Purves, and Juan E Gilbert. 2022. A review of predictive policing from the perspective of fairness. Artificial Intelligence and Law (2022), 1–17.
- Hussam Alkaissi and Samy I McFarlane. 2023. Artificial hallucinations in ChatGPT: implications in scientific writing. Cureus 15, 2 (2023).
- Julia Angwin, Jeff Larson, Surya Mattu, and Lauren Kirchner. 2016. Machine Bias. ProPublica (2016). URL: https://www. propublica. org/article/machine-bias-risk-asses sments-in-criminal-sentencing (2016).
- Chun-Wei Chiang and Ming Yin. 2022. Exploring the Effects of Machine Learning Literacy Interventions on Laypeople’s Reliance on Machine Learning Models. In 27th International Conference on Intelligent User Interfaces. 148–161.
- Mustafa Demir, Nathan J McNeese, and Nancy J Cooke. 2016. Team communication behaviors of the human-automation teaming. In 2016 IEEE international multi-disciplinary conference on cognitive methods in situation awareness and decision support (CogSIMA). IEEE, 28–34.
- Berkeley J Dietvorst, Joseph P Simmons, and Cade Massey. 2015. Algorithm aversion: people erroneously avoid algorithms after seeing them err.Journal of Experimental Psychology: General 144, 1 (2015), 114.
- Julia Dressel and Hany Farid. 2018. The accuracy, fairness, and limits of predicting recidivism. Science advances 4, 1 (2018), eaao5580.
- Danielle Ensign, Sorelle A Friedler, Scott Neville, Carlos Scheidegger, and Suresh Venkatasubramanian. 2018. Runaway feedback loops in predictive policing. In Conference on fairness, accountability and transparency. PMLR, 160–171.
- Nicolas Fay, Simon Garrod, and Jean Carletta. 2000. Group discussion as interactive dialogue or as serial monologue: The influence of group size. Psychological science 11, 6 (2000), 481–486.
- Adrian Furnham and Hua Chu Boo. 2011. A literature review of the anchoring effect. The journal of socio-economics 40, 1 (2011), 35–42.
- Daniel Gigone and Reid Hastie. 1993. The common knowledge effect: Information sharing and group judgment.Journal of Personality and social Psychology 65, 5 (1993), 959.
- Sandra G Hart and Lowell E Staveland. 1988. Development of NASA-TLX (Task Load Index): Results of empirical and theoretical research. In Advances in psychology. Vol. 52. Elsevier, 139–183.
- Tatsuya Kameda and Shinkichi Sugimori. 1993. Psychological entrapment in group decision making: An assigned decision rule and a groupthink phenomenon.Journal of personality and social psychology 65, 2 (1993), 282.
- Antino Kim, Mochen Yang, and Jingjng Zhang. 2020. When Algorithms Err: Differential Impact of Early vs. Late Errors on Users’ Reliance on Algorithms. Late Errors on Users’ Reliance on Algorithms (July 2020) (2020).
- Colin MacDougall and Frances Baum. 1997. The devil’s advocate: A strategy to avoid groupthink and stimulate discussion in focus groups. Qualitative health research 7, 4 (1997), 532–541.
- Richard O Mason. 1969. A dialectical approach to strategic planning. Management science 15, 8 (1969), B–403.
- David G Myers and George D Bishop. 1971. Enhancement of dominant attitudes in group discussion.Journal of personality and social psychology 20, 3 (1971), 386.
- Samir Passi and Mihaela Vorvoreanu. 2022. Overreliance on AI Literature Review. Microsoft Research (2022).
- Dean G Pruitt. 1971. Choice shifts in group discussion: An introductory review.Journal of personality and social psychology 20, 3 (1971), 339.
- Fabian Reinkemeier, Ulrich Gnewuch, and Waldemar Toporowski. 2022. Can Humanizing Voice Assistants Unleash the Potential of Voice Commerce? (2022).
- Julian Sanchez, Wendy A Rogers, Arthur D Fisk, and Ericka Rovira. 2014. Understanding reliance on automation: effects of error type, error distribution, age and experience. Theoretical issues in ergonomics science 15, 2 (2014), 134–160.
- Daniel L Schwartz. 1999. The productive agency that drives collaborative learning. Collaborative learning: Cognitive and computational approaches 200 (1999).
- David M Schweiger, William R Sandberg, and James W Ragan. 1985. An Empirical Evaluation of Dialectial Inquiry, Devil’s Advocate, and Consensus Approaches to Strategic Decision Making.. In Academy of Management Proceedings, Vol. 1985. Academy of Management Briarcliff Manor, NY 10510, 40–44.
- David M Schweiger, Wiliam R Sandberg, and Paula Rechner. 1988. A Longitudinal Comparative Analysis of Dialectical Inquiry, Devil’s Advocacy and Consensus Approaches to Strategic Decision Making.. In Academy of Management Proceedings, Vol. 1988. Academy of Management Briarcliff Manor, NY 10510, 32–36.
- Charles Schwenk and Joseph S Valacich. 1994. Effects of devil’s advocacy and dialectical inquiry on individuals versus groups. Organizational behavior and human decision processes 59, 2 (1994), 210–222.
- Margaret Chase Smith and US Senator from Maine. 2018. The Naysayer Mindset. Unlocking Creativity: How to Solve Any Problem and Make the Best Decisions by Shifting Creative Mindsets (2018), 137.
- Gerry Stahl. 2002. Rediscovering cscl. In Cscl Vol. 2. 169–181.
- Garold Stasser and Dennis Stewart. 1992. Discovery of hidden profiles by decision-making groups: Solving a problem versus making a judgment.Journal of personality and social psychology 63, 3 (1992), 426.
- Garold Stasser, Laurie A Taylor, and Coleen Hanna. 1989. Information sampling in structured and unstructured discussions of three-and six-person groups.Journal of personality and social psychology 57, 1 (1989), 67.
- Harini Suresh, Natalie Lao, and Ilaria Liccardi. 2020. Misplaced Trust: Measuring the Interference of Machine Learning in Human Decision-Making. In 12th ACM Conference on Web Science. 315–324.
- John E Tropman. 2013. Effective meetings: Improving group decision making. Vol. 17. Sage Publications.
- Daisuke Wakabayashi. 2018. Self-driving Uber car kills pedestrian in Arizona, where robots roam. The New York Times 19, 03 (2018).
- Rui Zhang, Nathan J McNeese, Guo Freeman, and Geoff Musick. 2021. " An ideal human" expectations of AI teammates in human-AI teaming. Proceedings of the ACM on Human-Computer Interaction 4, CSCW3 (2021), 1–25.
Cited by
Tun, H. M., Rahman, H. A., Naing, L., & Malik, O. A. (2025) · Journal of Medical Internet Research · doi:10.2196/69678 · Cited by 210
PersonaFlow: Designing LLM-Simulated Expert Perspectives for Enhanced Research Ideation
Liu, Y., Sharma, P., Oswal, M., Xia, H., & Huang, Y. (2025) · Designing Interactive Systems Conference · doi:10.1145/3715336.3735789 · Cited by 77
Buçinca, Z., Swaroop, S., Paluch, A. E., Doshi‐Velez, F., & Gajos, K. Z. (2025) · CHI Conference on Human Factors in Computing Systems · doi:10.1145/3706598.3713229 · Cited by 63
Fan, H., Chen, G., Wang, X., & Peng, Z. (2024) · ACM Symposium on User Interface Software and Technology (UIST) · doi:10.1145/3654777.3676390 · Cited by 62
Reicherts, L., Zhang, Z. T., von Oswald, E., Liu, Y., Rogers, Y., & Hassib, M. E. (2025) · CHI Conference on Human Factors in Computing Systems · doi:10.1145/3706598.3713295 · Cited by 50
Metadata
- Authors
- Chiang, C.-W., Lu, Z., Li, Z., & Yin, M.
- Affiliations
- Purdue University West Lafayette (US)
- Venue
- Proceedings of the 29th International Conference on Intelligent User Interfaces
- Publisher
- ACM
- Published
- 2024-03-18
- Pages
- 103-119
- OpenAlex
- W4393970695
- Semantic Scholar
- 6e2845e3099e2b300dc085b4d0b9180c2d9d139a
- Cited by
- 142
- References
- 81
- Citations by year
- 2026: 80 · 2025: 55 · 2024: 7
- FWCI
- 51.05
- Type
- conference paper
- Language
- en
- Open access
- hybrid
- doi.org
- Licence
- Locations
- ACM International Conference on Intelligent User Interfaces (IUI) (publishedVersion, cc-by)
- Funders
- National Science Foundation (IIS-2229876)
- Topics
- Social Sciences › Human Factors and Ergonomics › Human-Automation Interaction and Safety
- Social Sciences › Psychology › Social Psychology › Team Dynamics and Performance
- Social Sciences › Business, Management and Accounting › Management Information Systems › Decision Support System Applications
- Keywords
- group decision making, AI-assisted decision-making, devil's advocate, large language models, AI reliance, perceived workload
About these checks
Registry, retraction, Cites and statistics results are computed, not judged, with one exception: a printed reference that no index lists is read once by a model before it counts as a citation error. Claims are extracted by a model and kept only when their quote appears verbatim in the text; each cited source is then checked, with a model’s help, for whether it says what the claim relies on. Those verdicts can be wrong — read the claim’s quote and the cited source before relying on one.
A language model drew the claims from the paper on 2026-11-14, under version 3 of the claim definition (model deepseek-v4.1-flash, prompt extract-v3).
A second model labelled each claim on 2026-11-14 (model jev-1.13-20260917, definition revision gold-guideline-v0.2).
Statistics and arithmetic are recomputed, not judged.
Confidence bands are shown only for fields calibrated on our annotated test set. None is calibrated yet, so no band is shown.
What counts as a claim ›How we measure confidence ›How we check this ›
Are you an author, or do you see a problem with this page? Request a review
Data sources
Bibliographic data: Semantic Scholar, OpenAlex, Crossref.
Contains information from the Semantic Scholar Academic Graph Datasets, made available under the ODC Attribution License (ODC-BY 1.0).
Semantic Scholar’s data is described in: Kinney, R., et al. (2023). The Semantic Scholar Open Data Platform. arXiv:2301.10140.
