

The DOI matches its Crossref record; 56 of the 58 references it cites were found in a registry or an index; none of the 22 sources its claims cite is checked for support yet.
Targeting HIF-1α abrogates PD-L1–mediated immune evasion in tumor microenvironment but promotes tolerance in normal tissues
Open accessAbstract
A combination of anti-CTLA-4 plus anti-PD-1/PD-L1 is the most effective cancer immunotherapy but causes high incidence of immune-related adverse events (irAEs). Here we report that targeting of HIF-1α suppressed PD-L1 expression on tumor cells and tumor-infiltrating myeloid cells, but unexpectedly induced PD-L1 in normal tissues by an IFN-γ-dependent mechanism. Targeting the HIF-1α/PD-L1 axis in tumor cells reactivated tumor-infiltrating lymphocytes and caused tumor rejection. The HIF-1α inhibitor echinomycin potentiated the cancer immunotherapeutic effects of anti-CTLA-4 therapy, with efficacy comparable to that of anti-CTLA-4 plus anti-PD-1 antibodies. However, while anti-PD-1 exacerbated irAEs triggered by ipilimumab, echinomycin protected mice against irAEs by increasing PD-L1 levels in normal tissues. Our data suggest that targeting HIF-1α fortifies the immune tolerance function of the PD-1/PD-L1 checkpoint in normal tissues but abrogates its immune evasion function in the tumor microenvironment to achieve safer and more effective immunotherapy.
Overview
AI snapshot
Written from the paper’s full text.
TL;DR
Targeting HIF-1α with liposomal echinomycin (LEM) suppresses PD-L1 in the tumor microenvironment and reactivates antitumor immunity, while unexpectedly inducing PD-L1 in normal tissues via IFN-γ. This differential regulation potentiates anti–CTLA-4 therapy without the irAE exacerbation seen with anti–PD-1.
Key findings
- LEM reduced PD-L1 on tumor cells and tumor-infiltrating myeloid cells (M-MDSCs, PMN-MDSCs, and CD11b+CD11c+ cells, ~90% of which were F4/80+ TAMs), increased IFN-γ+CD8+ (Tc1) and IFN-γ+CD4+ (Th1) TILs, and inhibited tumor growth in immunocompetent but less so in immunodeficient mice.
- LEM potentiated anti–CTLA-4 (9D9) therapy in 4T1, E0771, and MC38 models, with efficacy comparable to anti–CTLA-4 plus anti–PD-1; optimal efficacy required CD8+, NK, and CD4+ cells, with CD8+ cells most critical.
- In normal tissues, LEM induced PD-L1 in liver, kidney, and intestine by an IFN-γ–dependent mechanism; in CTLA4h/h-KI mice, LEM protected against ipilimumab-induced intestinal leakage, and adding anti–IFN-γ increased the frequency of mice with leakage from 7.7% to 20.0%.
- Anti–PD-1 abrogated LEM’s protection against ipilimumab-induced GI irAEs, whereas LEM protected mice by increasing normal-tissue PD-L1; the paper notes dual checkpoint blockade causes severe irAEs in 50%–90% of patients depending on setting.
Methods
- Syngeneic mouse tumor models: 4T1 and E0771 breast cancer and MC38 colon adenocarcinoma in BALB/c, C57BL/6, and NSG mice; genetic tools included shHif1a, shPdl1, and conditional Hif1a knockout in T cells.
- Treatments: liposomal echinomycin (LEM) i.v. at 0.15–0.25 mg/kg; anti–mouse CTLA-4 (9D9), anti–PD-1 (RMP1-14), anti–IFN-γ (XMG1.2), and depleting CD4/CD8/NK antibodies; readouts included flow cytometry, immunofluorescence, histology, and FITC-dextran intestinal permeability.
- GI irAE model: 10-day-old human CTLA4-knockin mice received ipilimumab i.p. on days 10, 13, 16, and 19; FITC-dextran assay on day 32. Statistics used t tests, 1-way/2-way ANOVA with Sidak’s post hoc test, and Pearson correlation in Prism 8, with P < 0.05 significant.
Limitations
- Stated: adult tumor-bearing mice tolerated high-dose anti–CTLA-4 without significant irAEs, so the irAE studies relied on young CTLA4h/h-KI mice.
- Stated: it is unclear whether LEM promotes Tc1 expansion in vivo by cell-intrinsic HIF-1α targeting or indirectly by reducing regulatory T cells.
- Evident: all efficacy and toxicity data are preclinical mouse models; no human clinical outcomes or patient data are reported.
Model-written summary. Check it against the paper before relying on it.
Integrity signals
Registry
Cites
Statistics
Figures
Verification
Claims the paper makes
75 Own result · 30 Own interpretation · 16 Not checked yet · 5 Own method · 1 No basis given
A result the paper reports from its own data — it cites no other source for it, so there is none to check. The quote shows it is in the paper.
In the paper
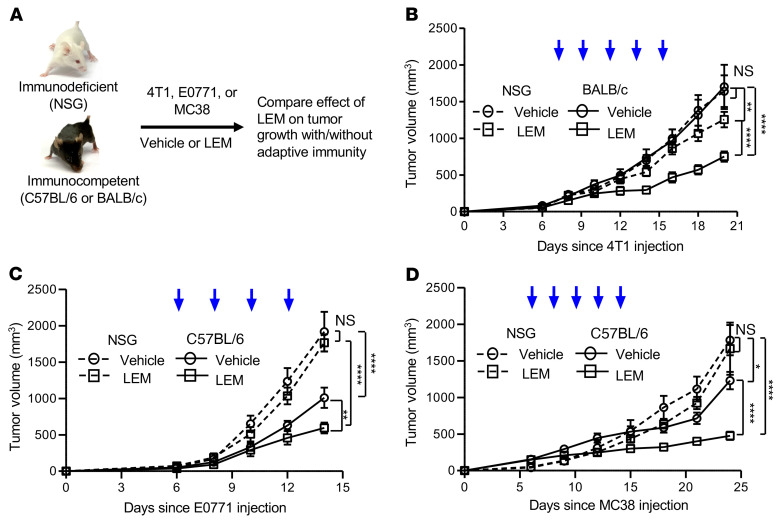
“In a second breast cancer model, E0771, the therapeutic effects of LEM were also more pronounced in immune-competent mice (Figure 2C).”
§ Targeting HIF-1α abrogates PD-L1–mediated immune evasion in tumor microenvironment but promotes tolerance in normal tissues > Results > Immunotherapeutic effect of LEM.
plaincorrelational- Asserted: passes — The authors put it forward as true.
- Checkable: passes — It can be checked against evidence.
- Load-bearing: passes — The paper’s conclusions depend on it.
- Based: passes — The paper gives a reason why it holds.
A result the paper reports from its own data — it cites no other source for it, so there is none to check. The quote shows it is in the paper.
In the paper
“LEM significantly inhibited 4T1 growth in both immunocompetent (BALB/c) and immunodeficient (NSG) recipients compared with each strain’s respective vehicle control (Figure 2B).”
§ Targeting HIF-1α abrogates PD-L1–mediated immune evasion in tumor microenvironment but promotes tolerance in normal tissues > Results > Immunotherapeutic effect of LEM.
plaindirect- Asserted: passes — The authors put it forward as true.
- Checkable: passes — It can be checked against evidence.
- Load-bearing: passes — The paper’s conclusions depend on it.
- Based: passes — The paper gives a reason why it holds.
A result the paper reports from its own data — it cites no other source for it, so there is none to check. The quote shows it is in the paper.
In the paper
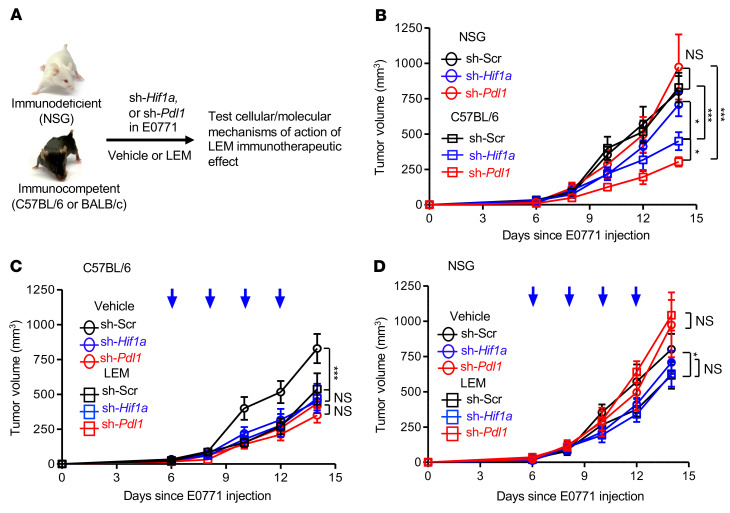
“LEM did not further suppress sh-Pdl1 E0771 tumor growth in C57BL/6 (Figure 3C) or NSG (Figure 3D) recipients.”
§ Targeting HIF-1α abrogates PD-L1–mediated immune evasion in tumor microenvironment but promotes tolerance in normal tissues > Results > LEM inhibits PD-L1 in tumor cells by targeting the HIF-1α/PD-L1 axis.
plain- Asserted: passes — The authors put it forward as true.
- Checkable: passes — It can be checked against evidence.
- Load-bearing: passes — The paper’s conclusions depend on it.
- Based: passes — The paper gives a reason why it holds.
A result the paper reports from its own data — it cites no other source for it, so there is none to check. The quote shows it is in the paper.
In the paper
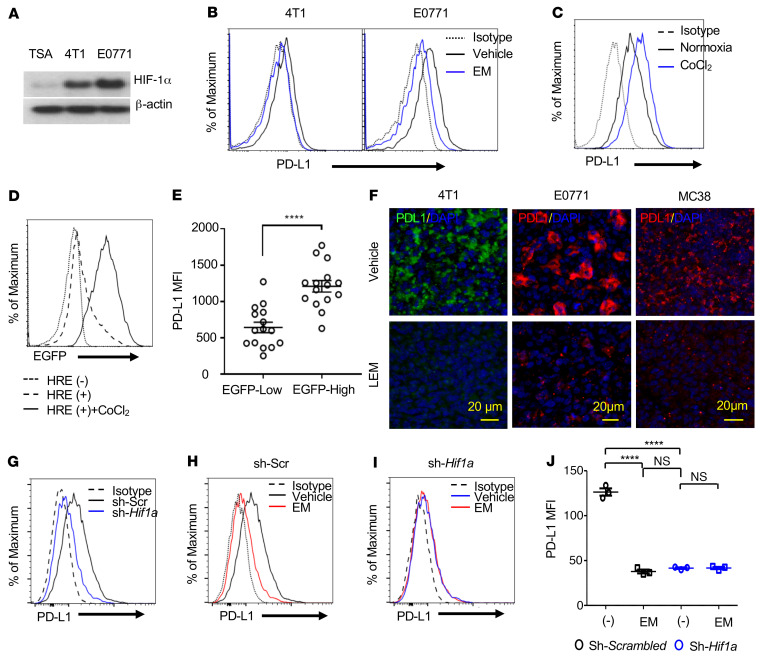
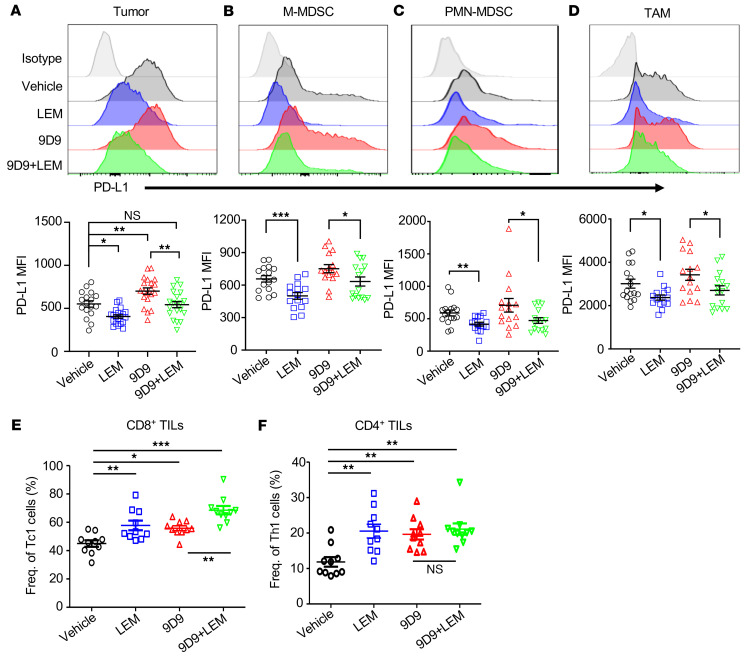
“there was a marked reduction in PD-L1 expression in the tumors of LEM-treated mice.”
§ Targeting HIF-1α abrogates PD-L1–mediated immune evasion in tumor microenvironment but promotes tolerance in normal tissues > Results > Targeting HIF-1α suppresses PD-L1 expression in the TME.
plaindirect- Asserted: passes — The authors put it forward as true.
- Checkable: passes — It can be checked against evidence.
- Load-bearing: passes — The paper’s conclusions depend on it.
- Based: passes — The paper gives a reason why it holds.
A result the paper reports from its own data — it cites no other source for it, so there is none to check. The quote shows it is in the paper.
In the paper
“LEM more effectively inhibited sh-Scr E0771 tumor growth in C57BL/6 (Figure 3C) compared with NSG (Figure 3D) recipients”
§ Targeting HIF-1α abrogates PD-L1–mediated immune evasion in tumor microenvironment but promotes tolerance in normal tissues > Results > LEM inhibits PD-L1 in tumor cells by targeting the HIF-1α/PD-L1 axis.
plaindirect- Asserted: passes — The authors put it forward as true.
- Checkable: passes — It can be checked against evidence.
- Load-bearing: passes — The paper’s conclusions depend on it.
- Based: passes — The paper gives a reason why it holds.
A result the paper reports from its own data — it cites no other source for it, so there is none to check. The quote shows it is in the paper.
In the paper
“Under basal conditions, we found that knockdown of Hif1a reduced PD-L1 protein expression (Figure 1, G–J).”
§ Targeting HIF-1α abrogates PD-L1–mediated immune evasion in tumor microenvironment but promotes tolerance in normal tissues > Results > Targeting HIF-1α suppresses PD-L1 expression in the TME.
plaindirect- Asserted: passes — The authors put it forward as true.
- Checkable: passes — It can be checked against evidence.
- Load-bearing: passes — The paper’s conclusions depend on it.
- Based: passes — The paper gives a reason why it holds.
A result the paper reports from its own data — it cites no other source for it, so there is none to check. The quote shows it is in the paper.
In the paper
“Both cell lines expressed HIF-1α and PD-L1 protein (Figure 1, A and B; see complete unedited blots in the supplemental material)”
§ Targeting HIF-1α abrogates PD-L1–mediated immune evasion in tumor microenvironment but promotes tolerance in normal tissues > Results > Targeting HIF-1α suppresses PD-L1 expression in the TME.
plain- Asserted: passes — The authors put it forward as true.
- Checkable: passes — It can be checked against evidence.
- Load-bearing: passes — The paper’s conclusions depend on it.
- Based: passes — The paper gives a reason why it holds.
A result the paper reports from its own data — it cites no other source for it, so there is none to check. The quote shows it is in the paper.
In the paper
“4T1 growth was more significantly inhibited in immunocompetent mice than in immunodeficient mice”
§ Targeting HIF-1α abrogates PD-L1–mediated immune evasion in tumor microenvironment but promotes tolerance in normal tissues > Results > Immunotherapeutic effect of LEM.
plaincorrelational- Asserted: passes — The authors put it forward as true.
- Checkable: passes — It can be checked against evidence.
- Load-bearing: passes — The paper’s conclusions depend on it.
- Based: passes — The paper gives a reason why it holds.
A result the paper reports from its own data — it cites no other source for it, so there is none to check. The quote shows it is in the paper.
In the paper
“As with E0771, all therapeutic effects required immune competence (Figure 2D).”
§ Targeting HIF-1α abrogates PD-L1–mediated immune evasion in tumor microenvironment but promotes tolerance in normal tissues > Results > Immunotherapeutic effect of LEM.
plaindirect- Asserted: passes — The authors put it forward as true.
- Checkable: passes — It can be checked against evidence.
- Load-bearing: passes — The paper’s conclusions depend on it.
- Based: passes — The paper gives a reason why it holds.
A result the paper reports from its own data — it cites no other source for it, so there is none to check. The quote shows it is in the paper.
In the paper
“In C57BL/6, but not NSG recipients, genetic depletion of Hif1a (sh-Hif1a) in E0771 cells significantly inhibited tumor growth compared with E0771 transduced with scrambled shRNA (sh-Scr) in mice of the same respective strains (Figure 3B).”
§ Targeting HIF-1α abrogates PD-L1–mediated immune evasion in tumor microenvironment but promotes tolerance in normal tissues > Results > LEM inhibits PD-L1 in tumor cells by targeting the HIF-1α/PD-L1 axis.
plaindirect- Asserted: passes — The authors put it forward as true.
- Checkable: passes — It can be checked against evidence.
- Load-bearing: passes — The paper’s conclusions depend on it.
- Based: passes — The paper gives a reason why it holds.
- It may state two separate claims as one. 30
- Probably not a substantial claim. 15
A result the paper reports from its own data — it cites no other source for it, so there is none to check. The quote shows it is in the paper.
In the paper
“loss of Pdl1 (sh-Pdl1) in E0771 cells also inhibited tumor growth in C57BL/6, but not NSG, recipients (Figure 3B)”
§ Targeting HIF-1α abrogates PD-L1–mediated immune evasion in tumor microenvironment but promotes tolerance in normal tissues > Results > LEM inhibits PD-L1 in tumor cells by targeting the HIF-1α/PD-L1 axis.
plaindirect- Asserted: passes — The authors put it forward as true.
- Checkable: passes — It can be checked against evidence.
- Load-bearing: passes — The paper’s conclusions depend on it.
- Based: passes — The paper gives a reason why it holds.
It may state two separate claims as one.
A result the paper reports from its own data — it cites no other source for it, so there is none to check. The quote shows it is in the paper.
In the paper
“TNF-α was unaffected by the therapies in CD4+ TILs, although we observed increased TNF-α+CD8+ TILs in groups receiving 9D9 (Supplemental Figure 5, E and F).”
§ Targeting HIF-1α abrogates PD-L1–mediated immune evasion in tumor microenvironment but promotes tolerance in normal tissues > Results > LEM inhibits PD-L1 on tumor cells and tumor-infiltrating myeloid cells.
plaindirect- Asserted: passes — The authors put it forward as true.
- Checkable: passes — It can be checked against evidence.
- Load-bearing: unclear — It is unclear whether the paper’s conclusions depend on it.
- Based: passes — The paper gives a reason why it holds.
It may state two separate claims as one.
A result the paper reports from its own data — it cites no other source for it, so there is none to check. The quote shows it is in the paper.
In the paper
“The proportion of tumor-infiltrating NK cells expressing granzyme B and perforin were decreased and increased, respectively, in mice treated with 9D9 alone (Supplemental Figure 5, K and L).”
§ Targeting HIF-1α abrogates PD-L1–mediated immune evasion in tumor microenvironment but promotes tolerance in normal tissues > Results > LEM inhibits PD-L1 on tumor cells and tumor-infiltrating myeloid cells.
plaindirect- Asserted: passes — The authors put it forward as true.
- Checkable: passes — It can be checked against evidence.
- Load-bearing: unclear — It is unclear whether the paper’s conclusions depend on it.
- Based: passes — The paper gives a reason why it holds.
It may state two separate claims as one.
A result the paper reports from its own data — it cites no other source for it, so there is none to check. The quote shows it is in the paper.
In the paper
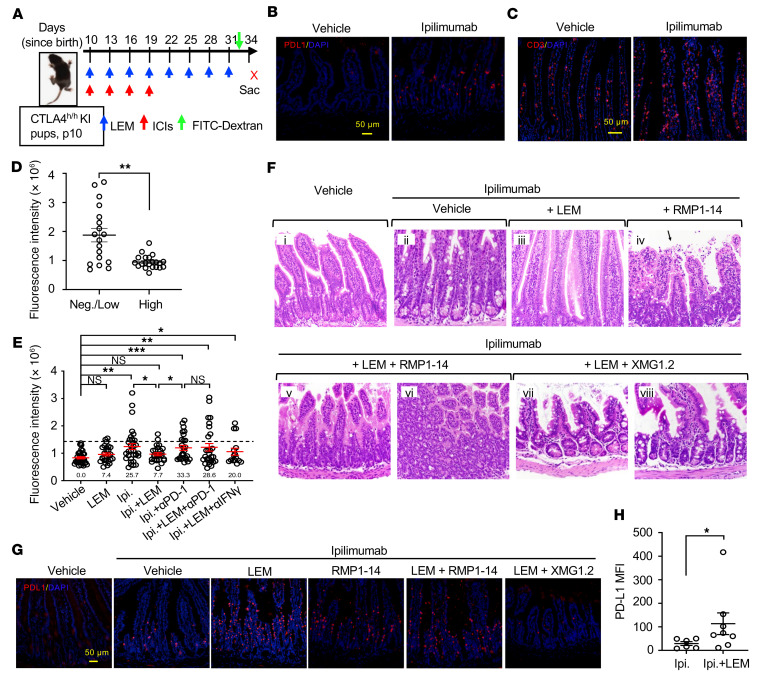
“The inflammation was largely abrogated by LEM, as mice treated with ipilimumab plus LEM for the most part exhibited normal intestinal pathology (Figure 8F).”
§ Targeting HIF-1α abrogates PD-L1–mediated immune evasion in tumor microenvironment but promotes tolerance in normal tissues > Results > LEM protected ipilimumab-induced irAEs in human CTLA4–knockin mice.
plaindirect- Asserted: passes — The authors put it forward as true.
- Checkable: passes — It can be checked against evidence.
- Load-bearing: passes — The paper’s conclusions depend on it.
- Based: passes — The paper gives a reason why it holds.
It may state two separate claims as one.
A result the paper reports from its own data — it cites no other source for it, so there is none to check. The quote shows it is in the paper.
In the paper
“The drug treatments had minimal impact on CD4+ TIL expression of CTLA-4 (Supplemental Figure 5B).”
§ Targeting HIF-1α abrogates PD-L1–mediated immune evasion in tumor microenvironment but promotes tolerance in normal tissues > Results > LEM inhibits PD-L1 on tumor cells and tumor-infiltrating myeloid cells.
plain- Asserted: passes — The authors put it forward as true.
- Checkable: passes — It can be checked against evidence.
- Load-bearing: fails — The paper’s conclusions may not depend on it.
- Based: passes — The paper gives a reason why it holds.
Probably not a substantial claim. The paper’s conclusions may not depend on it.
A result the paper reports from its own data — it cites no other source for it, so there is none to check. The quote shows it is in the paper.
In the paper
“Conditional knockout of Hif1a in T cells did not phenocopy the effects of LEM on PD-L1 induction in the liver, but PD-L1 induction was preserved regardless of the mouse genotype (Supplemental Figure 14).”
§ Targeting HIF-1α abrogates PD-L1–mediated immune evasion in tumor microenvironment but promotes tolerance in normal tissues > Results > LEM induces PD-L1 expression to limit anti–CTLA-4–induced T cell infiltration in irAE target organs.
plain- Asserted: passes — The authors put it forward as true.
- Checkable: passes — It can be checked against evidence.
- Load-bearing: unclear — It is unclear whether the paper’s conclusions depend on it.
- Based: passes — The paper gives a reason why it holds.
It may state two separate claims as one.
A result the paper reports from its own data — it cites no other source for it, so there is none to check. The quote shows it is in the paper.
In the paper
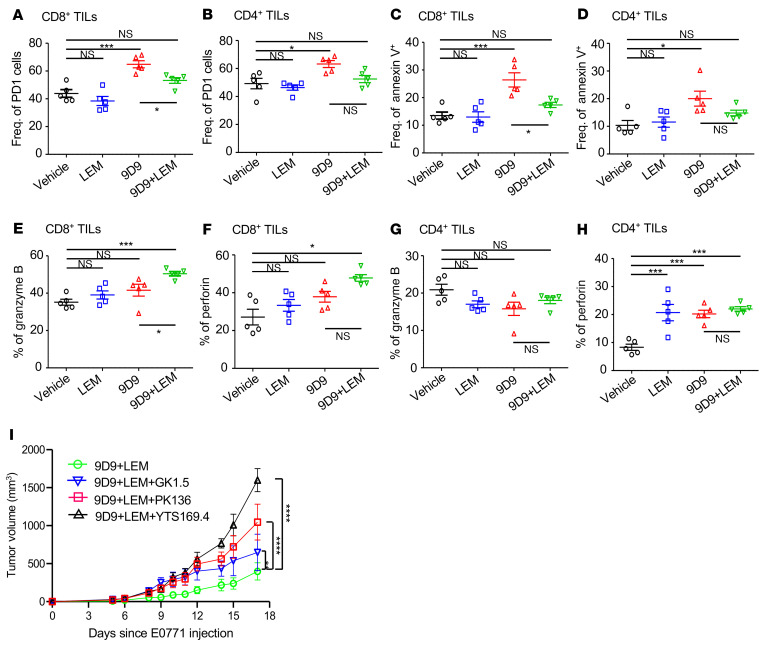
“Annexin V staining revealed more apoptotic CD8+ and CD4+ TILs in tumors of 9D9-treated mice compared with vehicle, and adding LEM appeared to repress this effect in CD8+ TILs (Figure 6C).”
§ Targeting HIF-1α abrogates PD-L1–mediated immune evasion in tumor microenvironment but promotes tolerance in normal tissues > Results > LEM inhibits PD-L1 on tumor cells and tumor-infiltrating myeloid cells.
hedgedconditional- Asserted: passes — The authors put it forward as true.
- Checkable: passes — It can be checked against evidence.
- Load-bearing: passes — The paper’s conclusions depend on it.
- Based: passes — The paper gives a reason why it holds.
It may state two separate claims as one.
A result the paper reports from its own data — it cites no other source for it, so there is none to check. The quote shows it is in the paper.
In the paper
“9D9 significantly increased and decreased the frequencies of effector and memory CD8+ T cells in the tumors, respectively (Supplemental Figure 6).”
§ Targeting HIF-1α abrogates PD-L1–mediated immune evasion in tumor microenvironment but promotes tolerance in normal tissues > Results > LEM inhibits PD-L1 on tumor cells and tumor-infiltrating myeloid cells.
plaindirect- Asserted: passes — The authors put it forward as true.
- Checkable: passes — It can be checked against evidence.
- Load-bearing: unclear — It is unclear whether the paper’s conclusions depend on it.
- Based: passes — The paper gives a reason why it holds.
It may state two separate claims as one.
A result the paper reports from its own data — it cites no other source for it, so there is none to check. The quote shows it is in the paper.
In the paper
“Compared with vehicle, all treatments increased the frequencies of both IFN-γ+CD8+ (Tc1) and IFN-γ+CD4+ (Th1) subsets, although the highest frequencies of Tc1 were observed in mice receiving 9D9 plus LEM (Figure 5, E and F).”
§ Targeting HIF-1α abrogates PD-L1–mediated immune evasion in tumor microenvironment but promotes tolerance in normal tissues > Results > LEM inhibits PD-L1 on tumor cells and tumor-infiltrating myeloid cells.
plaindirect- Asserted: passes — The authors put it forward as true.
- Checkable: passes — It can be checked against evidence.
- Load-bearing: passes — The paper’s conclusions depend on it.
- Based: passes — The paper gives a reason why it holds.
It may state two separate claims as one.
A result the paper reports from its own data — it cites no other source for it, so there is none to check. The quote shows it is in the paper.
In the paper
“The same trend was seen for CD4+ TILs, although the difference between the 9D9 and 9D9 plus LEM groups was not significant (Figure 6D).”
§ Targeting HIF-1α abrogates PD-L1–mediated immune evasion in tumor microenvironment but promotes tolerance in normal tissues > Results > LEM inhibits PD-L1 on tumor cells and tumor-infiltrating myeloid cells.
plain- Asserted: passes — The authors put it forward as true.
- Checkable: passes — It can be checked against evidence.
- Load-bearing: unclear — It is unclear whether the paper’s conclusions depend on it.
- Based: passes — The paper gives a reason why it holds.
It may state two separate claims as one.
A result the paper reports from its own data — it cites no other source for it, so there is none to check. The quote shows it is in the paper.
In the paper
“None of the therapies significantly impacted frequencies of tumor-infiltrating Treg or Th17 cells, except for a modest decrease in Tregs for groups receiving 9D9 (Supplemental Figure 5, I and J).”
§ Targeting HIF-1α abrogates PD-L1–mediated immune evasion in tumor microenvironment but promotes tolerance in normal tissues > Results > LEM inhibits PD-L1 on tumor cells and tumor-infiltrating myeloid cells.
plain- Asserted: passes — The authors put it forward as true.
- Checkable: passes — It can be checked against evidence.
- Load-bearing: unclear — It is unclear whether the paper’s conclusions depend on it.
- Based: passes — The paper gives a reason why it holds.
It may state two separate claims as one.
A result the paper reports from its own data — it cites no other source for it, so there is none to check. The quote shows it is in the paper.
In the paper
“Roughly one-fifth of CD4+ TILs were granzyme B+, which was not significantly affected by drug treatments (Figure 6G).”
§ Targeting HIF-1α abrogates PD-L1–mediated immune evasion in tumor microenvironment but promotes tolerance in normal tissues > Results > LEM inhibits PD-L1 on tumor cells and tumor-infiltrating myeloid cells.
plain- Asserted: passes — The authors put it forward as true.
- Checkable: passes — It can be checked against evidence.
- Load-bearing: unclear — It is unclear whether the paper’s conclusions depend on it.
- Based: passes — The paper gives a reason why it holds.
It may state two separate claims as one.
A result the paper reports from its own data — it cites no other source for it, so there is none to check. The quote shows it is in the paper.
In the paper
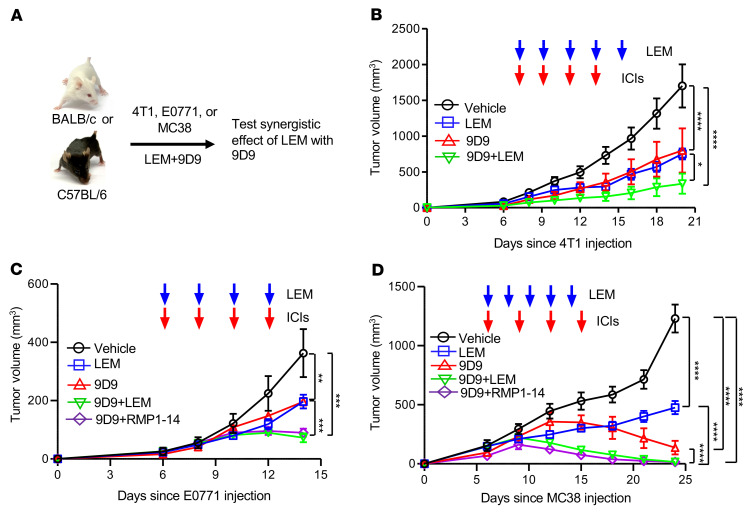
“we observed significant inhibition of tumor growth by LEM or 9D9 monotherapy compared with vehicle, while the greatest inhibition was achieved by 9D9 plus LEM or RMP1-14 (Figure 4, C and D).”
§ Targeting HIF-1α abrogates PD-L1–mediated immune evasion in tumor microenvironment but promotes tolerance in normal tissues > Results > HIF-1α inhibition potentiates anti–CTLA-4 immunotherapy.
plaindirect- Asserted: passes — The authors put it forward as true.
- Checkable: passes — It can be checked against evidence.
- Load-bearing: passes — The paper’s conclusions depend on it.
- Based: passes — The paper gives a reason why it holds.
It may state two separate claims as one.
A result the paper reports from its own data — it cites no other source for it, so there is none to check. The quote shows it is in the paper.
In the paper
“E0771 mice treated with 9D9 had higher expression of exhaustion marker PD-1 on CD8+ TILs compared with vehicle, which was reversed by LEM (Figure 6A).”
§ Targeting HIF-1α abrogates PD-L1–mediated immune evasion in tumor microenvironment but promotes tolerance in normal tissues > Results > LEM inhibits PD-L1 on tumor cells and tumor-infiltrating myeloid cells.
plaindirect- Asserted: passes — The authors put it forward as true.
- Checkable: passes — It can be checked against evidence.
- Load-bearing: passes — The paper’s conclusions depend on it.
- Based: passes — The paper gives a reason why it holds.
It may state two separate claims as one.
A result the paper reports from its own data — it cites no other source for it, so there is none to check. The quote shows it is in the paper.
In the paper
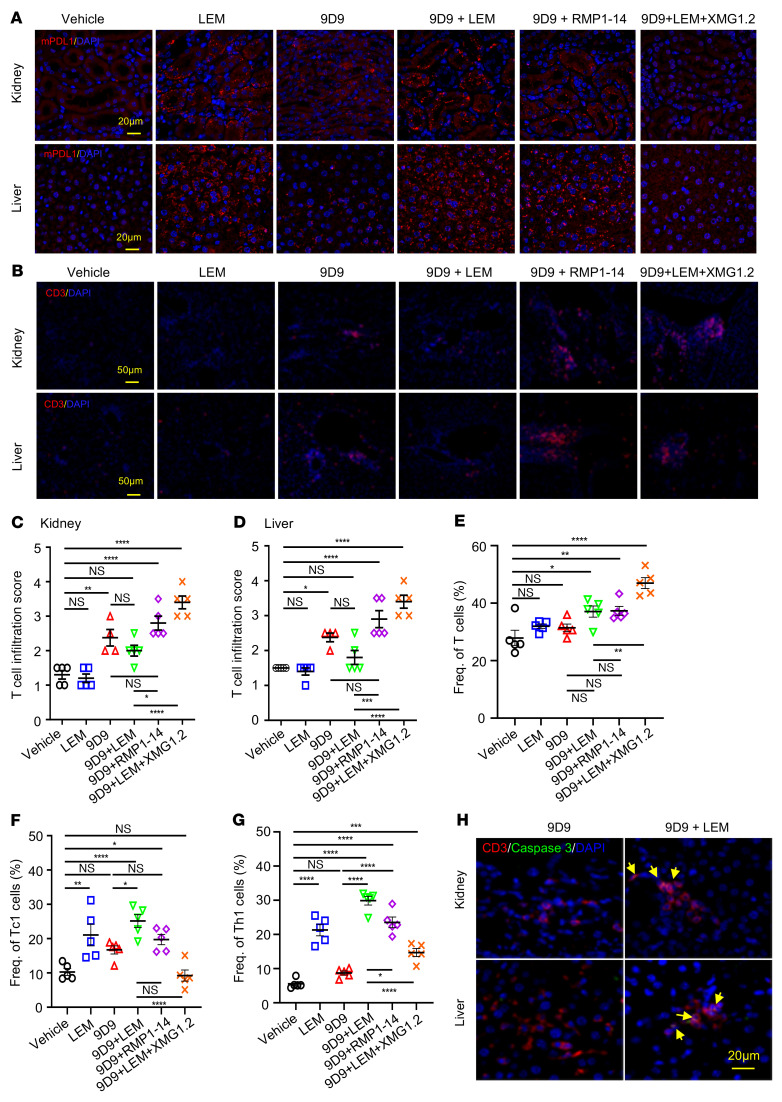
“LEM alone did not stimulate increased infiltration of T or NK cells in the tissues with PD-L1 expression (Figure 7, B–D, and Supplemental Figure 11), but led to a modest increase in IFN-γ detected in the serum (Supplemental Figure 12).”
§ Targeting HIF-1α abrogates PD-L1–mediated immune evasion in tumor microenvironment but promotes tolerance in normal tissues > Results > LEM induces PD-L1 expression to limit anti–CTLA-4–induced T cell infiltration in irAE target organs.
plaindirect- Asserted: passes — The authors put it forward as true.
- Checkable: passes — It can be checked against evidence.
- Load-bearing: passes — The paper’s conclusions depend on it.
- Based: passes — The paper gives a reason why it holds.
It may state two separate claims as one.
A result the paper reports from its own data — it cites no other source for it, so there is none to check. The quote shows it is in the paper.
In the paper
“These studies revealed that optimal efficacy required all 3 cell types, with CD8+ cells being the most critical, followed by NK and CD4+ cells (Figure 6I).”
§ Targeting HIF-1α abrogates PD-L1–mediated immune evasion in tumor microenvironment but promotes tolerance in normal tissues > Results > LEM inhibits PD-L1 on tumor cells and tumor-infiltrating myeloid cells.
plaindirect- Asserted: passes — The authors put it forward as true.
- Checkable: passes — It can be checked against evidence.
- Load-bearing: passes — The paper’s conclusions depend on it.
- Based: passes — The paper gives a reason why it holds.
It may state two separate claims as one.
A result the paper reports from its own data — it cites no other source for it, so there is none to check. The quote shows it is in the paper.
In the paper
“the anti–IFN-γ neutralizing mAb XMG1.2, which abrogated PD-L1 induction by 9D9 plus LEM treatment and increased T cell infiltration in the kidneys and liver (Figure 7, B–D).”
§ Targeting HIF-1α abrogates PD-L1–mediated immune evasion in tumor microenvironment but promotes tolerance in normal tissues > Results > LEM induces PD-L1 expression to limit anti–CTLA-4–induced T cell infiltration in irAE target organs.
plaindirect- Asserted: passes — The authors put it forward as true.
- Checkable: passes — It can be checked against evidence.
- Load-bearing: passes — The paper’s conclusions depend on it.
- Based: passes — The paper gives a reason why it holds.
It may state two separate claims as one.
A result the paper reports from its own data — it cites no other source for it, so there is none to check. The quote shows it is in the paper.
In the paper
“the frequency of T cells as well as those of Tc1 and Th1 expanded in the spleen of mice that received 9D9 plus LEM treatment (Figure 7, E–G).”
§ Targeting HIF-1α abrogates PD-L1–mediated immune evasion in tumor microenvironment but promotes tolerance in normal tissues > Results > LEM induces PD-L1 expression to limit anti–CTLA-4–induced T cell infiltration in irAE target organs.
plaindirect- Asserted: passes — The authors put it forward as true.
- Checkable: passes — It can be checked against evidence.
- Load-bearing: passes — The paper’s conclusions depend on it.
- Based: passes — The paper gives a reason why it holds.
It may state two separate claims as one.
A conclusion the paper draws from its own results — it cites no other source for it, so there is none to check. The quote shows it is in the paper.
In the paper
“These results demonstrate that HIF-1α controls PD-L1 expression in E0771 cells and that echinomycin reduced PD-L1 by inhibiting the HIF-1α/PD-L1 axis.”
§ Targeting HIF-1α abrogates PD-L1–mediated immune evasion in tumor microenvironment but promotes tolerance in normal tissues > Results > Targeting HIF-1α suppresses PD-L1 expression in the TME.
boosteddirect- Asserted: passes — The authors put it forward as true.
- Checkable: passes — It can be checked against evidence.
- Load-bearing: passes — The paper’s conclusions depend on it.
- Based: passes — The paper gives a reason why it holds.
It may state two separate claims as one.
A conclusion the paper draws from its own results — it cites no other source for it, so there is none to check. The quote shows it is in the paper.
In the paper
“Thus, the immunotherapeutic effects of pharmacological HIF-1α inhibition in the context of anti–CTLA-4 are multiple-cell dependent, but primarily depend on CD8+ T cells.”
§ Targeting HIF-1α abrogates PD-L1–mediated immune evasion in tumor microenvironment but promotes tolerance in normal tissues > Results > LEM inhibits PD-L1 on tumor cells and tumor-infiltrating myeloid cells.
plaindirect- Asserted: passes — The authors put it forward as true.
- Checkable: passes — It can be checked against evidence.
- Load-bearing: passes — The paper’s conclusions depend on it.
- Based: passes — The paper gives a reason why it holds.
It may state two separate claims as one.
None of the sources cited for this claim have been checked yet.
In the paper
“HIF-1α is generally inactivated in normal tissues but frequently stabilized in tumor cells regardless of oxygen tension (49, 50).”
§ Targeting HIF-1α abrogates PD-L1–mediated immune evasion in tumor microenvironment but promotes tolerance in normal tissues > Discussion
plaincorrelational- Asserted: passes — The authors put it forward as true.
- Checkable: passes — It can be checked against evidence.
- Load-bearing: passes — The paper’s conclusions depend on it.
- Based: passes — The paper gives a reason why it holds.
It may state two separate claims as one.
A conclusion the paper draws from its own results — it cites no other source for it, so there is none to check. The quote shows it is in the paper.
In the paper
“Here, we showed that targeting HIF-1α not only overcomes immune evasion in the TME, but also fortifies the immune tolerance checkpoint in normal tissues.”
§ Targeting HIF-1α abrogates PD-L1–mediated immune evasion in tumor microenvironment but promotes tolerance in normal tissues > Discussion
boosteddirect- Asserted: passes — The authors put it forward as true.
- Checkable: passes — It can be checked against evidence.
- Load-bearing: passes — The paper’s conclusions depend on it.
- Based: passes — The paper gives a reason why it holds.
It may state two separate claims as one.
- Rests on an assumption: The current approach that overcomes tumor evasion of host immunity also disables the immune tolerance checkpoint, leading to significant irAEs, particularly when used in conjunction with anti–CTLA-4 antibodies.
A conclusion the paper draws from its own results — it cites no other source for it, so there is none to check. The quote shows it is in the paper.
In the paper
“The results show that, in addition to tumor cells, in vivo HIF-1α inhibition can also suppress PD-L1 on tumor-infiltrating myeloid cells, and these effects persist in the context of anti–CTLA-4 therapy.”
§ Targeting HIF-1α abrogates PD-L1–mediated immune evasion in tumor microenvironment but promotes tolerance in normal tissues > Results > LEM inhibits PD-L1 on tumor cells and tumor-infiltrating myeloid cells.
plaindirect- Asserted: passes — The authors put it forward as true.
- Checkable: passes — It can be checked against evidence.
- Load-bearing: passes — The paper’s conclusions depend on it.
- Based: passes — The paper gives a reason why it holds.
It may state two separate claims as one.
In the paper
“The GI tract is the most frequent target of irAEs (31).”
§ Targeting HIF-1α abrogates PD-L1–mediated immune evasion in tumor microenvironment but promotes tolerance in normal tissues > Results > LEM protected ipilimumab-induced irAEs in human CTLA4–knockin mice.
What the sources say
- Not checked yetcites [31] source
plain- Asserted: passes — The authors put it forward as true.
- Checkable: passes — It can be checked against evidence.
- Load-bearing: fails — The paper’s conclusions may not depend on it.
- Based: passes — The paper gives a reason why it holds.
Probably not a substantial claim. The paper’s conclusions may not depend on it.
A conclusion the paper draws from its own results — it cites no other source for it, so there is none to check. The quote shows it is in the paper.
In the paper
“Our data suggest that targeting HIF-1α fortifies the immune tolerance function of the PD-1/PD-L1 checkpoint in normal tissues but abrogates its immune evasion function in the tumor microenvironment to achieve safer and more effective immunotherapy.”
§ Targeting HIF-1α abrogates PD-L1–mediated immune evasion in tumor microenvironment but promotes tolerance in normal tissues > Abstract
hedgeddirect- Asserted: passes — The authors put it forward as true.
- Checkable: passes — It can be checked against evidence.
- Load-bearing: passes — The paper’s conclusions depend on it.
- Based: passes — The paper gives a reason why it holds.
It may state two separate claims as one.
In the paper
“On the other hand, studies by Johnson and colleagues found HIF-1α to be essential for myeloid cell–mediated inflammation (40).”
§ Targeting HIF-1α abrogates PD-L1–mediated immune evasion in tumor microenvironment but promotes tolerance in normal tissues > Discussion
What the sources say
- Not checked yetcites [40] source
plaindirect- Asserted: passes — The authors put it forward as true.
- Checkable: passes — It can be checked against evidence.
- Load-bearing: fails — The paper’s conclusions may not depend on it.
- Based: passes — The paper gives a reason why it holds.
Probably not a substantial claim. The paper’s conclusions may not depend on it.
In the paper
“While HIF-1α has been shown to be involved in degradation of Foxp3 and induce the Th17 phenotype (26)”
§ Targeting HIF-1α abrogates PD-L1–mediated immune evasion in tumor microenvironment but promotes tolerance in normal tissues > Discussion
What the sources say
- Not checked yetcites [26] source
plaindirect- Asserted: passes — The authors put it forward as true.
- Checkable: passes — It can be checked against evidence.
- Load-bearing: fails — The paper’s conclusions may not depend on it.
- Based: passes — The paper gives a reason why it holds.
Probably not a substantial claim. The paper’s conclusions may not depend on it. It may state two separate claims as one.
What the paper did — it cites no source for this, so there is none to check. The quote shows it is in the paper.
In the paper
“Sample sizes were chosen with adequate statistical power on the basis of the literature and past experience.”
§ Targeting HIF-1α abrogates PD-L1–mediated immune evasion in tumor microenvironment but promotes tolerance in normal tissues > Methods > Statistics.
plain- Asserted: passes — The authors put it forward as true.
- Checkable: passes — It can be checked against evidence.
- Load-bearing: fails — The paper’s conclusions may not depend on it.
- Based: fails — The paper may give no reason why it holds.
Probably not a substantial claim. The paper’s conclusions may not depend on it. The paper may give no reason why it holds.
In the paper
“Sitkovsky’s group originally demonstrated the first in vitro evidence that hypoxia is immunosuppressive for T cells (36)”
§ Targeting HIF-1α abrogates PD-L1–mediated immune evasion in tumor microenvironment but promotes tolerance in normal tissues > Discussion
What the sources say
- Not checked yetcites [36] source
boosteddirect- Asserted: passes — The authors put it forward as true.
- Checkable: passes — It can be checked against evidence.
- Load-bearing: fails — The paper’s conclusions may not depend on it.
- Based: passes — The paper gives a reason why it holds.
Probably not a substantial claim. The paper’s conclusions may not depend on it.
What the paper did — it cites no source for this, so there is none to check. The quote shows it is in the paper.
In the paper
“All experiments were replicated at least twice with similar results.”
§ Targeting HIF-1α abrogates PD-L1–mediated immune evasion in tumor microenvironment but promotes tolerance in normal tissues > Methods > Statistics.
plain- Asserted: passes — The authors put it forward as true.
- Checkable: passes — It can be checked against evidence.
- Load-bearing: fails — The paper’s conclusions may not depend on it.
- Based: passes — The paper gives a reason why it holds.
Probably not a substantial claim. The paper’s conclusions may not depend on it.
A conclusion the paper draws from its own results — it cites no other source for it, so there is none to check. The quote shows it is in the paper.
In the paper
“Thus, the data presented herein revealed a cancer cell–intrinsic inhibition of PD-L1 and normal tissue cell–extrinsic induction of PD-L1 by LEM.”
§ Targeting HIF-1α abrogates PD-L1–mediated immune evasion in tumor microenvironment but promotes tolerance in normal tissues > Discussion
plaindirect- Asserted: passes — The authors put it forward as true.
- Checkable: passes — It can be checked against evidence.
- Load-bearing: passes — The paper’s conclusions depend on it.
- Based: passes — The paper gives a reason why it holds.
It may state two separate claims as one.
In the paper
“According to Doedens et al., HIFs enhance the effector responses of CD8+ T cells to persistent antigen (42).”
§ Targeting HIF-1α abrogates PD-L1–mediated immune evasion in tumor microenvironment but promotes tolerance in normal tissues > Discussion
What the sources say
- Not checked yetcites [42] source
plaindirect- Asserted: passes — The authors put it forward as true.
- Checkable: passes — It can be checked against evidence.
- Load-bearing: fails — The paper’s conclusions may not depend on it.
- Based: passes — The paper gives a reason why it holds.
Probably not a substantial claim. The paper’s conclusions may not depend on it.
A conclusion the paper draws from its own results — it cites no other source for it, so there is none to check. The quote shows it is in the paper.
In the paper
“The induced PD-L1 is causatively associated with reduction in inflammation and intestinal leakage induced by anti–CTLA-4 antibodies, as it is abrogated by anti–PD-1 antibodies.”
§ Targeting HIF-1α abrogates PD-L1–mediated immune evasion in tumor microenvironment but promotes tolerance in normal tissues > Discussion
plaindirect- Asserted: passes — The authors put it forward as true.
- Checkable: passes — It can be checked against evidence.
- Load-bearing: passes — The paper’s conclusions depend on it.
- Based: passes — The paper gives a reason why it holds.
It may state two separate claims as one.
What the paper did — it cites no source for this, so there is none to check. The quote shows it is in the paper.
In the paper
“All procedures involving experimental animals were approved by the Institutional Animal Care and Use Committee (IACUC) of the University of Maryland School of Medicine.”
§ Targeting HIF-1α abrogates PD-L1–mediated immune evasion in tumor microenvironment but promotes tolerance in normal tissues > Methods > Study approval.
plain- Asserted: passes — The authors put it forward as true.
- Checkable: passes — It can be checked against evidence.
- Load-bearing: fails — The paper’s conclusions may not depend on it.
- Based: passes — The paper gives a reason why it holds.
Probably not a substantial claim. The paper’s conclusions may not depend on it.
What the paper did — it cites no source for this, so there is none to check. The quote shows it is in the paper.
In the paper
“On day 6 after transplantation, mice were assigned to treatment groups such that comparable initial mean tumor volumes between experimental and control groups were achieved.”
§ Targeting HIF-1α abrogates PD-L1–mediated immune evasion in tumor microenvironment but promotes tolerance in normal tissues > Methods > Tumor models.
plain- Asserted: passes — The authors put it forward as true.
- Checkable: passes — It can be checked against evidence.
- Load-bearing: passes — The paper’s conclusions depend on it.
- Based: passes — The paper gives a reason why it holds.
Probably not a substantial claim.
In the paper
“We have reported that echinomycin effectively eliminated leukemia stem cells (34).”
§ Targeting HIF-1α abrogates PD-L1–mediated immune evasion in tumor microenvironment but promotes tolerance in normal tissues > Discussion
What the sources say
- Not checked yetcites [34] source
plaindirect- Asserted: passes — The authors put it forward as true.
- Checkable: passes — It can be checked against evidence.
- Load-bearing: fails — The paper’s conclusions may not depend on it.
- Based: passes — The paper gives a reason why it holds.
Probably not a substantial claim. The paper’s conclusions may not depend on it.
A conclusion the paper draws from its own results — it cites no other source for it, so there is none to check. The quote shows it is in the paper.
In the paper
“Together, these 2 activities provide what we believe is the first example in cancer immunotherapy of an approach that abrogates the PD-1–PD-L1 checkpoint in the TME to eliminate immune evasion by cancer cells, while fortifying its immune tolerance checkpoint activity in normal tissues.”
§ Targeting HIF-1α abrogates PD-L1–mediated immune evasion in tumor microenvironment but promotes tolerance in normal tissues > Discussion
hedgeddirect- Asserted: passes — The authors put it forward as true.
- Checkable: passes — It can be checked against evidence.
- Load-bearing: passes — The paper’s conclusions depend on it.
- Based: passes — The paper gives a reason why it holds.
It may state two separate claims as one.
None of the sources cited for this claim have been checked yet.
In the paper
“In T cells, HIF-1α is transiently stabilized in T cells following TCR activation (41), and plays an important role in regulating Treg and Th17 balance (26).”
§ Targeting HIF-1α abrogates PD-L1–mediated immune evasion in tumor microenvironment but promotes tolerance in normal tissues > Discussion
plaindirect- Asserted: passes — The authors put it forward as true.
- Checkable: passes — It can be checked against evidence.
- Load-bearing: unclear — It is unclear whether the paper’s conclusions depend on it.
- Based: passes — The paper gives a reason why it holds.
It may state two separate claims as one.
None of the sources cited for this claim have been checked yet.
In the paper
“Targeting HIF-1α in immunotherapy is a relatively new concept, for which proof of principle has been amply demonstrated by others (12, 23, 27).”
§ Targeting HIF-1α abrogates PD-L1–mediated immune evasion in tumor microenvironment but promotes tolerance in normal tissues > Discussion
What the sources say
boosted- Asserted: passes — The authors put it forward as true.
- Checkable: passes — It can be checked against evidence.
- Load-bearing: fails — The paper’s conclusions may not depend on it.
- Based: passes — The paper gives a reason why it holds.
Probably not a substantial claim. The paper’s conclusions may not depend on it. It may state two separate claims as one.
In the paper
“its function in inducing the Th1 phenotype has also been reported (51).”
§ Targeting HIF-1α abrogates PD-L1–mediated immune evasion in tumor microenvironment but promotes tolerance in normal tissues > Discussion
What the sources say
- Not checked yetcites [51] source
plaindirect- Asserted: passes — The authors put it forward as true.
- Checkable: passes — It can be checked against evidence.
- Load-bearing: fails — The paper’s conclusions may not depend on it.
- Based: passes — The paper gives a reason why it holds.
Probably not a substantial claim. The paper’s conclusions may not depend on it.
A conclusion the paper draws from its own results — it cites no other source for it, so there is none to check. The quote shows it is in the paper.
In the paper
“In contrast to anti–PD-1, LEM not only further enhanced anti–CTLA-4–induced PD-L1 in normal tissue, but also allowed PD-L1 to signal through PD-1 to supercharge the immune tolerance checkpoint function.”
§ Targeting HIF-1α abrogates PD-L1–mediated immune evasion in tumor microenvironment but promotes tolerance in normal tissues > Discussion
plaindirect- Asserted: passes — The authors put it forward as true.
- Checkable: passes — It can be checked against evidence.
- Load-bearing: passes — The paper’s conclusions depend on it.
- Based: passes — The paper gives a reason why it holds.
It may state two separate claims as one.
In the paper
“All animal experiments were conducted according to guidelines established by the NIH Guide for the Care and Use of Laboratory Animals (National Academies Press, 2011).”
§ Targeting HIF-1α abrogates PD-L1–mediated immune evasion in tumor microenvironment but promotes tolerance in normal tissues > Methods > Study approval.
What the sources say
- Not checked yetcites National Academies Press, 2011
plain- Asserted: passes — The authors put it forward as true.
- Checkable: passes — It can be checked against evidence.
- Load-bearing: fails — The paper’s conclusions may not depend on it.
- Based: passes — The paper gives a reason why it holds.
Probably not a substantial claim. The paper’s conclusions may not depend on it.
What the paper did — it cites no source for this, so there is none to check. The quote shows it is in the paper.
In the paper
“Appropriate statistical tests were selected on the basis of whether the data with outlier deletion was normally distributed by using the D’Agostino & Pearson normality test.”
§ Targeting HIF-1α abrogates PD-L1–mediated immune evasion in tumor microenvironment but promotes tolerance in normal tissues > Methods > Statistics.
plain- Asserted: passes — The authors put it forward as true.
- Checkable: passes — It can be checked against evidence.
- Load-bearing: fails — The paper’s conclusions may not depend on it.
- Based: passes — The paper gives a reason why it holds.
Probably not a substantial claim. The paper’s conclusions may not depend on it.
The paper relies on this without support.
Clinical development of echinomycin for solid tumors has met with minimal success.
“However, clinical development of echinomycin for solid tumors has met with minimal success.”
The paper relies on this without support.
The current approach that overcomes tumor evasion of host immunity also disables the immune tolerance checkpoint, leading to significant irAEs, particularly when used in conjunction with anti–CTLA-4 antibodies.
“However, the current approach that overcomes tumor evasion of host immunity also disables the immune tolerance checkpoint, leading to significant irAEs, particularly when used in conjunction with anti–CTLA-4 antibodies.”
Claims other papers make about this one
Each is checked against this paper’s own text: does it say what the citing paper says it does?
In the citing paper
“Bailey, Liu, et al. in this issue demonstrate that targeting HIF-1α abrogated PD-L1–mediated immune evasion by suppressing PD-L1 expression on malignant and myeloid regulatory cells, causing tumor rejection.”
From Cross-talk between HIF and PD-1/PD-L1 pathways in carcinogenesis and therapy (2022) · cites this paper as [24]
In the citing paper
“Bailey, Liu, et al. confirmed these results (24).”
From Cross-talk between HIF and PD-1/PD-L1 pathways in carcinogenesis and therapy (2022) · cites this paper as [24]
In the citing paper
“Importantly, HIF-1α inhibition potentiated immunotherapeutic effects of anti–CTLA-4 therapy in experimental models.”
From Cross-talk between HIF and PD-1/PD-L1 pathways in carcinogenesis and therapy (2022) · cites this paper as [24]
In the citing paper
“HIF-1α inhibition in vivo downregulated PD-1 expression, upregulated cytolytic effector molecules granzyme B and perforin, and decreased apoptosis in TILs in the tumor microenvironment.”
From Cross-talk between HIF and PD-1/PD-L1 pathways in carcinogenesis and therapy (2022) · cites this paper as [24]
In the citing paper
“Promotion of immune tolerance by differential regulation of PD-L1 in normal and cancer tissues is an important approach for safer and more successful immunotherapy (24).”
From Cross-talk between HIF and PD-1/PD-L1 pathways in carcinogenesis and therapy (2022) · cites this paper as [24]
In the citing paper
“The authors also reported an interesting observation; although HIF-1α inhibition blocked PD-L1 expression at the tumor site, it induced PD-L1 in normal tissues.”
From Cross-talk between HIF and PD-1/PD-L1 pathways in carcinogenesis and therapy (2022) · cites this paper as [24]
Citations
Cites
PD-1 and PD-L1 Immune Checkpoint Blockade to Treat Breast Cancer
Hartkopf, A. D., Taran, F., Wallwiener, M., Walter, C. B., Krämer, B., Grischke, E., & Brucker, S. Y. (2016) · Breast Care · doi:10.1159/000453569 · Cited by 30,989
Adverse Renal Effects of Immune Checkpoint Inhibitors: A Narrative Review
Wanchoo, R., Karam, S., Uppal, N. N., Barta, V. S., Deray, G., Devoe, C., Launay‐Vacher, V., Jhaveri, K. D., & on behalf of Cancer and Kidney International Network Workgroup on Immune Checkpoint Inhibitors (2017) · American Journal of Nephrology · doi:10.1159/000455014 · Cited by 15,320
Combined Nivolumab and Ipilimumab or Monotherapy in Untreated Melanoma
Larkin, J., Chiarion-Sileni, V., Gonzalez, R., Grob, J. J., Cowey, C. L., Lao, C. D., Schadendorf, D., Dummer, R., Smylie, M., Rutkowski, P., et al. (2015) · New England Journal of Medicine · doi:10.1056/nejmoa1504030 · Cited by 8,157
Targeting HIF-1 for cancer therapy
Semenza, G. L. (2003) · Nature Reviews Cancer · doi:10.1038/nrc1187 · Cited by 6,717 · cited 1×
“Discussion HIF-1α inhibition is an area of active investigation in cancer therapy (32, 33).”
Overall Survival with Combined Nivolumab and Ipilimumab in Advanced Melanoma
Wolchok, J. D., Chiarion-Sileni, V., Gonzalez, R., Rutkowski, P., Grob, J.-J., Cowey, C. L., Lao, C. D., Wagstaff, J., Schadendorf, D., Ferrucci, P. F., et al. (2017) · New England Journal of Medicine · doi:10.1056/nejmoa1709684 · Cited by 5,357
Tumor-associated B7-H1 promotes T-cell apoptosis: A potential mechanism of immune evasion
Dong, H., Strome, S. E., Salomao, D. R., Tamura, H., Hirano, F., Flies, D. B., Roche, P. C., Lu, J., Zhu, G., Tamada, K., et al. (2002) · Nature Medicine · doi:10.1038/nm730 · Cited by 5,025
Targeting Hypoxia-Inducible Factors for the Treatment of Anemia in Chronic Kidney Disease Patients
Locatelli, F., Fishbane, S. N., Block, G. A., & Macdougall, I. C. (2017) · American Journal of Nephrology · doi:10.1159/000455166 · Cited by 4,836
Nivolumab plus Ipilimumab versus Sunitinib in Advanced Renal-Cell Carcinoma
Motzer, R. J., Tannir, N. M., McDermott, D. F., Arén Frontera, O., Melichar, B., Choueiri, T. K., Plimack, E. R., Barthélémy, P., Porta, C., George, S., et al. (2018) · New England Journal of Medicine · doi:10.1056/nejmoa1712126 · Cited by 4,656
Restoring function in exhausted CD8 T cells during chronic viral infection
Barber, D. L., Wherry, E. J., Masopust, D., Zhu, B., Allison, J. P., Sharpe, A. H., Freeman, G. J., & Ahmed, R. (2005) · Nature · doi:10.1038/nature04444 · Cited by 4,057
Five-Year Survival with Combined Nivolumab and Ipilimumab in Advanced Melanoma
Larkin, J., Chiarion-Sileni, V., Gonzalez, R., Grob, J.-J., Rutkowski, P., Lao, C. D., Cowey, C. L., Schadendorf, D., Wagstaff, J., Dummer, R., et al. (2019) · New England Journal of Medicine · doi:10.1056/nejmoa1910836 · Cited by 3,723 · cited 3×
“In terms of therapeutic efficacy, anti–CTLA-4 plus anti–PD-1 combination therapy is considered the most effective immunotherapy strategy (5).”
Cited by
Sorted by citations
Regulatory mechanisms of PD-1/PD-L1 in cancers
Lin, X., Kang, K., Chen, P., Zeng, Z., Li, G., Xiong, W., Yi, M., & Xiang, B. (2024) · Molecular Cancer · doi:10.1186/s12943-024-02023-w · Cited by 909
Metabolic reprogramming in cancer: Mechanisms and therapeutics
Nong, S., Han, X., Yu, X., Qian, Y., Wei, Y., Zhang, T., Tian, K., Shen, K., Yang, J., & Ma, X. (2023) · MedComm · doi:10.1002/mco2.218 · Cited by 313
PD-1/PD-L1 checkpoint inhibitors in advanced hepatocellular carcinoma immunotherapy
Li, Q., Han, J., Yang, Y., & Chen, Y. (2022) · Frontiers in Immunology · doi:10.3389/fimmu.2022.1070961 · Cited by 255
Regulatory T cells in immune checkpoint blockade antitumor therapy
Zhang, A., Fan, T., Liu, Y., Yu, G., Li, C., & Jiang, Z. (2024) · Molecular Cancer · doi:10.1186/s12943-024-02156-y · Cited by 174
Self-citationRibonucleotide reductase M2 (RRM2): Regulation, function and targeting strategy in human cancer
Zuo, Z., Zhou, Z., Chang, Y., Liu, Y., Shen, Y., Li, Q., & Zhang, L. (2022) · Genes & Diseases · doi:10.1016/j.gendis.2022.11.022 · Cited by 132
Self-citationYang, J., Ren, B., Yin, X., Xiang, L., Hua, Y., Huang, X., Wang, H., Mao, Z., Chen, W., & Deng, J. (2024) · Advanced Materials · doi:10.1002/adma.202402720 · Cited by 125
Hypoxia signaling in cancer: Implications for therapeutic interventions
Zhuang, Y., Liu, K., He, Q., Gu, X., Jiang, C., & Wu, J. (2023) · MedComm · doi:10.1002/mco2.203 · Cited by 119
Cross-talk between HIF and PD-1/PD-L1 pathways in carcinogenesis and therapy
Shurin, M. R., & Umansky, V. (2022) · Journal of Clinical Investigation · doi:10.1172/jci159473 · Cited by 113
Fu, Y., Mackowiak, B., Feng, D., Lu, H., Guan, Y., Lehner, T., Pan, H., Wang, X. W., He, Y., & Gao, B. (2023) · Gut · doi:10.1136/gutjnl-2022-327924 · Cited by 86
Zhang, H. W., Lv, J., Wu, H., He, Y., Li, M., Wu, C., Lv, D., Liu, Y., & Yang, H. (2025) · Science Advances · doi:10.1126/sciadv.adq3870 · Cited by 84
Self-citationTargeting lactate metabolism for cancer immunotherapy - a matter of precision
Heuser-Loy, C., Renner, K., Kreutz, M. P., & Gattinoni, L. (2022) · Seminars in Cancer Biology · doi:10.1016/j.semcancer.2022.12.001 · Cited by 77
Advances in targeting tumor microenvironment for immunotherapy
Wang, L., Zhang, L., Zhang, Z., Wu, P., Zhang, Y., & Chen, X. (2024) · Frontiers in Immunology · doi:10.3389/fimmu.2024.1472772 · Cited by 75
Lu, S., Sun, X., Zhou, Z., Tang, H., Xiao, R., Lv, Q., Wang, B., Qu, J., Yu, J., Sun, F., et al. (2023) · Frontiers in Immunology · doi:10.3389/fimmu.2023.1235575 · Cited by 68
HIF-1 and HIF-2 in cancer: structure, regulation, and therapeutic prospects
Shi, Y., & Gilkes, D. M. (2025) · Cellular and Molecular Life Sciences · doi:10.1007/s00018-024-05537-0 · Cited by 81
Stemness in solid malignancies: coping with immune attack
Agudo, J., & Miao, Y. (2024) · Nature reviews. Cancer · doi:10.1038/s41568-024-00760-0 · Cited by 58
Lactate: a rising star in tumors and inflammation
Liu, H., Pan, M., Liu, M., Zeng, L., Li, Y., Huang, Z., Guo, C., & Wang, H. (2024) · Frontiers in Immunology · doi:10.3389/fimmu.2024.1496390 · Cited by 60
Self-citationIL-27 elicits a cytotoxic CD8+ T cell program to enforce tumour control
Bréart, B., Williams, K., Krimm, S., Wong, T., Kayser, B. D., Wang, L., Cheng, E., Tleugabulova, M. C., Bouziat, R., Lu, T., et al. (2025) · Nature · doi:10.1038/s41586-024-08510-w · Cited by 55
Yu, H., Li, J., Peng, S., Liu, Q., Chen, D., He, Z., Xiang, J., & Wang, B. (2024) · Cancer Letters · doi:10.1016/j.canlet.2024.217385 · Cited by 56
Qiu, X., Wang, A., Wang, J., Zhang, Z., & Tao, L. (2025) · Cell Death Discovery · doi:10.1038/s41420-025-02670-y · Cited by 58
Targeting intratumoral hypoxia to enhance anti-tumor immunity
Semenza, G. L. (2023) · Seminars in Cancer Biology · doi:10.1016/j.semcancer.2023.09.002 · Cited by 47
Immunocytes in the tumor microenvironment: recent updates and interconnections
Yu, J., Fu, L., Wu, R., Che, L., Liu, G., Ran, Q., Xia, Z., Liang, X., & Zhao, G. (2025) · Frontiers in Immunology · doi:10.3389/fimmu.2025.1517959 · Cited by 52
The impact of hypoxia on tumor-mediated bypassing anti-PD-(L)1 therapy
Mortezaee, K., Majidpoor, J., & Kharazinejad, E. (2023) · Biomedicine & Pharmacotherapy · doi:10.1016/j.biopha.2023.114646 · Cited by 45
Zhang, T., Tai, Z., Miao, F., Zhang, X., Li, J., Zhu, Q., Wei, H., & Chen, Z. (2024) · Journal of Controlled Release · doi:10.1016/j.jconrel.2024.02.033 · Cited by 47
Altered cancer metabolism and implications for next-generation CAR T-cell therapies
Ramapriyan, R., Vykunta, V. S., Vandecandelaere, G., Richardson, L. G., Sun, J. M., Curry, W. T., & Choi, B. D. (2024) · Pharmacology & Therapeutics · doi:10.1016/j.pharmthera.2024.108667 · Cited by 48
Research progress of HIF-1a on immunotherapy outcomes in immune vascular microenvironment
Shi, S., Ou, X., Liu, C., Wen, H., & Ke, J. (2025) · Frontiers in Immunology · doi:10.3389/fimmu.2025.1549276 · Cited by 42
Wang, S., Zhang, X., Chen, Q., Wu, H., Cao, S., Zhao, S., Li, G., Wang, J., Gong, Y., Wang, X., et al. (2024) · Journal of Advanced Research · doi:10.1016/j.jare.2024.12.026 · Cited by 42
Wang, Z., Zhu, M., Dong, R., Cao, D., Li, Y., Chen, Z., Cai, J., & Zuo, X. (2023) · Journal of Nanobiotechnology · doi:10.1186/s12951-023-02203-8 · Cited by 40
Song, C. W., Kim, H., Cho, H., Kim, M., Paek, S.-H., Park, H. J., Griffin, R. J., Terezakis, S. A., & Cho, L. C. (2022) · Cancers · doi:10.3390/cancers14133273 · Cited by 35
Hypoxia, a Targetable Culprit to Counter Pancreatic Cancer Resistance to Therapy
Khouzam, R. A., Lehn, J., Mayr, H., Clavien, P., Wallace, M. B., Ducreux, M. P., Limani, P., & Chouaïb, S. (2023) · Cancers · doi:10.3390/cancers15041235 · Cited by 33
Shafqat, A., Omer, M. H., Ahmed, E. N., Mushtaq, A. H., Ijaz, E., Ahmed, Z., AlKattan, K. M., & Yaqinuddin, A. (2023) · Frontiers in Immunology · doi:10.3389/fimmu.2023.1200941 · Cited by 32
Light‐Enhanced Hypoxia‐Responsive Gene Editing for Hypoxia‐Resistant Photodynamic and Immunotherapy
Qu, S., Ji, Y., Fan, L., Yan, T., Zhu, G., Song, H., Yang, K., & Han, X. (2023) · Advanced Healthcare Materials · doi:10.1002/adhm.202302615 · Cited by 26
Li, T., Chen, G., Lin, L., Li, B., Wang, X., Chen, Y., Huang, W., Cai, M., Xiao, Z., Shuai, X., et al. (2024) · Biomaterials · doi:10.1016/j.biomaterials.2024.122626 · Cited by 25
Fan, J., Qin, Y., Qiu, W., Liang, J., Xiao, C., Xie, Q., Tong, C., Yuan, L., Long, Y., & Liu, B. (2024) · Biomaterials · doi:10.1016/j.biomaterials.2024.122851 · Cited by 24
Wang, S., Qin, L., Liu, F., & Zhang, Z. (2025) · Cell Communication and Signaling · doi:10.1186/s12964-025-02169-0 · Cited by 24
Bao, Y., Li, G., Li, S., Zhou, H., Yang, Z., Wang, Z., Yan, R., Guo, C., & Jin, Y. (2024) · Materials Today Bio · doi:10.1016/j.mtbio.2024.101346 · Cited by 22
Jin, J., Zhao, Q., Wei, Z., Chen, K., Su, Y., Hu, X., & Peng, X. (2023) · Cell & Bioscience · doi:10.1186/s13578-023-01138-9 · Cited by 23
Su, Y., Liu, J., Tian, Y., Dong, H., Shi, M., Zhang, J., Li, W., Huang, Q., Xiang, N., Wang, C., et al. (2024) · Biomedicine & Pharmacotherapy · doi:10.1016/j.biopha.2024.116427 · Cited by 23
Yang, F., Yang, F., Kong, J., Zong, Y., Li, Q., Shao, B., & Wang, J. (2024) · Journal of Ethnopharmacology · doi:10.1016/j.jep.2024.118955 · Cited by 21
Huang, M., Yang, S., Tai, W., Zhang, L., Zhou, Y., Cho, W. C. S., Chan, L., & Wong, S. C. C. (2023) · International Journal of Molecular Sciences · doi:10.3390/ijms24108720 · Cited by 19
Gu, Y. F., Zhang, Z., Huang, H., Zhu, W., Liu, H., Zhang, R., Weng, N. P., & Sun, X. S. (2025) · Frontiers in Immunology · doi:10.3389/fimmu.2025.1528103 · Cited by 20
Hypoxia inducible factor-1ɑ as a potential therapeutic target for osteosarcoma metastasis
Zhou, J., Lan, F., Liu, M., Wang, F., Ning, X., Yang, H., & Sun, H. (2024) · Frontiers in Pharmacology · doi:10.3389/fphar.2024.1350187 · Cited by 22
Self-citationMelatonin suppresses PD-L1 expression and exerts antitumor activity in hepatocellular carcinoma
Guo, R., Rao, P.-G., Liao, B.-Z., Luo, X., Yang, W., Lei, X.-H., & Jun-ming, Y. (2025) · Scientific Reports · doi:10.1038/s41598-025-93486-4 · Cited by 16
Mechanisms of HIF-driven immunosuppression in tumour microenvironment
Bandopadhyay, S., & Patranabis, S. (2023) · Journal of the Egyptian National Cancer Institute · doi:10.1186/s43046-023-00186-z · Cited by 20
Yang, G., Li, H., Yin, J., Lei, Y., Yang, J., Tang, J., Wu, Y. P., Zhou, M., Luo, T., Zhang, Y., et al. (2024) · Ultrasonics Sonochemistry · doi:10.1016/j.ultsonch.2024.107115 · Cited by 16
Liu, S., Shao, S., Huang, Z., Xue, P., Yan, S., Cao, M., & Zeng, X. (2025) · Biomaterials · doi:10.1016/j.biomaterials.2025.123760 · Cited by 15
Li, X., Duan, Z., Li, Z., Gu, L., Li, Y., Gong, Q., Gu, Z., & Luo, K. (2023) · Biomaterials · doi:10.1016/j.biomaterials.2023.122294 · Cited by 16
Wang, P., Wang, X., Man, C., Gong, D., & Fan, Y. (2023) · Frontiers in Oncology · doi:10.3389/fonc.2023.1200619 · Cited by 17
CD3D Is an Independent Prognostic Factor and Correlates With Immune Infiltration in Gastric Cancer
Li, Y., Xu, J., Shi, Y., Jin, Z., Bao, Z., Yu, P., Wang, Y., Xia, Y., Qin, J., Zhang, B., et al. (2022) · Frontiers in Oncology · doi:10.3389/fonc.2022.913670 · Cited by 16
Self-citationYang, Y., Chen, C. O., Lyu, Y., Gololobova, O. A., Guo, X., Huang, T. Y.-T., Ramu, V. K., Talwar, V., Wicks, E. E., Salman, S., et al. (2025) · Journal of Clinical Investigation · doi:10.1172/jci190470 · Cited by 16
Bertolini, I., Perego, M., Nefedova, Y., Lin, C., Milcarek, A. T., Vogel, P., Ghosh, J. C., Kossenkov, A. V., & Altieri, D. C. (2023) · Journal of Clinical Investigation · doi:10.1172/jci164348 · Cited by 16
Fan, J., Zhu, J., Zhu, H., & Xu, H. (2024) · Critical Reviews in Oncology/Hematology · doi:10.1016/j.critrevonc.2024.104362 · Cited by 18
Chen, Y., Zuo, M., Jana, D., Zhong, W., Tan, B. S. N., Zhang, X., Chen, X., & Zhao, Y. (2024) · Biomaterials · doi:10.1016/j.biomaterials.2024.122911 · Cited by 14
Associations between HIFs and tumor immune checkpoints: mechanism and therapy
Liu, J., Jiang, Y., Chen, L., Qian, Z., & Zhang, Y. (2024) · Discover Oncology · doi:10.1007/s12672-023-00836-7 · Cited by 13
Ruan, X., Wang, P., Wei, M., Yang, Q., & Dong, X. (2024) · Journal of Ovarian Research · doi:10.1186/s13048-024-01408-1 · Cited by 13
Mechanisms of HIF1A-mediated immune evasion in gastric cancer and the impact on therapy resistance
Qi, H., Ma, X., Ma, Y., Jia, L., Liu, K., & Wang, H. (2024) · Cell Biology and Toxicology · doi:10.1007/s10565-024-09917-x · Cited by 14
Ao, K., Sun, Z., Hao, Y., Qin, J., Xu, C., Wen, X., Yang, Z., Li, L., Gan, S., Chen, X., et al. (2025) · ACS Central Science · doi:10.1021/acscentsci.5c00812 · Cited by 13
The regulatory networks and mechanisms of bone microenvironment in tumorigenesis and metastasis
Huang, G., Hou, T., Song, D., & Meng, T. (2025) · Journal of bone oncology · doi:10.1016/j.jbo.2025.100729 · Cited by 15
Hypoxic microenvironment in cancer: role in metabolic reprogramming
Sureka, N., Maheshwari, R., Agravat, A., Singhal, S., Zaman, S., Rishi, B., Siraj, F., Zaheer, S., & Misra, A. (2026) · Frontiers in Oncology · doi:10.3389/fonc.2026.1771365 · Cited by 11
The dual role of chaperone-mediated autophagy in the response and resistance to cancer immunotherapy
Saberiyan, M., Gholami, S., Ejlalidiz, M., Manshadi, M. R., Noorabadi, P., & Hamblin, M. R. (2025) · Critical Reviews in Oncology/Hematology · doi:10.1016/j.critrevonc.2025.104700 · Cited by 13
Li, Q., Shi, J., Ruan, X., Zhang, L., Fu, R., Hidayat, K., Qin, L., Xu, J., Chong, Y., & Hu, C. (2025) · Advanced Functional Materials · doi:10.1002/adfm.202510798 · Cited by 11
Bao, Y., Li, G., Liu, M., Li, S., Zhou, H., Yang, Z., Wang, Z., Guo, C., & Jin, Y. (2025) · Chemical Engineering Journal · doi:10.1016/j.cej.2025.159676 · Cited by 10
Self-citationLi, Y., Yang, L., & Zd, L. (2025) · Critical Reviews in Oncology/Hematology · doi:10.1016/j.critrevonc.2025.104883 · Cited by 11
Prediction of immunotherapy efficacy and immunomodulatory role of hypoxia in colorectal cancer
Zheng, Z., Bian, C., Wang, H., Su, J., Meng, L., Xin, Y., & Jiang, X. M. (2022) · Therapeutic Advances in Medical Oncology · doi:10.1177/17588359221138383 · Cited by 10
Jain, M., Jadhav, I. M., Dangat, S. V., Singuru, S., Sethi, G., Yuba, E., & Gupta, R. K. (2025) · Biomaterials Science · doi:10.1039/d4bm01732c · Cited by 9
Development of small molecule inhibitors of hypoxia-inducible factors for cancer therapy
Semenza, G. L. (2025) · Pharmacological Reviews · doi:10.1016/j.pharmr.2025.100075 · Cited by 10
Zhao, H., Zhang, Z., Zhang, C., Ma, H., Wan, Q., Zhao, X., Wang, X., Yan, M., Guo, H., Zhang, J., et al. (2025) · Journal of Experimental & Clinical Cancer Research · doi:10.1186/s13046-025-03438-z · Cited by 9
Yabuki, Y., Mitsuhashi, A., Ogino, H., Yoshida, A., Nguyen, N. T., Yoneda, H., Ozaki, R., Tsukazaki, Y., Morita, Y., Nokihara, H., et al. (2024) · International Journal of Cancer · doi:10.1002/ijc.35301 · Cited by 8
Zhu, Z., Qiao, P., Liu, M., Sun, F., Geng, M., & Yao, H. (2024) · Nanomedicine Nanotechnology Biology and Medicine · doi:10.1016/j.nano.2024.102764 · Cited by 8
Self-citationMontecchi, T., Nannini, G., Tommaso, D. D., Cassioli, C., Coppola, F., Ringressi, M. N., Carraro, F., Naldini, A., Taddei, A., Marotta, G., et al. (2024) · Cancer Immunology Immunotherapy · doi:10.1007/s00262-023-03614-0 · Cited by 7
YEATS2: a novel cancer epigenetic reader and potential therapeutic target
Ji, K., Chen, G., Wang, Y., Li, Y., Chen, J., & Feng, M. (2025) · Cancer Cell International · doi:10.1186/s12935-025-03797-9 · Cited by 7
Self-citationTargeting conserved domains of hypoxia-inducible factors for cancer therapy
Salman, S., Huang, T. Y., Hwang, Y., Kumar, A., Datan, E., Wicks, E. E., Cho, E., Lee, S. N., Chen, C. O., Peng, Y., et al. (2026) · The Journal of Experimental Medicine · doi:10.1084/jem.20251009 · Cited by 8
Benavente, S. (2023) · Cancer Drug Resistance · doi:10.20517/cdr.2022.141 · Cited by 7
HIF1α-dependent and independent pathways regulate the expression of PD-L1 in prostate cancer
Xanthopoulou, E. T., Kakouratos, C., Nanos, C., Gkegka, A. G., Kalaitzis, C., Giatromanolaki, A. N., & Koukourakis, M. I. (2023) · Medical Oncology · doi:10.1007/s12032-023-02017-6 · Cited by 7
Ranjbar, A., Soltanshahi, M., Taghiloo, S., & Asgarian‐Omran, H. (2023) · Iranian journal of pharmaceutical research · doi:10.5812/ijpr-140507 · Cited by 6
Chamani, F. K., Etebari, A., Hajivalili, M., Mosaffa, N., & Jalali, S. A. (2024) · Molecular Biology Reports · doi:10.1007/s11033-023-08947-8 · Cited by 6
Du, J., Chu-ting, Z., Li, T., & Li, Y. (2024) · World Journal of Hepatology · doi:10.4254/wjh.v16.i12.1371 · Cited by 6
Xu, H., Feng, Y., Kong, W., Wang, H., Feng, Y., Zhen, J., Tian, L., & Yuan, K. (2022) · Frontiers in Oncology · doi:10.3389/fonc.2022.878849 · Cited by 6
Zhang, H., Qu, C., Yang, Z., Wang, Z., Bao, Y., Tan, G., & Jin, Y. (2025) · ACS Applied Nano Materials · doi:10.1021/acsanm.4c06580 · Cited by 5
Li, J., Zhu, W., Zheng, Q., Yi, H., Guo, L., Zhan, Z., Fu, N., Younis, M. R., Jin, C., Zhai, J., et al. (2025) · Materials Today Bio · doi:10.1016/j.mtbio.2025.102564 · Cited by 5
Fu, C., Cao, Y., Mei, Y., Xiao, Q., Hu, J., Gao, Z., Gao, X., Hou, Y., Zhang, F., Zhu, G., et al. (2026) · Advanced Functional Materials · doi:10.1002/adfm.202529034 · Cited by 6
Regulation of immune checkpoint molecules in cancer immune evasion and therapy
Eris, C., Zu, C., Xiao, Y., Platten, M., & Sun, C. (2026) · Nature reviews. Cancer · doi:10.1038/s41568-026-00934-y · Cited by 7
Bailey, C. M., Wei, Y., Yan, J., Huang, D. Y., Zhang, P., Qi, C., Lazarski, C. A., Su, J., Tang, F., Wong, C.-S., et al. (2023) · Cell Reports Medicine · doi:10.1016/j.xcrm.2023.101236 · Cited by 5
Self-citationXiong, B., Liu, W., Liu, Y., Chen, T., Lin, A., Song, J., Qu, L., Luo, P., Jiang, A., & Wang, L. (2024) · Biomedicines · doi:10.3390/biomedicines12102171 · Cited by 6
Self-citationXu, Y. K. T., Liao, J., Wang, J., Gao, Y., Wu, Y., Gao, M., Liu, W., Zhang, D., Zhang, W., & Huang, A. (2025) · Journal of Translational Medicine · doi:10.1186/s12967-025-06636-7 · Cited by 5
PD-L1 and HIF-2α Upregulation in Head and Neck Paragangliomas after Embolization
Fischer, A., Macciò, U., Wang, K., Friemel, J., Broglie, M. A., Vetter, D., Lehmann, K., Reul, A., Robledo, M., Hantel, C., et al. (2023) · Cancers · doi:10.3390/cancers15215199 · Cited by 5
Clinical investigation of hypoxia-inducible factors: getting there
Semenza, G. L. (2024) · Journal of Clinical Investigation · doi:10.1172/jci176253 · Cited by 5
Lu, Y., Li, G., Tang, S., Zhang, H., Liu, K., Wang, Z., Tan, G., & Jin, Y. (2025) · Chemical Engineering Journal · doi:10.1016/j.cej.2025.168574 · Cited by 4
Gao, M., Liu, Y., Wu, J., Zhang, P., Liu, J., Guo, K., Sun, B., Ling, S., & Wang, L. (2025) · Frontiers in Immunology · doi:10.3389/fimmu.2025.1669275 · Cited by 4
Self-citationHao, Y., Zhang, Y., Zhang, Y., Yang, D., Ren, D., Yue, Y., Li, Q., Fan, Q., Sun, C., Cui, M., et al. (2025) · European journal of medical research · doi:10.1186/s40001-025-03383-9 · Cited by 5
Huang, Q., Wang, F., Li, X., Zou, W., Huang, Z., Li, X., Yang, W., Lei, T., Yue, S., Wang, Q., et al. (2025) · Cancer Immunology Immunotherapy · doi:10.1007/s00262-025-04268-w · Cited by 4
Yu, X., He, Y., Zhong, J., Li, Y., Zhu, Y., Chen, Y., Yin, J., Yuan, Z., & Yin, P. (2026) · Materials Today Bio · doi:10.1016/j.mtbio.2026.102824 · Cited by 4
Gaggero, G., Pesaresi, A., Giunti, D., Bianconi, A., Truffelli, M., Grassi, M., Valle, L., Duzioni, S., Nozza, P., Dono, M., et al. (2025) · European Journal of Clinical Investigation · doi:10.1111/eci.70124 · Cited by 4
Tackling tumor hypoxia: advances in breaking the oncogenic HIF-1α–p300/CBP alliance
Kamel, E. M., Khadrawy, S. M., Allam, A. A., Ahmed, N., Alkhayl, F. F. A., & Lamsabhi, A. M. (2025) · Investigational New Drugs · doi:10.1007/s10637-025-01570-3 · Cited by 4
USP38: an important regulatory factor in tumor malignant progression
Li, J., Zhong, J., Ye, J., Xiang, Y., Yi, Q., Zhu, G., Deng, S., & Wang, X. (2025) · Frontiers in Immunology · doi:10.3389/fimmu.2025.1612723 · Cited by 3
Hot and Cold HCC: Uncoupling Viral Oncogenesis and Therapy
Sneller, L., Mathur, K., Kottilil, S., & Mathur, P. (2025) · Viruses · doi:10.3390/v17091255 · Cited by 3
Siddiqui, A., Dhandapani, H., Rather, A., Ingle, A., Sharma, D., & Tayalia, P. (2025) · Nanoscale · doi:10.1039/d5nr03762j · Cited by 4
Lu, I., Zhang, J., Chen, X., & Wang, X. (2026) · Molecular Carcinogenesis · doi:10.1002/mc.70128 · Cited by 3
Zhang, Y., Guo, D., Zhou, Y., Wang, C., Su, G., Huang, J., Wan, Y., Zhang, H., Wan, H., Bo, L., et al. (2026) · Biomarker Research · doi:10.1186/s40364-026-00948-6 · Cited by 4
Gao, K., Li, Y., Song, X., Ju, M., Liu, W. T., Xu, J., Jie, L., Zhang, H., Wei, Q., & Zhao, L. (2026) · Pharmacological Research · doi:10.1016/j.phrs.2026.108307 · Cited by 3
Hypoxia-induced PD-L1 expression and modulation of muscle stem cell allograft rejection
Raiten, J., Abd, G. M., Handelsman, S., Patel, H. V., Ku, J. C., Parsons, A. M., Wassink, J. L., Hayes, S. L., Overbay, J., & Li, Y. (2024) · Frontiers in Pharmacology · doi:10.3389/fphar.2024.1471563 · Cited by 3
Metadata
- Authors
- Bailey, C. M., Liu, Y., Liu, M., Du, X., Devenport, M., Zheng, P., Liu, Y., & Wang, Y.
- Affiliations
- University of Maryland, Baltimore (US)
- Corresponding author
- Liu, Yang
- Wang, Yin
- Venue
- Journal of Clinical Investigation
- Published
- 2022-05-02
- Volume
- 132
- Issue
- 9
- ISSN
- 0021-9738 (ISSN-L)
- 1558-8238
- PMC
- PMC9057613
- OpenAlex
- W4214881895
- Semantic Scholar
- 61d954ba1fe3c4cba513f816261e83f90b00fc87
- Cited by
- 151
- References
- 58
- Citations by year
- 2026: 34 · 2025: 45 · 2024: 38 · 2023: 24 · 2022: 10
- FWCI
- 12.35
- Type
- journal article
- Language
- en
- Open access
- gold
- doi.org
- Licence
- Locations
- Journal of Clinical Investigation (publishedVersion, cc-by)
- PubMed Central (publishedVersion, cc-by)
- PubMed (publishedVersion)
- DOAJ (DOAJ: Directory of Open Access Journals) (submittedVersion)
- Funders
- National Institutes of Health (CA171972, CA183030, CA219150, CA227671)
- Topics
- Health Sciences › Medicine › Oncology › Cancer Immunotherapy and Biomarkers
- Life Sciences › Immunology and Microbiology › Immunology › Immunotherapy and Immune Responses
- Life Sciences › Biochemistry, Genetics and Molecular Biology › Cancer Research › Cancer, Hypoxia, and Metabolism
- Keywords
- HIF-1α, PD-L1, immune evasion, tumor microenvironment, immune-related adverse events, CTLA-4, PD-1/PD-L1 immune checkpoint, echinomycin, interferon-gamma, tumor-infiltrating myeloid cells, tumor-infiltrating lymphocytes, cancer immunotherapy
- MeSH terms
- Animals, Echinomycin, Immune Tolerance, Neoplasms, Lymphocytes, Tumor-Infiltrating, Mice, Hypoxia-Inducible Factor 1, alpha Subunit, Immune Evasion, Tumor Microenvironment, B7-H1 Antigen
About these checks
Registry, retraction, Cites and statistics results are computed, not judged, with one exception: a printed reference that no index lists is read once by a model before it counts as a citation error. Claims are extracted by a model and kept only when their quote appears verbatim in the text; each cited source is then checked, with a model’s help, for whether it says what the claim relies on. Those verdicts can be wrong — read the claim’s quote and the cited source before relying on one.
A language model drew the claims from the paper on 2026-10-10, under version 3 of the claim definition (model deepseek-v4.1-flash, prompt extract-v3).
A second model labelled each claim on 2026-10-10 (model jev-1.13-20260917, definition revision gold-guideline-v0.2).
Statistics and arithmetic are recomputed, not judged.
Confidence bands are shown only for fields calibrated on our annotated test set. None is calibrated yet, so no band is shown.
What counts as a claim ›How we measure confidence ›How we check this ›
Are you an author, or do you see a problem with this page? Request a review
