

The DOI matches its Crossref record; 63 of the 63 references it cites were found in a registry or an index.
GenSLMs: Genome-scale language models reveal SARS-CoV-2 evolutionary dynamics
Open accessPublished version of a preprint
Abstract
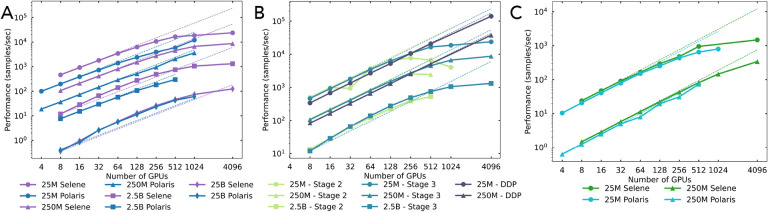
We seek to transform how new and emergent variants of pandemic-causing viruses, specifically SARS-CoV-2, are identified and classified. By adapting large language models (LLMs) for genomic data, we build genome-scale language models (GenSLMs) which can learn the evolutionary landscape of SARS-CoV-2 genomes. By pre-training on over 110 million prokaryotic gene sequences and fine-tuning a SARS-CoV-2-specific model on 1.5 million genomes, we show that GenSLMs can accurately and rapidly identify variants of concern. Thus, to our knowledge, GenSLMs represents one of the first whole-genome scale foundation models which can generalize to other prediction tasks. We demonstrate scaling of GenSLMs on GPU-based supercomputers and AI-hardware accelerators utilizing 1.63 Zettaflops in training runs with a sustained performance of 121 PFLOPS in mixed precision and peak of 850 PFLOPS. We present initial scientific insights from examining GenSLMs in tracking evolutionary dynamics of SARS-CoV-2, paving the path to realizing this on large biological data.
Overview
The claims and statistics of this paper haven’t been checked yet.
Run the check — free, no account needed. It reads the open-access text and checks the sources it cites.
Integrity signals
Registry
Cites
Statistics
Figures
Verification
Claims the paper makes
The claims and statistics of this paper haven’t been checked yet.
Run the check — free, no account needed. It reads the open-access text and checks the sources it cites.
Claims other papers make about this one
Each is checked against this paper’s own text: does it say what the citing paper says it does?
The source backs part of the claim, not all of it — or backs it for a different population, condition or comparison.
In the citing paper
“existing attempts to model DNA as a language (15–17) are limited by the prevailing dense Transformer architecture, which incurs high computational cost as input sequence lengths grow relative to model width (scaling quadratically) and generally underperforms at single-nucleotide or byte-level resolution compared with models trained at coarser resolutions (18).”
From Sequence modeling and design from molecular to genome scale with Evo (2024) · cites this paper as [15]
Experimental — accuracy not yet measuredThe source backs part of the claim, not all of it — or backs it for a different population, condition or comparison.
In the citing paper
“As a result, Transformer-based DNA models are constrained to short context lengths and use schemes that aggregate nucleotides into the basic units of language models, called tokens, thereby sacrificing single-nucleotide resolution (15, 16, 21–23).”
From Sequence modeling and design from molecular to genome scale with Evo (2024) · cites this paper as [15]
Experimental — accuracy not yet measuredThe cited source says what the claim attributes to it.
In the citing paper
“On DMS datasets of prokaryotic proteins, Evo’s zero-shot performance exceeded all other nucleotide models tested (Fig. 2B and table S4), including GenSLM (15)”
From Sequence modeling and design from molecular to genome scale with Evo (2024) · cites this paper as [15]
Self-check
Percentages, sums and reported differences re-computed from the paper’s own numbers.
The self-check needs the paper’s full text.
Citations
Cites
BERT: Pre-training of Deep Bidirectional Transformers for Language Understanding
Devlin, J., Chang, M.-W., Lee, K., & Toutanova, K. (2018) · arXiv · doi:10.48550/arxiv.1810.04805 · Cited by 73,173
Highly accurate protein structure prediction with AlphaFold
Jumper, J., Evans, R., Pritzel, A., Green, T., Figurnov, M., Ronneberger, O., Tunyasuvunakool, K., Bates, R., Žídek, A., Potapenko, A., et al. (2021) · Nature · doi:10.1038/s41586-021-03819-2 · Cited by 43,764
RAxML version 8: a tool for phylogenetic analysis and post-analysis of large phylogenies
Stamatakis, A. (2014) · Bioinformatics · doi:10.1093/bioinformatics/btu033 · Cited by 32,291
Advances in Neural Information Processing Systems 19
(2007) · The MIT Press eBooks · doi:10.52202/085713 · Cited by 16,043
Advances in Neural Information Processing Systems 29
Teymur, O., Zygalakis, K., & Calderhead, B. (2016) · Cited by 13,881
Needleman, S. B., & Wunsch, C. D. (1970) · Journal of Molecular Biology · doi:10.1016/0022-2836(70)90057-4 · Cited by 11,288
Scaling Laws for Neural Language Models
Kaplan, J., McCandlish, S., Henighan, T., Brown, T. B., Chess, B., Child, R., Gray, S., Radford, A., Wu, J., & Amodei, D. (2020) · arXiv · doi:10.48550/arxiv.2001.08361 · Cited by 9,550
Denoising Diffusion Probabilistic Models
Ho, J., Jain, A., & Abbeel, P. (2020) · arXiv · doi:10.48550/arxiv.2006.11239 · Cited by 8,712
Evolutionary-scale prediction of atomic level protein structure with a language model
Lin, Z., Akin, H., Rao, R., Hie, B., Zhu, Z., Lu, W., Smetanin, N., Verkuil, R., Kabeli, O., Shmueli, Y., et al. (2022) · doi:10.1101/2022.07.20.500902 · Cited by 5,990
Han (2023) · doi:10.1109/tpami.2022.3152247 · Cited by 4,682
Research works printed but not linked: 14
- Bradley T, 2012, Gpu Performance Analysis and Optimisation
- Deepspeed, 2022, Flops Profiler - Deepspeed
- Hall S, 2021, Training Giant Neural Networks Using Weight Streaming on Cerebras Wafer-Scale Systems
- Hugging face, 2022, Transformers: State-Of-The-Art Machine Learning For Pytorch, Tensorflow, And Jax
- Kenton JDMWC, 2019, Proceedings of NAACL-HLT, 4171
- Moritz P, Nishihara R, Wang S, et al. (2018) Ray: a distributed framework for emerging AI applications. In 13th USENIX Symposium on Operating Systems Design and Implementation (OSDI 18). Carlsbad, CA, 2018, pp. 561–577. https://www.usenix.org/conference/osdi18/presentation/moritz
- Nvidia, 2022, Automated Mixed Precision
- NVIDIA, 2022, Nvidia Nsight Systems
- Page AJ, 2016, Microbial Genomics, 5, 436
- Pytorch, 2022, Pytorch Lightning
- Radford A, 2018, Improving Language Understanding by Generative Pre-training
- Top500, 2022, June 2022 – Top500
- 10.1101/2022.08.08.22278553 · DOI
- Wang RE, Durmus E, Goodman N, et al. (2022) Language modeling via stochastic processes. In International Conference on Learning Representations. 2022
Cited by
Sorted by citations
Foundation models for generalist medical artificial intelligence
Moor, M., Banerjee, O., Abad, Z. S. H., Krumholz, H. M., Leskovec, J., Topol, E. J., & Rajpurkar, P. (2023) · Nature · doi:10.1038/s41586-023-05881-4 · Cited by 2,028
Nucleotide Transformer: building and evaluating robust foundation models for human genomics
Dalla-Torre, H., Gonzalez, L., Mendoza-Revilla, J., Lopez Carranza, N., Grzywaczewski, A. H., Oteri, F., Dallago, C., Trop, E., de Almeida, B. P., Sirelkhatim, H., et al. (2025) · Nature Methods · doi:10.1038/s41592-024-02523-z · Cited by 772
Self-citationSequence modeling and design from molecular to genome scale with Evo
Nguyen, E., Poli, M., Durrant, M. G., Kang, B., Katrekar, D., Li, D. B., Bartie, L. J., Thomas, A. W., King, S. H., Brixi, G., et al. (2024) · Science · doi:10.1126/science.ado9336 · Cited by 580
Opportunities and Challenges for Machine Learning-Assisted Enzyme Engineering
Yang, J., Li, F.-Z., & Arnold, F. H. (2024) · ACS Central Science · doi:10.1021/acscentsci.3c01275 · Cited by 268
Genome modeling and design across all domains of life with Evo 2Preprint
Brixi, G., Durrant, M. G., Ku, J., Poli, M., Brockman, G., Chang, D., Gonzalez, G. A., King, S. B., Li, D. B., Merchant, A. T., et al. (2025) · bioRxiv (Cold Spring Harbor Laboratory) · doi:10.1101/2025.02.18.638918 · Cited by 218
Metadata
- Authors
- Zvyagin, M., Brace, A., Hippe, K., Deng, Y., Zhang, B., Bohorquez, C. O., Clyde, A., Kale, B., Perez-Rivera, D., Ma, H., Mann, C. M., Irvin, M., Ozgulbas, D. G., Vassilieva, N., Pauloski, J. G., Ward, L., Hayot-Sasson, V., Emani, M., Foreman, S., Xie, Z., Lin, D., Shukla, M., Nie, W., Romero, J., Dallago, C., Vahdat, A., Xiao, C., Gibbs, T., Foster, I., Davis, J. J., Papka, M. E., Brettin, T., Stevens, R., Anandkumar, A., Vishwanath, V., & Ramanathan, A.
- Affiliations
- Argonne National Laboratory (US)
- Harvard University (US)
- Cerebras Systems (United States) (US)
- Northern Illinois University (US)
- Department of Biochemistry, University of Illinois-Urbana Champaign, Champaign, IL, USA
- University of Chicago (US)
- Data Science and Learning Division, Argonne National Laboratory, Lemont, IL, USA
- Nvidia (United States) (US)
- NVIDIA Inc., Santa Clara, CA, USA
- University of Illinois Urbana-Champaign (US)
- Corresponding author
- Vishwanath, Venkatram
- Ramanathan, Arvind
- ORCID
- Brace, Alexander
- Hippe, Kyle
- Deng, Yuntian
- Zhang, Bin
- Clyde, Austin
- Kale, Bharat
- Ma, Heng
- Mann, Carla M.
- Ozgulbas, Defne G.
- Vassilieva, Natalia
- Pauloski, James Gregory
- Ward, Logan
- Emani, Murali
- Foreman, Sam
- Lin, Diangen
- Shukla, Maulik
- Nie, Weili
- Dallago, Christian
- Vahdat, Arash
- Xiao, Chaowei
- Gibbs, Thomas
- Foster, Ian
- Davis, James J.
- Papka, Michael E.
- Brettin, Thomas
- Stevens, Rick
- Vishwanath, Venkatram
- Ramanathan, Arvind
- Venue
- The International Journal of High Performance Computing Applications
- Publisher
- SAGE Publications
- Published
- 2023-10-27
- Volume
- 37
- Issue
- 6
- Pages
- 683-705
- ISSN
- 0890-2720 (ISSN-L)
- 1094-3420
- 1741-2846
- PMC
- PMC9709791
- OpenAlex
- W4387994442
- Cited by
- 120
- References
- 57
- Citations by year
- 2026: 30 · 2025: 40 · 2024: 35 · 2023: 14
- FWCI
- 24.63
- Type
- journal article
- Language
- en
- Open access
- green
- doi.org
- Licence
- Locations
- The International Journal of High Performance Computing Applications (publishedVersion)
- bioRxiv (Cold Spring Harbor Laboratory) (acceptedVersion, cc-by-nc-nd)
- PubMed (publishedVersion)
- OSTI OAI (U.S. Department of Energy Office of Scientific and Technical Information) (submittedVersion)
- PubMed Central (submittedVersion, cc-by-nc-nd)
- Espace ÉTS (ETS) (submittedVersion)
- Funders
- Exascale Computing Project
- Topics
- Health Sciences › Medicine › Infectious Diseases › SARS-CoV-2 and COVID-19 Research
- Life Sciences › Biochemistry, Genetics and Molecular Biology › Molecular Biology › Genomics and Phylogenetic Studies
- Life Sciences › Biochemistry, Genetics and Molecular Biology › Molecular Biology › Machine Learning in Bioinformatics
- Keywords
- SARS-CoV-2, COVID-19 variants of concern, variant identification, viral evolution, foundation models, mixed-precision training
About these checks
Registry, retraction, Cites and statistics results are computed, not judged, with one exception: a printed reference that no index lists is read once by a model before it counts as a citation error. Claims are extracted by a model and kept only when their quote appears verbatim in the text; each cited source is then checked, with a model’s help, for whether it says what the claim relies on. Those verdicts can be wrong — read the claim’s quote and the cited source before relying on one.
Statistics and arithmetic are recomputed, not judged.
Confidence bands are shown only for fields calibrated on our annotated test set. None is calibrated yet, so no band is shown.
What counts as a claim ›How we measure confidence ›How we check this ›
Are you an author, or do you see a problem with this page? Request a review
