

The DOI matches its Crossref record; 37 of the 37 references it cites were found in a registry or an index.
TP53 copy number and protein expression inform mutation status across risk categories in acute myeloid leukemia
Open accessAbstract
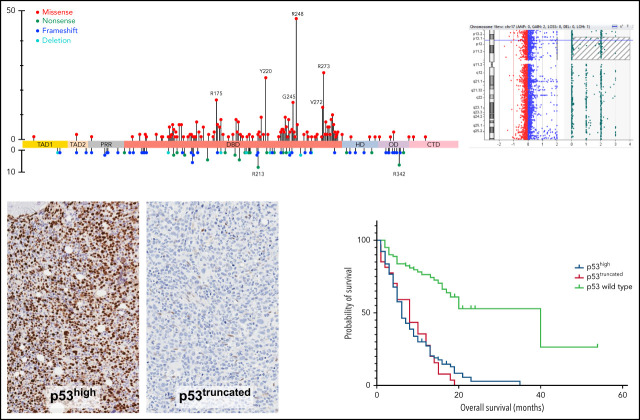
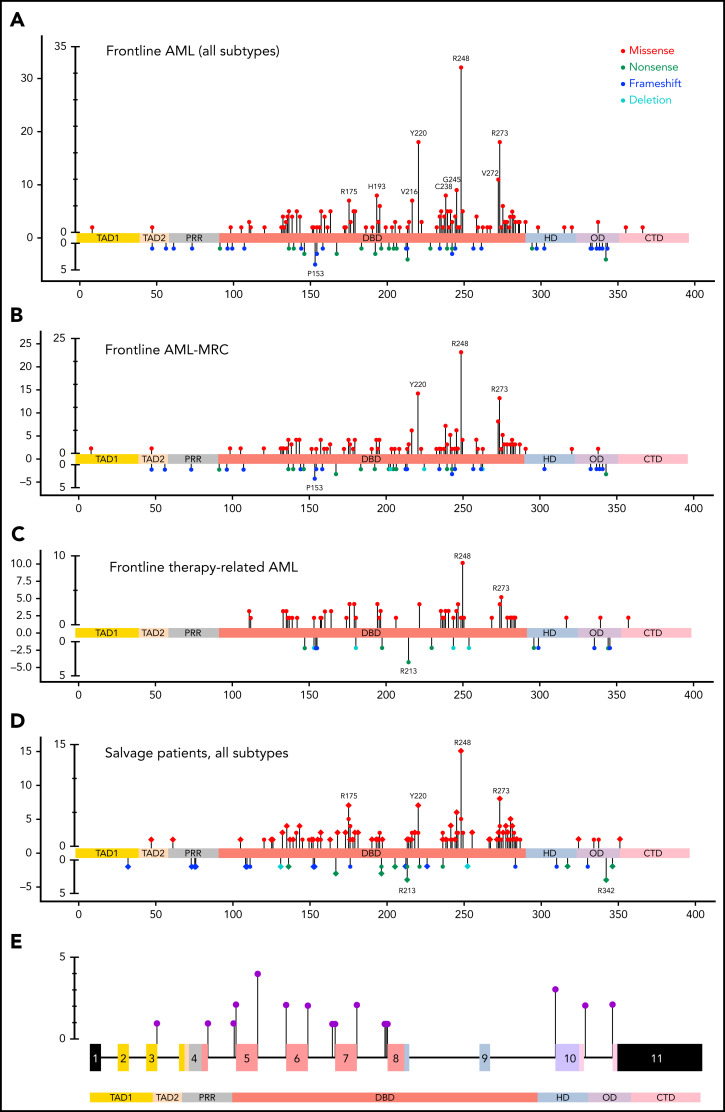
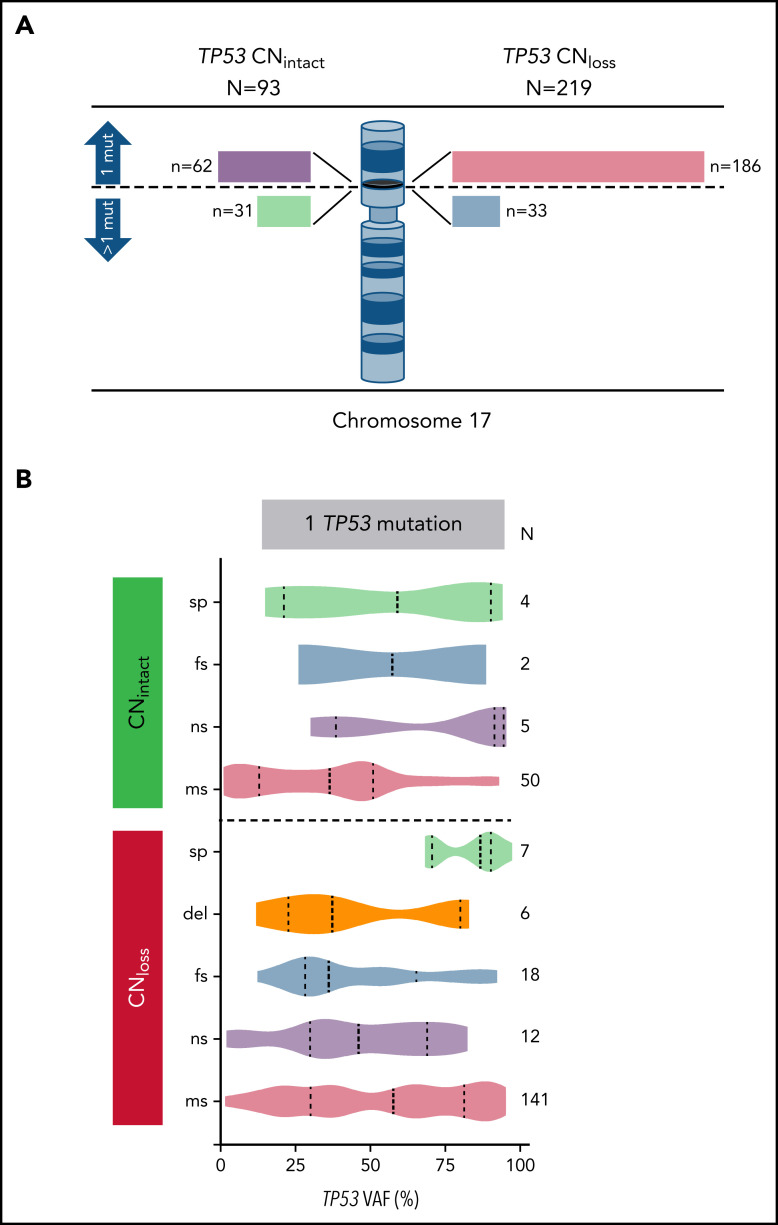
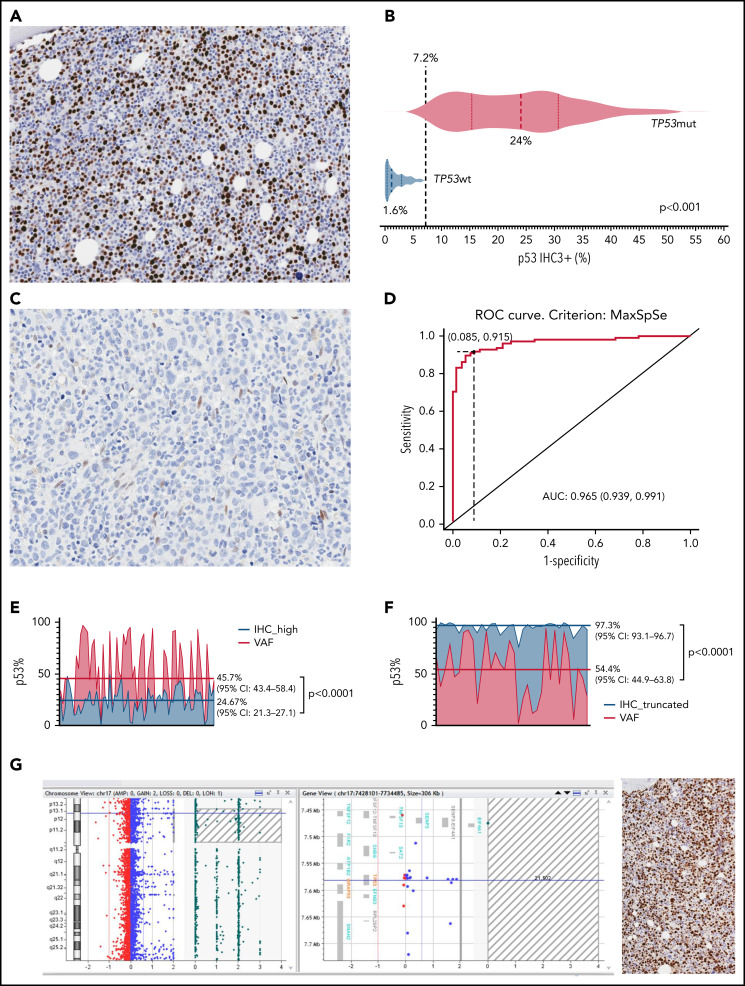
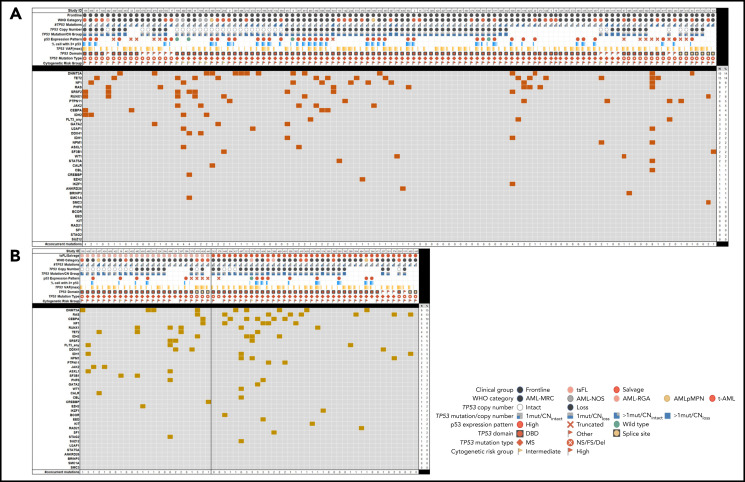
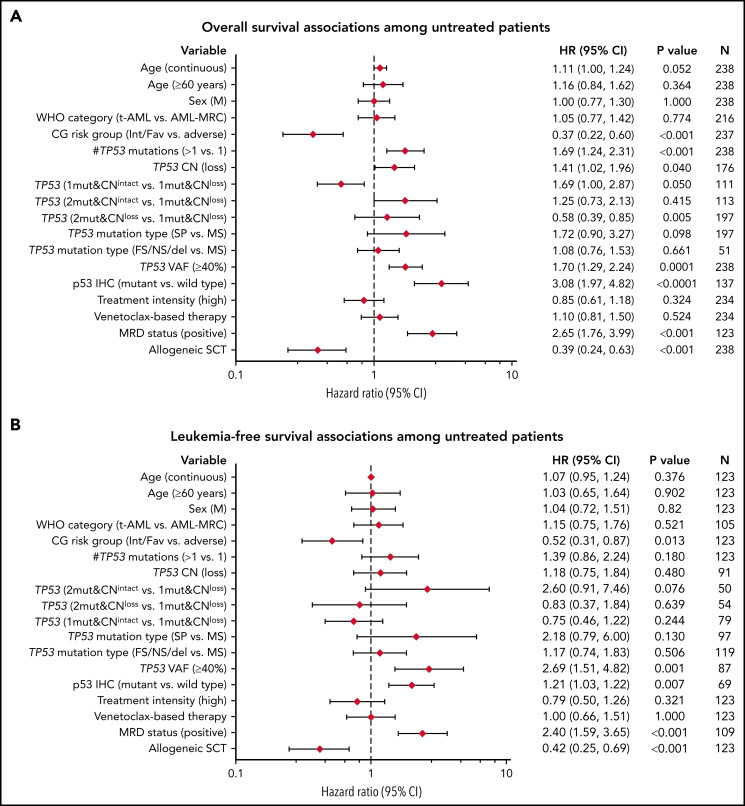
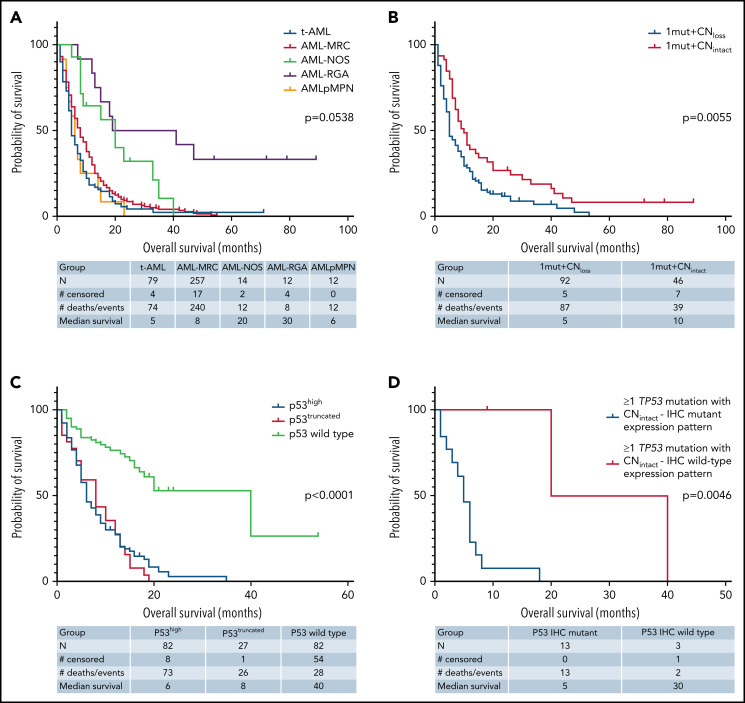
Mutant TP53 is an adverse risk factor in acute myeloid leukemia (AML), but large-scale integrated genomic-proteomic analyses of TP53 alterations in patients with AML remain limited. We analyzed TP53 mutational status, copy number (CN), and protein expression data in AML (N = 528) and provide a compilation of mutation sites and types across disease subgroups among treated and untreated patients. Our analysis shows differential hotspots in subsets of AML and uncovers novel pathogenic variants involving TP53 splice sites. In addition, we identified TP53 CN loss in 70.2% of TP53-mutated AML cases, which have more deleterious TP53 mutations, as well as copy neutral loss of heterozygosity in 5/32 (15.6%) AML patients who had intact TP53 CN. Importantly, we demonstrate that mutant p53 protein expression patterns by immunohistochemistry evaluated using digital image-assisted analysis provide a robust readout that integrates TP53 mutation and allelic states in patients with AML. Expression of p53 by immunohistochemistry informed mutation status irrespective of TP53 CN status. Genomic analysis of comutations in TP53-mutant AML shows a muted landscape encompassing primarily mutations in genes involved in epigenetic regulation (DNMT3A and TET2), RAS/MAPK signaling (NF1, KRAS/NRAS, PTPN11), and RNA splicing (SRSF2). In summary, our data provide a rationale to refine risk stratification of patients with AML on the basis of integrated molecular and protein-level TP53 analyses.
Overview
The claims and statistics of this paper haven’t been checked yet.
Run the check — free, no account needed. It reads the open-access text and checks the sources it cites.
Integrity signals
Registry
Cites
Statistics
Figures
Verification
Claims the paper makes
The claims and statistics of this paper haven’t been checked yet.
Run the check — free, no account needed. It reads the open-access text and checks the sources it cites.
Claims other papers make about this one
Each is checked against this paper’s own text: does it say what the citing paper says it does?
The source backs part of the claim, not all of it — or backs it for a different population, condition or comparison.
In the citing paper
“there is a very strong interplay between VAF, allelic state, and cytogenetic complexity strongly predicting outcomes in this molecular subset”
From Long‐term follow‐up and combined Phase 2 results of eprenetapopt and azacitidine in patients with TP53 mutant MDS/AML (2025) · cites this paper as [10]
Experimental — accuracy not yet measuredThe source backs part of the claim, not all of it — or backs it for a different population, condition or comparison.
In the citing paper
“with a recent study identifying 92% of TP53 mutant MDS/AML patients to represent a poor risk population.”
From Long‐term follow‐up and combined Phase 2 results of eprenetapopt and azacitidine in patients with TP53 mutant MDS/AML (2025) · cites this paper as [10]
Experimental — accuracy not yet measured
Self-check
Percentages, sums and reported differences re-computed from the paper’s own numbers.
The self-check needs the paper’s full text.
Citations
Cites
Döhner, H., Estey, E. H., Grimwade, D. J., Amadori, S., Appelbaum, F. R., Büchner, T., Dombret, H., Ebert, B. L., Fenaux, P., Larson, R. A., et al. (2016) · Blood · doi:10.1182/blood-2016-08-733196 · Cited by 5,938
Genomic classification and prognosis in acute myeloid leukemia
Papaemmanuil, E., Gerstung, M., Bullinger, L., Gaidzik, V. I., Paschka, P., Roberts, N. D., Potter, N. E., Heuser, M., Thol, F., Bolli, N., et al. (2016) · New England Journal of Medicine · doi:10.1056/nejmoa1516192 · Cited by 4,350
Kastenhuber, E. R., & Lowe, S. W. (2017) · Cell · doi:10.1016/j.cell.2017.08.028 · Cited by 1,906
p53: 800 million years of evolution and 40 years of discovery
Levine, A. J. (2020) · Nature reviews. Cancer · doi:10.1038/s41568-020-0262-1 · Cited by 876
Prognostic Mutations in Myelodysplastic Syndrome after Stem-Cell Transplantation
Lindsley, R. C., Saber, W., Mar, B. G., Redd, R., Wang, T., Haagenson, M. D., Grauman, P. V., Hu, Z.-H., Spellman, S. R., Lee, S. J., et al. (2017) · New England Journal of Medicine · doi:10.1056/nejmoa1611604 · Cited by 776
Bouaoun, L., Sonkin, D., Ardin, M., Hollstein, M., Byrnes, G., Zavadil, J., & Olivier, M. (2016) · Human Mutation · doi:10.1002/humu.23035 · Cited by 730
Rücker, F. G., Schlenk, R. F., Bullinger, L., Käyser, S., Teleanu, V., Kett, H., Habdank, M., Kugler, C.-M., Holzmann, K., Gaidzik, V. I., et al. (2011) · Blood · doi:10.1182/blood-2011-08-375758 · Cited by 694
Bernard, E., Nannya, Y., Hasserjian, R. P., Devlin, S. M., Tuechler, H., Medina-Martinez, J. S., Yoshizato, T., Shiozawa, Y., Saiki, R., Malcovati, L., et al. (2020) · Nature Medicine · doi:10.1038/s41591-020-1008-z · Cited by 648
Eprenetapopt (APR-246) and Azacitidine in TP53 -Mutant Myelodysplastic Syndromes
Sallman, D. A., DeZern, A. E., Garcia-Manero, G., Steensma, D. P., Roboz, G. J., Sekeres, M. A., Cluzeau, T., Sweet, K. L., McLemore, A., McGraw, K. L., et al. (2021) · Journal of Clinical Oncology · doi:10.1200/jco.20.02341 · Cited by 465
Self-citationA dominant-negative effect drives selection of TP53 missense mutations in myeloid malignancies
Boettcher, S., Miller, P. G., Sharma, R., McConkey, M., Leventhal, M., Krivtsov, A. V., Giacomelli, A. O., Wong, W., Kim, J., Chao, S., et al. (2019) · Science · doi:10.1126/science.aax3649 · Cited by 441
Kim, M. P., & Lozano, G. (2017) · Cell Death and Differentiation · doi:10.1038/cdd.2017.185 · Cited by 313
Kotler, E., Shani, O., Goldfeld, G., Lotan‐Pompan, M., Tarcic, O., Gershoni, A., Hopf, T. A., Marks, D. S., Oren, M., & Segal, E. (2018) · Molecular Cell · doi:10.1016/j.molcel.2018.06.012 · Cited by 292
Deletions linked to TP53 loss drive cancer through p53-independent mechanisms
Liu, Y., Chen, C., Xu, Z., Scuoppo, C., Rillahan, C. D., Gao, J., Spitzer, B. G., Bosbach, B., Kastenhuber, E. R., Baslan, T., et al. (2016) · Nature · doi:10.1038/nature17157 · Cited by 279
Haferlach, C., Dicker, F., Herholz, H., Schnittger, S., Kern, W., & Haferlach, T. (2008) · Leukemia · doi:10.1038/leu.2008.143 · Cited by 247
Bowen, D., Groves, M. J., Burnett, A. K., Patel, Y., Allen, C. G., Green, C. L., Gale, R. E., Hills, R. K., & Linch, D. C. (2008) · Leukemia · doi:10.1038/leu.2008.173 · Cited by 214
Short, N. J., Bravo, G. M., Hwang, H., Ning, J., Franquiz, M. J., Kanagal‐Shamanna, R., Patel, K. P., Dinardo, C. D., Ravandi, F., Garcia‐Manero, G., et al. (2020) · Blood Advances · doi:10.1182/bloodadvances.2020003120 · Cited by 188
Self-citationNeskey, D. M., Osman, A. A., Ow, T. J., Katsonis, P., McDonald, T. O., Hicks, S. C., Hsu, T., Pickering, C. R., Ward, A. M., Patel, A. A., et al. (2015) · Cancer Research · doi:10.1158/0008-5472.can-14-2735 · Cited by 164
Understanding p53 functions through p53 antibodies
Sabapathy, K., & Lane, D. P. (2019) · Journal of Molecular Cell Biology · doi:10.1093/jmcb/mjz010 · Cited by 139
Maslah, N., Salomao, N., Drevon, L., Verger, E., Partouche, N., Ly, P., Aubin, P., Naoui, N., Schlageter, M.-H., Bally, C., et al. (2020) · Haematologica · doi:10.3324/haematol.2019.218453 · Cited by 132
Prognostic significance of TP53 gene mutation in 995 cases of colorectal carcinoma
Soong, R., Powell, B., Elsaleh, H., Gnanasampanthan, G., Smith, D. R., Goh, H. S., Joseph, D. J., & Iacopetta, B. M. (2000) · European Journal of Cancer · doi:10.1016/s0959-8049(00)00285-9 · Cited by 122
Acute Myeloid Leukemia: The Good, the Bad, and the Ugly
Kuykendall, A. T., Duployez, N., Boissel, N., Lancet, J. E., & Welch, J. S. (2018) · American Society of Clinical Oncology Educational Book · doi:10.1200/edbk_199519 · Cited by 115
Treated secondary acute myeloid leukemia: a distinct high-risk subset of AML with adverse prognosis
Boddu, P., Kantarjian, H. M., Garcia-Manero, G., Ravandi, F., Verstovsek, S., Jabbour, E., Borthakur, G., Konopleva, M., Bhalla, K. N., Daver, N., et al. (2017) · Blood Advances · doi:10.1182/bloodadvances.2017008227 · Cited by 112
Self-citationKhoury, J. D., Wang, W., Prieto, V. G., Medeiros, L. J., Kalhor, N., Hameed, M., Broaddus, R. R., & Hamilton, S. R. (2017) · Clinical Cancer Research · doi:10.1158/1078-0432.ccr-17-1597 · Cited by 94
Self-citationShirole, N. H., Pal, D., Kastenhuber, E. R., Şentürk, Ş., Boroda, J. U., Pisterzi, P., Miller, M., Munoz, G., Anderluh, M., Ladanyi, M., et al. (2016) · eLife · doi:10.7554/elife.17929 · Cited by 80
Ali, D., Jönsson‐Videsäter, K., Deneberg, S., Bengtzén, S., Nahi, H., Paul, C., & Lehmann, S. (2010) · European Journal Of Haematology · doi:10.1111/j.1600-0609.2010.01557.x · Cited by 70
McGraw, K. L., Nguyen, J., Komrokji, R. S., Sallman, D. A., Ali, N. H. A., Padron, E., Lancet, J. E., Moscinski, L. C., List, A. F., & Zhang, L. (2016) · Haematologica · doi:10.3324/haematol.2016.143214 · Cited by 68
Structural Evolution and Dynamics of the p53 ProteinsPreprint
Chillemi, G., Kehrloesser, S., Bernassola, F., Desideri, A., Dötsch, V., Levine, A. J., & Melino, G. (2016) · Cold Spring Harbor Perspectives in Medicine · doi:10.1101/cshperspect.a028308 · Cited by 64
Fernandez‐Pol, S., Ma, L., Ohgami, R. S., & Arber, D. A. (2016) · Modern Pathology · doi:10.1038/modpathol.2016.206 · Cited by 63
Loghavi, S., Al‐Ibraheemi, A., Zuo, Z., Garcia‐Manero, G., Yabe, M., Wang, S. A., Kantarjian, H. M., Yin, C. C., Miranda, R. N., Luthra, R., et al. (2015) · British Journal of Haematology · doi:10.1111/bjh.13529 · Cited by 52
Self-citationCleven, A. H. G., Nardi, V., Ok, C. Y., Goswami, M., Cin, P. D., Zheng, Z., Iafrate, A. J., Hamid, M. A. A., Wang, S. A., & Hasserjian, R. P. (2014) · Modern Pathology · doi:10.1038/modpathol.2014.153 · Cited by 50
Intratumour heterogeneity of p53 expression; causes and consequences
Xue, Y., Luis, B. S., & Lane, D. P. (2019) · The Journal of Pathology · doi:10.1002/path.5328 · Cited by 44
Ruzinova, M. B., Lee, Y.-S., Duncavage, E. J., & Welch, J. S. (2019) · Haematologica · doi:10.3324/haematol.2018.205302 · Cited by 34
p53 mutation in the myelodysplastic syndromes
Adamson, D. J. A., Dawson, A. A., Bennett, B., King, D. J., & Kingsbury, N. (1995) · British Journal of Haematology · doi:10.1111/j.1365-2141.1995.tb08910.x · Cited by 33
Sallman, D. A., Kerre, T. C. C., Poiré, X., Havelange, V., Lewalle, P., Davila, M. L., Wang, E. S., Dekker, D., Snykers, S., Sotiropoulou, P. A., et al. (2018) · Blood · doi:10.1182/blood-2018-99-111326 · Cited by 26
Assi, R. E., Gur, H. D., Loghavi, S., Konoplev, S. N., Konopleva, M. Y., Daver, N. G., Tashakori, M., Kadia, T. M., Routbort, M. J., Salem, A., et al. (2018) · American Journal of Hematology · doi:10.1002/ajh.25255 · Cited by 19
Self-citationCorrigendum to ‘Understanding p53 functions through p53 antibodies’
Sabapathy, K., & Lane, D. P. (2019) · Journal of Molecular Cell Biology · doi:10.1093/jmcb/mjz110 · Cited by 10
The Problem of TP53-Mutant MDS/AML
Sallman, D. A. (2020) · Clinical Lymphoma Myeloma & Leukemia · doi:10.1016/s2152-2650(20)30465-1 · Cited by 4
Cited by
Sorted by citations
Khoury, J. D., Solary, E., Abla, O., Akkari, Y., Alaggio, R., Apperley, J. F., Bejar, R., Berti, E., Busque, L., Chan, J. K. C., et al. (2022) · Leukemia · doi:10.1038/s41375-022-01613-1 · Cited by 4,274
Self-citationRecent advances in targeted therapies in acute myeloid leukemia
Bhansali, R. S., Pratz, K. W., & Lai, C. (2023) · Journal of Hematology & Oncology · doi:10.1186/s13045-023-01424-6 · Cited by 297
Genomic profiling for clinical decision making in myeloid neoplasms and acute leukemia
Duncavage, E. J., Bagg, A., Hasserjian, R. P., Dinardo, C. D., Godley, L. A., Iacobucci, I., Jaiswal, S., Malcovati, L., Vannucchi, A. M., Patel, K. P., et al. (2022) · Blood · doi:10.1182/blood.2022015853 · Cited by 235
Self-citationDaver, N. G., Maiti, A., Kadia, T. M., Vyas, P., Majeti, R., Wei, A. H., Garcia‐Manero, G., Craddock, C., Sallman, D. A., & Kantarjian, H. M. (2022) · Cancer Discovery · doi:10.1158/2159-8290.cd-22-0332 · Cited by 184
Self-citationPathophysiology of Acute Myeloid Leukemia
Wachter, F., & Pikman, Y. (2024) · Acta Haematologica · doi:10.1159/000536152 · Cited by 140
Metadata
- Authors
- Tashakori, M., Kadia, T., Loghavi, S., Daver, N., Kanagal-Shamanna, R., Pierce, S., Sui, D., Wei, P., Khodakarami, F., Tang, Z., Routbort, M., Bivins, C. A., Jabbour, E. J., Medeiros, L. J., Bhalla, K., Kantarjian, H. M., Ravandi, F., & Khoury, J. D.
- Affiliations
- University of Minnesota (US)
- 3Department of Leukemia, and
- The University of Texas MD Anderson Cancer Center (US)
- 1Department of Hematopathology, The University of Texas MD Anderson Cancer Center, Houston, TX;
- 5Cyclica Inc, Toronto, ON, Canada
- Corresponding author
- Khoury, Joseph D.
- ORCID
- Venue
- Blood
- Publisher
- American Society of Hematology
- Published
- 2022-07-07
- Volume
- 140
- Issue
- 1
- Pages
- 58-72
- ISSN
- 0006-4971 (ISSN-L)
- 1528-0020
- PMC
- PMC9346958
- OpenAlex
- W4226526247
- Cited by
- 111
- References
- 36
- Citations by year
- 2026: 17 · 2025: 24 · 2024: 31 · 2023: 27 · 2022: 12
- FWCI
- 17.28
- Type
- journal article
- Language
- en
- Open access
- hybrid
- doi.org
- Licence
- Locations
- Blood (publishedVersion, cc-by-nc-nd)
- PubMed Central (publishedVersion, cc-by-nc-nd)
- PubMed (publishedVersion)
- Digital Commons-TMC (Texas Medical Center) (submittedVersion)
- Topics
- Health Sciences › Medicine › Hematology › Acute Myeloid Leukemia Research
- Life Sciences › Biochemistry, Genetics and Molecular Biology › Cancer Research › Cancer Genomics and Diagnostics
- Health Sciences › Medicine › Oncology › Cancer-related Molecular Pathways
- Keywords
- acute myeloid leukemia, TP53 mutation, p53 expression, immunohistochemistry, copy-neutral loss of heterozygosity, co-occurring mutations, DNMT3A, TET2, RAS/MAPK pathway, SRSF2, risk stratification
- MeSH terms
- Humans, Mutation, Prognosis, Leukemia, Myeloid, Acute, Tumor Suppressor Protein p53, Proteomics, Epigenesis, Genetic, DNA Copy Number Variations
About these checks
Registry, retraction, Cites and statistics results are computed, not judged, with one exception: a printed reference that no index lists is read once by a model before it counts as a citation error. Claims are extracted by a model and kept only when their quote appears verbatim in the text; each cited source is then checked, with a model’s help, for whether it says what the claim relies on. Those verdicts can be wrong — read the claim’s quote and the cited source before relying on one.
Statistics and arithmetic are recomputed, not judged.
Confidence bands are shown only for fields calibrated on our annotated test set. None is calibrated yet, so no band is shown.
What counts as a claim ›How we measure confidence ›How we check this ›
Are you an author, or do you see a problem with this page? Request a review
