

The DOI matches its Crossref record; 22 of the 22 references it cites were found in a registry or an index.
Optimizing de novo transcriptome assembly from short-read RNA-Seq data: a comparative study
Open accessAbstract
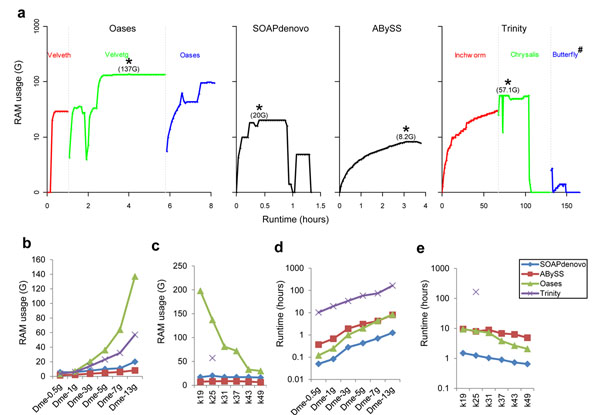
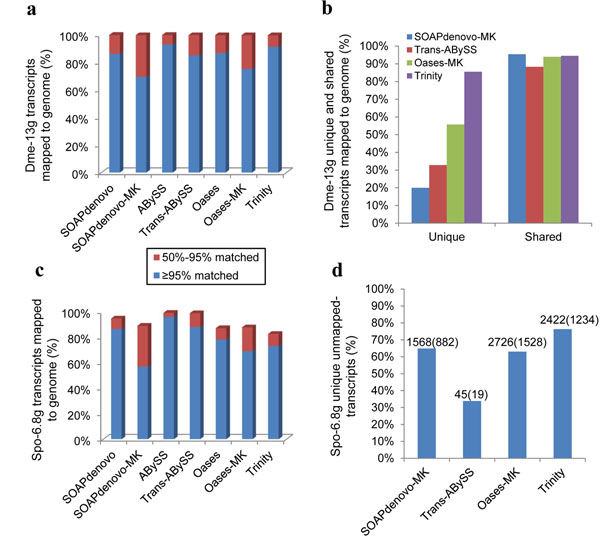
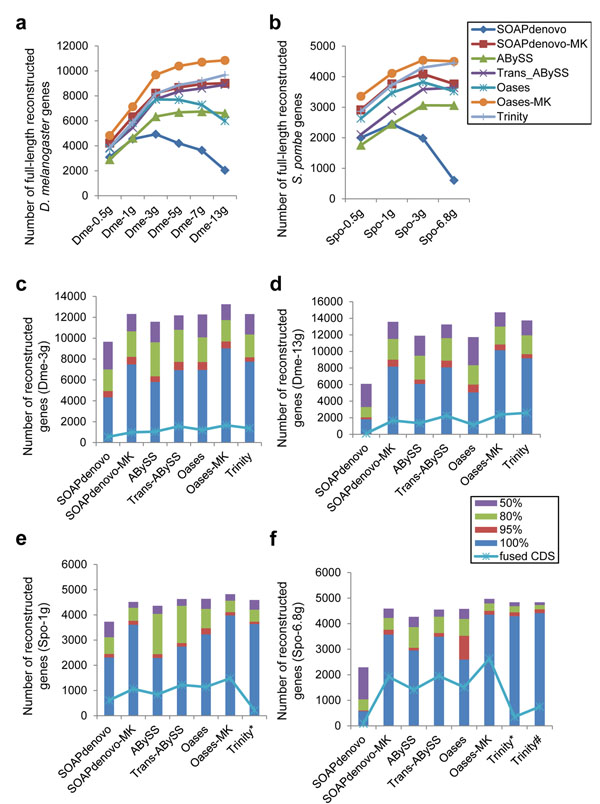
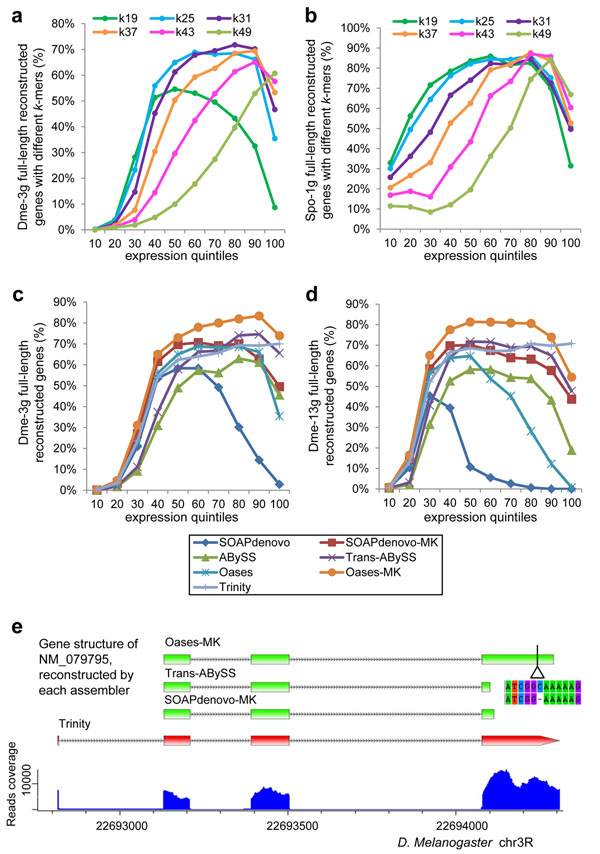
Background: With the fast advances in nextgen sequencing technology, high-throughput RNA sequencing has emerged as a powerful and cost-effective way for transcriptome study. De novo assembly of transcripts provides an important solution to transcriptome analysis for organisms with no reference genome. However, there lacked understanding on how the different variables affected assembly outcomes, and there was no consensus on how to approach an optimal solution by selecting software tool and suitable strategy based on the properties of RNA-Seq data. Results: To reveal the performance of different programs for transcriptome assembly, this work analyzed some important factors, including k-mer values, genome complexity, coverage depth, directional reads, etc. Seven program conditions, four single k-mer assemblers (SK: SOAPdenovo, ABySS, Oases and Trinity) and three multiple k-mer methods (MK: SOAPdenovo-MK, trans-ABySS and Oases-MK) were tested. While small and large k-mer values performed better for reconstructing lowly and highly expressed transcripts, respectively, MK strategy worked well for almost all ranges of expression quintiles. Among SK tools, Trinity performed well across various conditions but took the longest running time. Oases consumed the most memory whereas SOAPdenovo required the shortest runtime but worked poorly to reconstruct full-length CDS. ABySS showed some good balance between resource usage and quality of assemblies. Conclusions: Our work compared the performance of publicly available transcriptome assemblers, and analyzed important factors affecting de novo assembly. Some practical guidelines for transcript reconstruction from short-read RNA-Seq data were proposed. De novo assembly of C. sinensis transcriptome was greatly improved using some optimized methods.
Overview
The claims and statistics of this paper haven’t been checked yet.
Free: it reads the open-access text and checks the first 5 claims that cite a source we can check. Create a free account to check every claim.
Integrity signals
Registry
Cites
Statistics
Figures
Verification
Claims the paper makes
The claims and statistics of this paper haven’t been checked yet.
Free: it reads the open-access text and checks the first 5 claims that cite a source we can check. Create a free account to check every claim.
Claims other papers make about this one
Each is checked against this paper’s own text: does it say what the citing paper says it does?
The cited source says what the claim attributes to it.
In the citing paper
“However, in order to achieve a better assembly, multiple k-mer approach should be considered [60].”
From Digital Gene Expression Analysis Based on Integrated De Novo Transcriptome Assembly of Sweet Potato [Ipomoea batatas (L.) Lam.] (2012) · cites this paper as [60]
The cited source says what the claim attributes to it.
In the citing paper
“Zhao et al. compared several de novo transcriptome assemblers and different assembly strategies, and found that Trinity was the best single k-mer assembler for transcriptome assembly [60].”
From Digital Gene Expression Analysis Based on Integrated De Novo Transcriptome Assembly of Sweet Potato [Ipomoea batatas (L.) Lam.] (2012) · cites this paper as [60]
Self-check
Percentages, sums and reported differences re-computed from the paper’s own numbers.
The self-check needs the paper’s full text.
Citations
Cites
Ultrafast and memory-efficient alignment of short DNA sequences to the human genome.
Langmead, B., Trapnell, C., Pop, M., & Salzberg, S. L. (2009) · Genome Biology · doi:10.1186/gb-2009-10-3-r25 · Cited by 21,849
Full-length transcriptome assembly from RNA-Seq data without a reference genome
Grabherr, M. G., Haas, B. J., Yassour, M., Levin, J. Z., Thompson, D. A., Amit, I., Adiconis, X., Fan, L., Raychowdhury, R., Zeng, Q., et al. (2011) · Nature Biotechnology · doi:10.1038/nbt.1883 · Cited by 21,039
TopHat: discovering splice junctions with RNA-Seq
Trapnell, C., Pachter, L., & Salzberg, S. L. (2009) · Bioinformatics · doi:10.1093/bioinformatics/btp120 · Cited by 11,617
Velvet: Algorithms for de novo short read assembly using de Bruijn graphs
Zerbino, D. R., & Birney, E. (2008) · Genome Research · doi:10.1101/gr.074492.107 · Cited by 9,491
<tt>BLAT</tt> —The <tt>BLAST</tt> -Like Alignment Tool
Kent, W. J. (2002) · Genome Research · doi:10.1101/gr.229202 · Cited by 8,480
The KEGG resource for deciphering the genome
Kanehisa, M. (2004) · Nucleic Acids Research · doi:10.1093/nar/gkh063 · Cited by 5,104
SOAP2: an improved ultrafast tool for short read alignment
Li, R., Yu, C., Li, Y., Lam, T.-W., Yiu, S.-M., Kristiansen, K., & Wang, J. (2009) · Bioinformatics · doi:10.1093/bioinformatics/btp336 · Cited by 3,760
Transcriptomic Analysis of Autistic Brain Reveals Convergent Molecular Pathology
Voineagu, I., Wang, X., Johnston, P., Lowe, J. K., Tian, Y., Horvath, S., Mill, J., Cantor, R. M., Blencowe, B. J., & Geschwind, D. H. (2011) · Nature · doi:10.1038/nature10110 · Cited by 1,874 · cited 1×
“RNA-Seq has been widely applied to both well-studied model organisms and nonmodel organisms, to provide information on transcript profile of organisms, and to give important insights into biological processes [1-5].”
BackgroundThe developmental transcriptome of Drosophila melanogaster
Graveley, B. R., Brooks, A. N., Carlson, J. W., Duff, M. O., Landolin, J. M., Yang, L., Artieri, C. G., van Baren, M. J., Boley, N., Booth, B. W., et al. (2011) · Nature · doi:10.1038/nature09715 · Cited by 1,484
The Universal Protein Resource (UniProt): an expanding universe of protein information
Wu, C. H. (2006) · Nucleic Acids Research · doi:10.1093/nar/gkj161 · Cited by 1,110
Cited by
StringTie enables improved reconstruction of a transcriptome from RNA-seq reads
Pertea, M., Pertea, G. M., Antonescu, C. M., Chang, T.-C., Mendell, J. T., & Salzberg, S. L. (2015) · Nature Biotechnology · doi:10.1038/nbt.3122 · Cited by 14,298
Personalized RNA mutanome vaccines mobilize poly-specific therapeutic immunity against cancer
Sahin, U., Derhovanessian, E., Miller, M., Kloke, B.-P., Simon, P., Löwer, M., Bukur, V., Tadmor, A. D., Luxemburger, U., Schrörs, B., et al. (2017) · Nature · doi:10.1038/nature23003 · Cited by 2,488
De novo assembly of bacterial transcriptomes from RNA-seq data
Tjaden, B. (2015) · Genome Biology · doi:10.1186/s13059-014-0572-2 · Cited by 1,717
Corset: enabling differential gene expression analysis for de novoassembled transcriptomes
Davidson, N. M., & Oshlack, A. (2014) · Genome Biology · doi:10.1186/s13059-014-0410-6 · Cited by 673
Nagarajan, N., & Pop, M. (2013) · Nature Reviews Genetics · doi:10.1038/nrg3367 · Cited by 474
Metadata
- Authors
- Zhao, Q.-Y., Wang, Y., Kong, Y.-M., Luo, D., Li, X., & Hao, P.
- Affiliations
- East China Normal University (CN)
- Sun Yat-sen University (CN)
- Chinese Academy of Sciences (CN)
- Shanghai Center For Bioinformation Technology (CN)
- Corresponding author
- Li, Xuan
- Hao, Pei
- Venue
- BMC Bioinformatics
- Published
- 2011-12
- Volume
- 12
- Issue
- S14
- Pages
- S2-S2
- ISSN
- 1471-2105 (ISSN-L)
- PMC
- PMC3287467
- OpenAlex
- W2127963635
- Cited by
- 479
- References
- 22
- Citations by year
- 2026: 2 · 2025: 6 · 2024: 8 · 2023: 13 · 2022: 18 · 2021: 39 · 2020: 48 · 2019: 120 · 2018: 38 · 2017: 26 · 2016: 31 · 2015: 45 · 2014: 34 · 2013: 35 · 2012: 14
- FWCI
- 10.71
- Type
- journal article
- Language
- en
- Open access
- gold
- doi.org
- Licence
- cc-by
- Locations
- BMC Bioinformatics (publishedVersion, cc-by)
- PubMed Central (publishedVersion, cc-by)
- PubMed (publishedVersion)
- Funders
- National Key Research and Development Program of China (2012CB316501)
- Topics
- Life Sciences › Biochemistry, Genetics and Molecular Biology › Molecular Biology › Genomics and Phylogenetic Studies
- Life Sciences › Biochemistry, Genetics and Molecular Biology › Molecular Biology › Single-cell and spatial transcriptomics
- Life Sciences › Biochemistry, Genetics and Molecular Biology › Molecular Biology › RNA and protein synthesis mechanisms
- Keywords
- de novo transcriptome assembly, RNA-seq, assembler comparison, k-mer size, sequencing depth, genome complexity
- MeSH terms
- Humans, Software, Sequence Analysis, RNA, Gene Expression Profiling, Camellia sinensis, High-Throughput Nucleotide Sequencing, Transcriptome
About these checks
Registry, retraction, Cites and statistics results are computed, not judged, with one exception: a printed reference that no index lists is read once by a model before it counts as a citation error. Claims are extracted by a model and kept only when their quote appears verbatim in the text; each cited source is then checked, with a model’s help, for whether it says what the claim relies on. Those verdicts can be wrong — read the claim’s quote and the cited source before relying on one.
Statistics and arithmetic are recomputed, not judged.
Confidence bands are shown only for fields calibrated on our annotated test set. None is calibrated yet, so no band is shown.
What counts as a claim ›How we measure confidence ›How we check this ›
Are you an author, or do you see a problem with this page? Request a review
How to cite
Cite CoChat for the checks on this page, and the paper for its own findings.
- This page
- CoChat. (2026). Citation check: Optimizing de novo transcriptome assembly from short-read RNA-Seq data: a comparative study. https://app.cochat.ai/papers/10.1186/1471-2105-12-s14-s2
- The paper
- Zhao, Q.-Y., Wang, Y., Kong, Y.-M., Luo, D., Li, X., & Hao, P. (2011). Optimizing de novo transcriptome assembly from short-read RNA-Seq data: a comparative study. BMC Bioinformatics. https://doi.org/10.1186/1471-2105-12-s14-s2
Data sources
Bibliographic data: Semantic Scholar, OpenAlex, Crossref.
Contains information from the Semantic Scholar Academic Graph Datasets, made available under the ODC Attribution License (ODC-BY 1.0).
Semantic Scholar’s data is described in: Kinney, R., et al. (2023). The Semantic Scholar Open Data Platform. arXiv:2301.10140.
