

The DOI matches its Crossref record; 34 of the 34 references it cites were found in a registry or an index.
A comparison of methods for differential expression analysis of RNA-seq data
Open accessAbstract
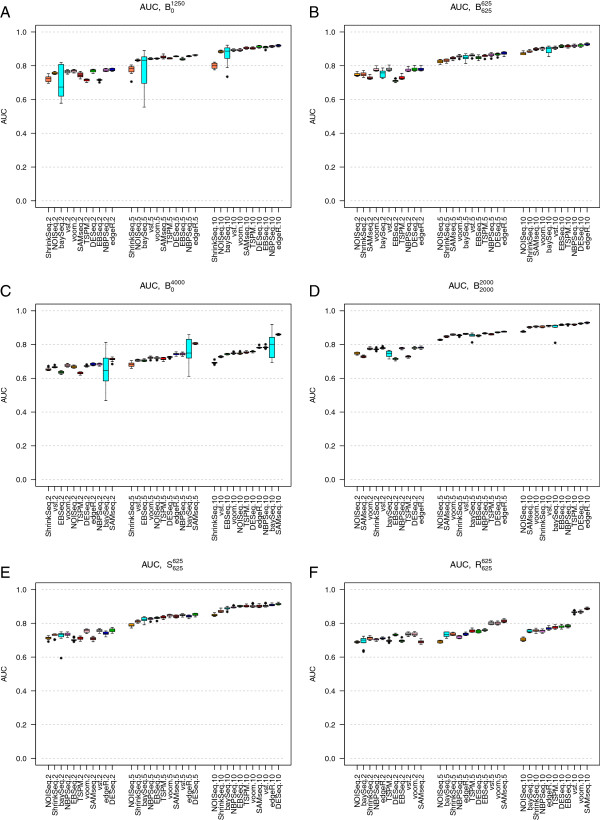
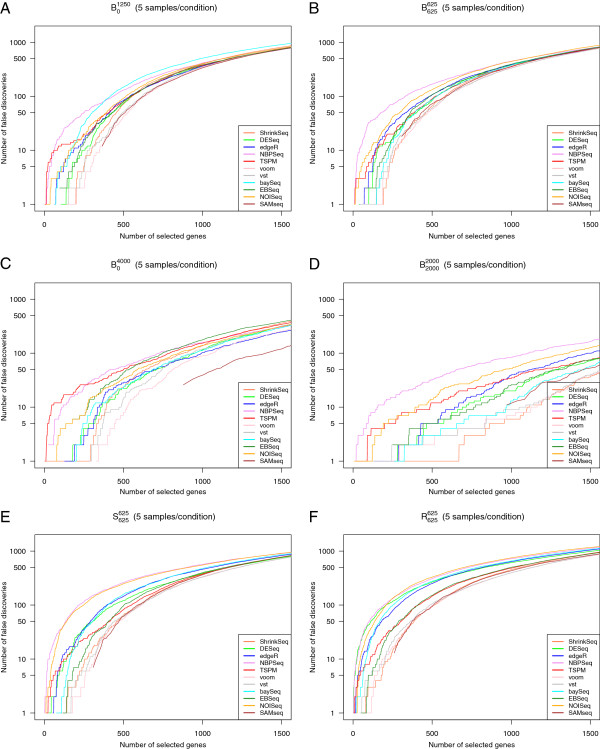
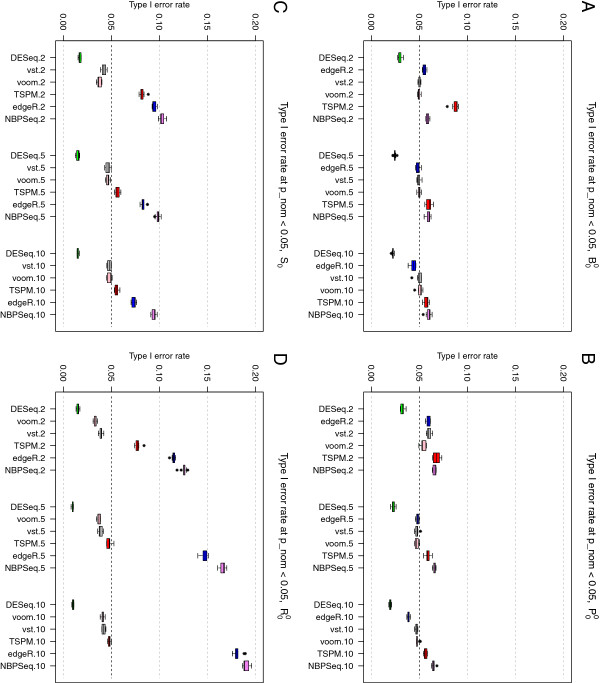
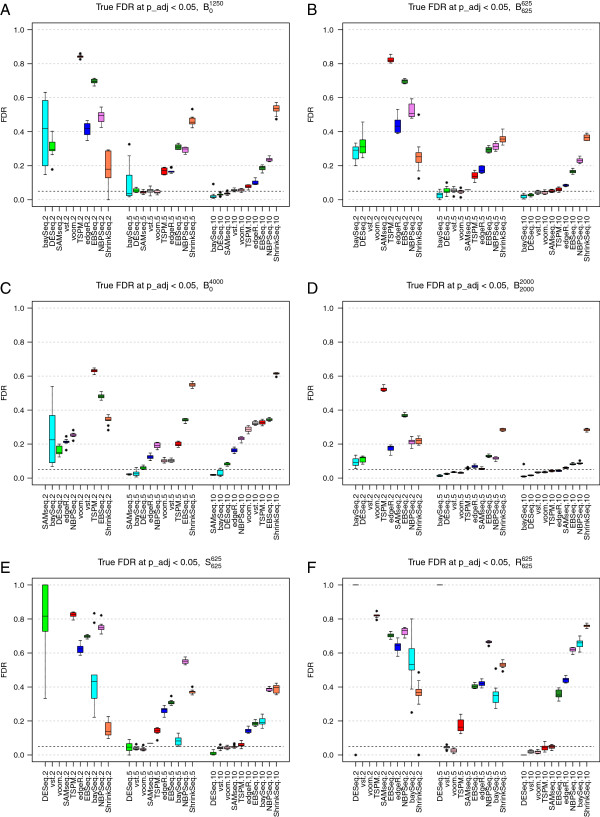
BACKGROUND: Finding genes that are differentially expressed between conditions is an integral part of understanding the molecular basis of phenotypic variation. In the past decades, DNA microarrays have been used extensively to quantify the abundance of mRNA corresponding to different genes, and more recently high-throughput sequencing of cDNA (RNA-seq) has emerged as a powerful competitor. As the cost of sequencing decreases, it is conceivable that the use of RNA-seq for differential expression analysis will increase rapidly. To exploit the possibilities and address the challenges posed by this relatively new type of data, a number of software packages have been developed especially for differential expression analysis of RNA-seq data. RESULTS: We conducted an extensive comparison of eleven methods for differential expression analysis of RNA-seq data. All methods are freely available within the R framework and take as input a matrix of counts, i.e. the number of reads mapping to each genomic feature of interest in each of a number of samples. We evaluate the methods based on both simulated data and real RNA-seq data. CONCLUSIONS: Very small sample sizes, which are still common in RNA-seq experiments, impose problems for all evaluated methods and any results obtained under such conditions should be interpreted with caution. For larger sample sizes, the methods combining a variance-stabilizing transformation with the 'limma' method for differential expression analysis perform well under many different conditions, as does the nonparametric SAMseq method.
Overview
The claims and statistics of this paper haven’t been checked yet.
Run the check — free, no account needed. It reads the open-access text and checks the sources it cites.
Integrity signals
Registry
Cites
Statistics
Figures
Verification
Claims the paper makes
The claims and statistics of this paper haven’t been checked yet.
Run the check — free, no account needed. It reads the open-access text and checks the sources it cites.
Claims other papers make about this one
Each is checked against this paper’s own text: does it say what the citing paper says it does?
The source backs part of the claim, not all of it — or backs it for a different population, condition or comparison.
In the citing paper
“Recent independent comparison studies have demonstrated that the choice of the method (or even the version of a software package) can markedly affect the outcome of the analysis and that no single method is likely to perform favorably for all datasets [56, 63, 64]”
From A survey of best practices for RNA-seq data analysis (2016) · cites this paper as [56]
Experimental — accuracy not yet measuredIn the citing paper
“Methods for transforming normalized counts of RNA-seq reads while learning the variance structure of the data have been shown to perform well in comparison to the discrete distribution approaches described above [55, 56].”
From A survey of best practices for RNA-seq data analysis (2016) · cites this paper as [56]
In the citing paper
“Most comparison studies have focused on simulated datasets [56, 208, 209] or on samples to which exogenous RNA (‘spike-in’) has been added in known quantities [63, 196].”
From A survey of best practices for RNA-seq data analysis (2016) · cites this paper as [56]
In the citing paper
“Cuffdiff and Cuffdiff2 have performed surprisingly poorly in the comparisons [56, 63].”
From A survey of best practices for RNA-seq data analysis (2016) · cites this paper as [56]
In the citing paper
“Among the tools, limma has been shown to perform well under many circumstances and it is also the fastest to run [56, 63, 64].”
From A survey of best practices for RNA-seq data analysis (2016) · cites this paper as [56]
In the citing paper
“Appropriately transformed and normalized sequencing data can be treated similarly to microarray data as far as statistical modelling and multiple corrections are concerned175,220.”
From Systems biology and gene networks in neurodevelopmental and neurodegenerative disorders (2015) · cites this paper as [220]
Self-check
Percentages, sums and reported differences re-computed from the paper’s own numbers.
The self-check needs the paper’s full text.
Citations
Cites
R: A Language and Environment for Statistical Computing
R Core Team (2000) · doi:10.32614/r.manuals · Cited by 355,893
Robinson, M. D., McCarthy, D. J., & Smyth, G. K. (2010) · Bioinformatics · doi:10.1093/bioinformatics/btp616 · Cited by 41,364
Differential expression analysis for sequence count data
Anders, S., & Huber, W. (2010) · Genome Biology · doi:10.1186/gb-2010-11-10-r106 · Cited by 15,581
Trapnell, C., Williams, B. A., Pertea, G., Mortazavi, A., Kwan, G., van Baren, M. J., Salzberg, S. L., Wold, B. J., & Pachter, L. (2010) · Nature Biotechnology · doi:10.1038/nbt.1621 · Cited by 15,556
Mapping and quantifying mammalian transcriptomes by RNA-Seq
Mortazavi, A., Williams, B. A., McCue, K., Schaeffer, L., & Wold, B. (2008) · Nature Methods · doi:10.1038/nmeth.1226 · Cited by 13,696
Smyth, G. K. (2004) · Statistical Applications in Genetics and Molecular Biology · doi:10.2202/1544-6115.1027 · Cited by 11,829
A scaling normalization method for differential expression analysis of RNA-seq data
Robinson, M. D., & Oshlack, A. (2010) · Genome Biology · doi:10.1186/gb-2010-11-3-r25 · Cited by 7,876
Rue, H., Martino, S., & Chopin, N. (2009) · Journal of the Royal Statistical Society Series B: Statistical Methodology · doi:10.1111/j.1467-9868.2008.00700.x · Cited by 5,279
RNA-seq: An assessment of technical reproducibility and comparison with gene expression arrays
Marioni, J. C., Mason, C. E., Mane, S. M., Stephens, M., & Gilad, Y. (2008) · Genome Research · doi:10.1101/gr.079558.108 · Cited by 2,771
Bullard, J. H., Purdom, E., Hansen, K. D., & Dudoit, S. (2010) · BMC Bioinformatics · doi:10.1186/1471-2105-11-94 · Cited by 1,680
Research works printed but not linked: 1
- Bancroft T, Nettleton D: Estimation of false discovery rate using permutation p-values with different discrete null distributions. Technical Report: Iowa State University; 2009. [ http://www.stat.iastate.edu/preprint/articles/2009-05.pdf ] []
Cited by
Sorted by citations
Items 301–400 of 892
Guidelines for RNA-Seq data analysis
Delhomme, N., Mähler, N., Schiffthaler, B., Sundell, D., Hvidsten, T. R., & Street, N. R. (2014) · Cited by 23
Comparative transcriptomics and metabolomics in a rhesus macaque drug administration study
Lee, K. J., Yin, W., Arafat, D., Tang, Y., Uppal, K., Tran, V., Cabrera-Mora, M., Lapp, S. A., Moreno, A., Meyer, E. V. S., et al. (2014) · Frontiers in Cell and Developmental Biology · doi:10.3389/fcell.2014.00054 · Cited by 22
Escorcia-Rodríguez, J. M., Gaytan-Nuñez, E., Hernandez-Benitez, E. M., Zorro-Aranda, A., Tello‐Palencia, M. A., & Freyre-González, J. A. (2023) · Frontiers in Genetics · doi:10.3389/fgene.2023.1143382 · Cited by 22
Wu, C., Crowhurst, R. N., Dennis, A. B., Twort, V., Liu, S., Newcomb, R. D., Ross, H. A., & Buckley, T. R. (2016) · PLoS ONE · doi:10.1371/journal.pone.0157783 · Cited by 22
Córdova, P., Alcaı́no, J., Bravo, N., Barahona, S., Sepúlveda, D., Fernández‐Lobato, M., Baeza, M., & Cifuentes, V. (2016) · Microbial Cell Factories · doi:10.1186/s12934-016-0597-1 · Cited by 22
Das, S., Shyamal, S., & Durica, D. S. (2016) · Integrative and Comparative Biology · doi:10.1093/icb/icw117 · Cited by 22
RNA sequencing in post‐mortem human brains of neuropsychiatric disorders
Wu, C. J., Bendriem, R. M., Garamszegi, S. P., Song, L., & Lee, C. (2017) · Psychiatry and Clinical Neurosciences · doi:10.1111/pcn.12550 · Cited by 22
Biomarker Identification from RNA-Seq Data using a Robust Statistical Approach
Akond, Z., Alam, M., & Mollah, M. N. H. (2018) · Bioinformation · doi:10.6026/97320630014153 · Cited by 22
van den Esker, M. H., & Koets, A. P. (2019) · Veterinary Sciences · doi:10.3390/vetsci6030059 · Cited by 22
Bichat, A., Plassais, J., Ambroise, C., & Mariadassou, M. (2020) · Frontiers in Microbiology · doi:10.3389/fmicb.2020.00649 · Cited by 22
SingleCAnalyzer: Interactive Analysis of Single Cell RNA-Seq Data on the Cloud
Prieto, C. A. V., Barrios, D., & Villaverde, A. (2022) · Frontiers in Bioinformatics · doi:10.3389/fbinf.2022.793309 · Cited by 22
Dona, M. S. I., Prendergast, L. A., Mathivanan, S., Keerthikumar, S., & Salim, A. (2017) · Bioinformatics · doi:10.1093/bioinformatics/btw833 · Cited by 22
Essential guidelines for computational method benchmarking
Weber, L. M., Saelens, W., Cannoodt, R., Soneson, C., Hapfelmeier, A., Gardner, P. P., Boulesteix, A.-L., Saeys, Y., & Robinson, M. D. (2019) · Genome Biology · doi:10.1186/s13059-019-1738-8 · Cited by 21
Self-citationRNA sequencing: current and prospective uses in metabolic research
Vikman, P. J., Fadista, J., & Oskolkov, N. (2014) · Journal of Molecular Endocrinology · doi:10.1530/jme-14-0170 · Cited by 23
DREAMSeq: An Improved Method for Analyzing Differentially Expressed Genes in RNA-seq Data
Gao, Z., Zhao, Z., & Tang, W. (2018) · Frontiers in Genetics · doi:10.3389/fgene.2018.00588 · Cited by 22
Ho, P., Rhee, H., Kim, J., Seo, C., Park, J. K., Young, C. R., & Won, Y. (2019) · Biological Bulletin · doi:10.1086/703186 · Cited by 21
Druggable transcriptomic pathways revealed in Parkinson’s patient-derived midbrain neurons
van den Hurk, M., Lau, S., Marchetto, M. C., Mertens, J., Stern, S., Corti, O., Brice, A., Winner, B., Winkler, J., Gage, F. H., et al. (2022) · npj Parkinson s Disease · doi:10.1038/s41531-022-00400-0 · Cited by 21
deGPS is a powerful tool for detecting differential expression in RNA-sequencing studies
Chu, C., Zhao-ben, F., Hua, X., Yang, Y., Chen, E., Cowley, A. W., Liang, M., Liu, P., & Lü, Y. (2015) · BMC Genomics · doi:10.1186/s12864-015-1676-0 · Cited by 21
LFCseq: a nonparametric approach for differential expression analysis of RNA-seq data
Lin, B., Zhang, L., & Chen, X. (2014) · BMC Genomics · doi:10.1186/1471-2164-15-s10-s7 · Cited by 21
Eberhardt, M., Lai, X., Tomar, N., Gupta, S. K., Schmeck, B., Steinkasserer, A., Schuler, G., & Vera, J. (2015) · Methods in molecular biology · doi:10.1007/978-1-4939-3283-2_9 · Cited by 21
Mombaerts, L., Carignano, A., Robertson, F. C., Hearn, T. J., Jin, J., Hayden, D., Rutterford, Z., Hotta, C. T., Hubbard, K. E., Martí, M. C., et al. (2019) · PLoS Computational Biology · doi:10.1371/journal.pcbi.1006674 · Cited by 21
Short paired-end reads trump long single-end reads for expression analysis
Freedman, A. H., Gaspar, J. M., & Sackton, T. B. (2020) · BMC Bioinformatics · doi:10.1186/s12859-020-3484-z · Cited by 23
Maturational Changes in Mouse Cutaneous Touch and Piezo2-Mediated Mechanotransduction
Michel, N., Narayanan, P., Shomroni, O., & Schmidt, M. (2020) · Cell Reports · doi:10.1016/j.celrep.2020.107912 · Cited by 25
Pedersen, C. B., Nielsen, F. C., Rossing, M., & Olsen, L. R. (2018) · Molecular Oncology · doi:10.1002/1878-0261.12389 · Cited by 20
Bioinformatics approaches to single-cell analysis in developmental biology
Yalcin, D., Hakguder, Z., & Otu, H. H. (2015) · Molecular Human Reproduction · doi:10.1093/molehr/gav050 · Cited by 20
lncRNA expression in the auditory forebrain during postnatal development
Guo, Y. P., Zhang, P., Sheng, Q., Zhao, S., & Hackett, T. A. (2016) · Gene · doi:10.1016/j.gene.2016.08.027 · Cited by 20
Advances in the application of high-throughput sequencing in invertebrate virology
van Aerle, R., & Santos, E. M. (2017) · Journal of Invertebrate Pathology · doi:10.1016/j.jip.2017.02.006 · Cited by 21
Modelling of zero-inflation improves inference of metagenomic gene count data
Jönsson, V., Österlund, T., Nerman, O., & Kristiansson, E. (2018) · Statistical Methods in Medical Research · doi:10.1177/0962280218811354 · Cited by 20
Koehn, L. M., Huang, Y., Habgood, M. D., Nie, S., Chiou, S., Banati, R. B., Dzięgielewska, K. M., & Saunders, N. R. (2021) · Scientific Reports · doi:10.1038/s41598-021-99139-6 · Cited by 20
Brereton, N. J. B., Gonzalez, E., Marleau, J., Nissim, W. G., Labrecque, M., Joly, S., & Pitre, F. E. (2016) · PLANT PHYSIOLOGY · doi:10.1104/pp.16.00090 · Cited by 22
Zhu, X., Fan, F., Qiu, H., Shao, M., Li, D., Yu, Y. H., Bi, C., & Zhang, X. (2022) · mLife · doi:10.1002/mlf2.12021 · Cited by 19
den Berge, K. V., Chou, H.-J., de Bézieux, H. R., Street, K., Risso, D., Ngai, J., & Dudoit, S. (2022) · Cell Reports Methods · doi:10.1016/j.crmeth.2022.100321 · Cited by 19
Transcription Analysis of the Acid Tolerance Mechanism of Pichia kudriavzevii NBRC1279 and NBRC1664
Akita, H., & Matsushika, A. (2023) · Fermentation · doi:10.3390/fermentation9060559 · Cited by 19
Best practices for differential accessibility analysis in single-cell epigenomics
Teo, A. Y. Y., Squair, J. W., Courtine, G., & Skinnider, M. A. (2024) · Nature Communications · doi:10.1038/s41467-024-53089-5 · Cited by 19
Koopmans, F., Cornelisse, L. N., Heskes, T., & Dijkstra, T. M. H. (2014) · Journal of Proteome Research · doi:10.1021/pr500171u · Cited by 19
Differential toxicity and venom gland gene expression in Centruroides vittatus
McElroy, T., McReynolds, C. N., Gulledge, A. A., Knight, K. R., Smith, W. E., & Albrecht, E. A. (2017) · PLoS ONE · doi:10.1371/journal.pone.0184695 · Cited by 19
Differential Gene Expression Analysis of RNA-seq Data Using Machine Learning for Cancer Research
Liñares-Blanco, J., Gestal, M., Dorado, J., & Fernandez-Lozano, C. (2019) · Learning and analytics in intelligent systems · doi:10.1007/978-3-030-15628-2_3 · Cited by 19
Kumar, S., Dhara, V. G., Orzolek, L. D., Hao, H., More, A. J., Lau, E. C., & Betenbaugh, M. J. (2020) · Applied Microbiology and Biotechnology · doi:10.1007/s00253-020-10972-7 · Cited by 19
Song, J., & McDowell, J. R. (2020) · Ecology and Evolution · doi:10.1002/ece3.7138 · Cited by 19
Wu, W., Nemri, A., Blackman, L. M., Catanzariti, A., Sperschneider, J., Lawrence, G. J., Dodds, P. N., Jones, D. A., & Hardham, A. R. (2019) · PLoS ONE · doi:10.1371/journal.pone.0226106 · Cited by 18
Cardiovascular Transcriptomics and Epigenomics Using Next-Generation Sequencing
Wu, P.-Y., Chandramohan, R., Phan, J. H., Mahle, W. T., Gaynor, J. W., Maher, K., & Wang, M. D. (2014) · Circulation Cardiovascular Genetics · doi:10.1161/circgenetics.113.000129 · Cited by 18
DGEclust: differential expression analysis of clustered count data
Vavoulis, D. V., Francescatto, M., Heutink, P., & Gough, J. (2015) · Genome biology · doi:10.1186/s13059-015-0604-6 · Cited by 18
Medo, M., Aebersold, D. M., & Medová, M. (2019) · BMC Bioinformatics · doi:10.1186/s12859-019-3144-3 · Cited by 18
Fan, Y., Vilgalys, T. P., Sun, S., Peng, Q., Tung, J., & Zhou, X. (2019) · Genome biology · doi:10.1186/s13059-019-1813-1 · Cited by 20
Yang, W., Rosenstiel, P. C., & Schulenburg, H. (2019) · BMC Genomics · doi:10.1186/s12864-019-5686-1 · Cited by 18
Chang, X., Zhang, S., Cao, C., Zhou, J., Wang, X., Zhang, D., & Xiang, J. (2024) · Heliyon · doi:10.1016/j.heliyon.2024.e38083 · Cited by 17
Bioinformatics for RNA‐Seq Data Analysis
Zhao, S., Zhang, B., Zhang, Y., Gordon, W., Du, S., Paradis, T., Vincent, M. S., & von Schack, D. (2016) · InTech eBooks · doi:10.5772/63267 · Cited by 20
Normalization of RNA-Seq data using adaptive trimmed mean with multi-reference
Singh, V., Kirtipal, N., Song, B., & Lee, S. (2024) · Briefings in Bioinformatics · doi:10.1093/bib/bbae241 · Cited by 19
Pop’s Pipes: poplar gene expression data analysis pipelines
Li, X., Gunasekara, C., Guo, Y., Zhang, H., Liang, L., Tunlaya‐Anukit, S., Busov, V. B., Chiang, V. L., & Wei, H. (2014) · Tree Genetics & Genomes · doi:10.1007/s11295-014-0745-x · Cited by 17
Functional Evaluations of Genes Disrupted in Patients with Tourette’s Disorder
Sun, N., Tischfield, J. A., King, R. A., & Heiman, G. A. (2016) · Frontiers in Psychiatry · doi:10.3389/fpsyt.2016.00011 · Cited by 17
Using RNA-seq for Analysis of Differential Gene Expression in Fungal Species
Wang, C., Schröder, M., Hammel, S., & Butler, G. (2015) · Methods in molecular biology · doi:10.1007/978-1-4939-3079-1_1 · Cited by 17
An introduction to computational tools for differential binding analysis with ChIP‐seq data
Tu, S., & Shao, Z. (2017) · Quantitative Biology · doi:10.1007/s40484-017-0111-8 · Cited by 17
(Post-)Genomics approaches in fungal research
Pontes, M. V. A., de Vries, R. P., & Zhou, M. (2014) · Briefings in Functional Genomics · doi:10.1093/bfgp/elu028 · Cited by 17
Wang, H., Zhao, H., Huang, X., Sun, K., & Feng, J. (2018) · Scientific Reports · doi:10.1038/s41598-018-34333-7 · Cited by 18
da Silveira, W. A., Hazard, E. S., Chung, D., & Hardiman, G. (2019) · Methods in molecular biology · doi:10.1007/978-1-4939-9004-7_13 · Cited by 17
Compositional Data Analysis is necessary for simulating and analyzing RNA-Seq dataPreprint
McGee, W. A., Pimentel, H., Pachter, L. S., & Wu, J. Y. (2019) · bioRxiv (Cold Spring Harbor Laboratory) · doi:10.1101/564955 · Cited by 18
Cui, W., Xue, H., Geng, Y., Zhang, J., Liang, Y., Tian, X., & Wang, Q. (2021) · Annals of Human Genetics · doi:10.1111/ahg.12441 · Cited by 16
Allele expression biases in mixed-ploid sugarcane accessions
Correr, F. H., Furtado, A., Garcia, A. A. F., Henry, R. J., & Margarido, G. R. A. (2022) · Scientific Reports · doi:10.1038/s41598-022-12725-0 · Cited by 16
Budhraja, S., Doborjeh, M., Singh, B., Tan, S. C. W., Doborjeh, Z., Lai, E. M.-K., Merkin, A., Lee, J., Goh, W. W. B., & Kasabov, N. K. (2023) · Briefings in Bioinformatics · doi:10.1093/bib/bbad382 · Cited by 19
Explicit Scale Simulation for analysis of RNA-sequencing count data with ALDEx2
Gloor, G. B., Nixon, M. P., & Silverman, J. D. (2025) · NAR Genomics and Bioinformatics · doi:10.1093/nargab/lqaf108 · Cited by 16
Molecular biology approaches in bioadhesion research
Rodrigues, M., Lengerer, B., Ostermann, T., & Ladurner, P. (2014) · Beilstein Journal of Nanotechnology · doi:10.3762/bjnano.5.112 · Cited by 16
Empirical Bayes shrinkage and false discovery rate estimation, allowing for unwanted variation
Gerard, D., & Stephens, M. (2018) · Biostatistics · doi:10.1093/biostatistics/kxy029 · Cited by 20
Bayesian negative binomial regression for differential expression with confounding factors
Dadaneh, S. Z., Zhou, M., & Qian, X. (2018) · Bioinformatics · doi:10.1093/bioinformatics/bty330 · Cited by 16
lncDIFF: a novel quasi-likelihood method for differential expression analysis of non-coding RNA
Li, Q., Yu, X., Chaudhary, R., Slebos, R. J. C., Chung, C. H., & Wang, X. (2019) · BMC Genomics · doi:10.1186/s12864-019-5926-4 · Cited by 16
Cancer as a Tissue Anomaly: Classifying Tumor Transcriptomes Based Only on Healthy Data
Quinn, T. P., Nguyen, T., Lee, S., & Venkatesh, S. (2019) · Frontiers in Genetics · doi:10.3389/fgene.2019.00599 · Cited by 16
Identification of root transcriptional responses to shoot illumination in Arabidopsis thaliana
Miotto, Y. E., da Costa, C. T., de Oliveira, B. H., Guzmán, F., Margis, R., de Almeida, R. M. C., Offringa, R., & Maraschin, F. D. S. (2019) · Plant Molecular Biology · doi:10.1007/s11103-019-00918-7 · Cited by 16
An improved understanding of cancer genomics through massively parallel sequencing.
Teer, J. K. (2014) · PubMed · doi:10.3978/j.issn.2218-676x.2014.05.05 · Cited by 16
On the study of microbial transcriptomes using second- and third-generation sequencing technologies
Choi, S. C. (2016) · The Journal of Microbiology · doi:10.1007/s12275-016-6233-2 · Cited by 16
Fear, J. M., Arbeitman, M. N., Salomon, M. P., Dalton, J. E., Tower, J., Nuzhdin, S. V., & McIntyre, L. M. (2015) · BMC Systems Biology · doi:10.1186/s12918-015-0200-0 · Cited by 15
Do changes in gene expression contribute to sexual isolation and reinforcement in the house mouse?
Loire, É., Tusso, S., Caminade, P., Séverac, D., Boursot, P., Ganem, G., & Smadja, C. M. (2017) · Molecular Ecology · doi:10.1111/mec.14212 · Cited by 15
MicroScope: ChIP-seq and RNA-seq software analysis suite for gene expression heatmaps
Khomtchouk, B. B., Hennessy, J. R., & Wahlestedt, C. (2016) · BMC Bioinformatics · doi:10.1186/s12859-016-1260-x · Cited by 15
Bayesian Framework for Detecting Gene Expression Outliers in Individual Samples
Vivian, J., Eizenga, J. M., Beale, H. C., Vaske, O. M., & Paten, B. (2020) · JCO Clinical Cancer Informatics · doi:10.1200/cci.19.00095 · Cited by 15
MCMSeq: Bayesian hierarchical modeling of clustered and repeated measures RNA sequencing experiments
Vestal, B. E., Moore, C. M., Wynn, E. A., Saba, L. M., Fingerlin, T. E., & Kechris, K. J. (2020) · BMC Bioinformatics · doi:10.1186/s12859-020-03715-y · Cited by 15
Statistical Data Analysis of Microbiomes and Metabolomics
Xia, Y., & Sun, J. (2021) · ACS in focus · doi:10.1021/acsinfocus.7e5035 · Cited by 15
Gosch, A., Bhardwaj, A., & Courts, C. (2023) · Forensic Science International Genetics · doi:10.1016/j.fsigen.2023.102915 · Cited by 16
Fully automated pipeline for detection of sex linked genes using RNA-Seq data
Čechová, M., Kubát, Z., Hobza, R., Vyskot, B., & Kejnovský, E. (2015) · BMC Bioinformatics · doi:10.1186/s12859-015-0509-0 · Cited by 15
The impact of RNA-seq aligners on gene expression estimation
Yang, C., Wu, P.-Y., Li, T., Phan, J. H., & Wang, M. D. (2015) · ACM International Conference on Bioinformatics, Computational Biology, and Health Informatics (ACM-BCB) · doi:10.1145/2808719.2808767 · Cited by 15
Zhang, M., Xiao, F., Li, Y., Chen, Z., Zhang, X., Zhang, X., Song, J., Zhang, Y., Si, X., Bai, J., et al. (2022) · International Journal of Hematology · doi:10.1007/s12185-022-03483-w · Cited by 15
Patón, V., Flores, R. O. R., Gábor, A., Badia-i-Mompel, P., Tanevski, J., Garrido‐Rodríguez, M., & Sáez-Rodríguez, J. (2024) · Nucleic Acids Research · doi:10.1093/nar/gkae552 · Cited by 14
Gene signatures for cancer research: A 25-year retrospective and future avenues
Liu, W., He, H., & Chicco, D. (2024) · PLoS Computational Biology · doi:10.1371/journal.pcbi.1012512 · Cited by 15
Luo, H., Li, J., Chia, B. K. H., Robson, P., & Nagarajan, N. (2014) · Genome biology · doi:10.1186/s13059-014-0527-7 · Cited by 14
RNA-Seq Data Analysis for Studying Abiotic Stress in Horticultural Plants
Mironova, V., Weinholdt, C., & Große, I. (2014) · Springer eBooks · doi:10.1007/978-4-431-55251-2_14 · Cited by 14
Cardoso, S. D., Gonçalves, D., Goesmann, A., Canário, A. V. M., & Oliveira, R. F. (2017) · Molecular Ecology · doi:10.1111/mec.14408 · Cited by 14
Identifying novel candidate biomarkers of RCC based on WGCNA analysis
Deng, J., Kong, W., Mou, X., Wang, S., & Zeng, W. (2018) · Personalized Medicine · doi:10.2217/pme-2017-0091 · Cited by 14
Identifying Breast Cancer-induced Gene Perturbations and its Application in Guiding Drug Repurposing
Zhuang, J., Dai, S., Zhang, L., Gao, P., Han, Y., Tian, G., Yan, N., Tang, M., & Kui, L. (2020) · Current Bioinformatics · doi:10.2174/1574893615666200203104214 · Cited by 14
Terkelsen, T., Krogh, A., & Papaleo, E. (2020) · PLoS Computational Biology · doi:10.1371/journal.pcbi.1007665 · Cited by 14
Association of gene expression with syringyl to guaiacyl ratio in sugarcane lignin
Hodgson-Kratky, K. J. M., Perlo, V., Furtado, A., Choudhary, H., Gladden, J. M., Simmons, B. A., Botha, F. C., & Henry, R. J. (2021) · Plant Molecular Biology · doi:10.1007/s11103-021-01136-w · Cited by 14
Roberts, A. G. K., Catchpoole, D. R., & Kennedy, P. J. (2022) · NAR Genomics and Bioinformatics · doi:10.1093/nargab/lqab124 · Cited by 15
Diez-Pinel, G., Horder, J. L., King, J. R., McIntyre, A., Mongan, N. P., Goméz-López, G., & Benest, A. V. (2022) · Methods in molecular biology · doi:10.1007/978-1-0716-2059-5_29 · Cited by 14
Hussein, M. H., Wong, L. J. M., Zhao, J., Rees, V. E., Allobawi, R., Sharma, R., Rao, G. G., Baker, M. A., Li, J., & Velkov, T. (2022) · Computational and Structural Biotechnology Journal · doi:10.1016/j.csbj.2022.02.021 · Cited by 14
Segura-Ortiz, A., García-Nieto, J., Aldana-Montes, J. F., & Navas‐Delgado, I. (2023) · Computers in Biology and Medicine · doi:10.1016/j.compbiomed.2023.106653 · Cited by 14
Becoming data-savvy in a big-data world
Xu, M., & Rhee, S. Y. (2014) · Trends in Plant Science · doi:10.1016/j.tplants.2014.08.003 · Cited by 14
Sahadevan, S., Gunawan, A., Tholen, E., Große‐Brinkhaus, C., Tesfaye, D., Schellander, K., Hofmann‐Apitius, M., Çınar, M. U., & Uddin, M. J. (2014) · PLoS ONE · doi:10.1371/journal.pone.0091077 · Cited by 14
Yu, W., Zhao, S., Wang, Y., Zhao, B. N., Zhao, W., & Zhou, X. (2017) · Oncotarget · doi:10.18632/oncotarget.22878 · Cited by 14
Construction of an integrated gene regulatory network link to stress-related immune system in cattle
Behdani, E., & Bakhtiarizadeh, M. R. (2017) · Genetica · doi:10.1007/s10709-017-9980-z · Cited by 14
Depth normalization of small RNA sequencing: using data and biology to select a suitable method
Düren, Y., Lederer, J., & Qin, L. (2022) · Nucleic Acids Research · doi:10.1093/nar/gkac064 · Cited by 13
Cell tracking with accurate error prediction
Betjes, M. A., Kok, R. N. U., Tans, S. J., & van Zon, J. S. (2025) · Nature Methods · doi:10.1038/s41592-025-02845-6 · Cited by 14
Davis, K. U., & Sheats, M. K. (2021) · Veterinary Immunology and Immunopathology · doi:10.1016/j.vetimm.2021.110195 · Cited by 13
Impact of adaptive filtering on power and false discovery rate in RNA-seq experiments
Zehetmayer, S., Posch, M., & Graf, A. C. (2022) · BMC Bioinformatics · doi:10.1186/s12859-022-04928-z · Cited by 13
Nießl, C., Hoffmann, S., Ullmann, T., & Boulesteix, A. (2023) · Biometrical Journal · doi:10.1002/bimj.202200238 · Cited by 13
Metadata
- Authors
- Soneson, C., & Delorenzi, M.
- Affiliations
- SIB Swiss Institute of Bioinformatics (CH)
- Corresponding author
- Soneson, Charlotte
- Venue
- BMC Bioinformatics
- Published
- 2013-03-09
- Volume
- 14
- Issue
- 1
- Pages
- 91-91
- ISSN
- 1471-2105 (ISSN-L)
- PMC
- PMC3608160
- OpenAlex
- W2074414424
- Cited by
- 887
- References
- 34
- Citations by year
- 2026: 24 · 2025: 21 · 2024: 46 · 2023: 45 · 2022: 50 · 2021: 84 · 2020: 66 · 2019: 82 · 2018: 72 · 2017: 83 · 2016: 91 · 2015: 97 · 2014: 101 · 2013: 24
- FWCI
- 46.70
- Type
- journal article
- Language
- en
- Open access
- gold
- doi.org
- Licence
- Locations
- BMC Bioinformatics (publishedVersion, cc-by)
- Europe PMC (PubMed Central) (publishedVersion, cc-by)
- PubMed Central (publishedVersion, cc-by)
- PubMed (publishedVersion)
- IRIS (submittedVersion)
- SERVAL (Université de Lausanne) (submittedVersion, other-oa)
- Topics
- Life Sciences › Biochemistry, Genetics and Molecular Biology › Molecular Biology › Gene expression and cancer classification
- Life Sciences › Biochemistry, Genetics and Molecular Biology › Molecular Biology › Genomics and Phylogenetic Studies
- Life Sciences › Biochemistry, Genetics and Molecular Biology › Molecular Biology › Single-cell and spatial transcriptomics
- Keywords
- differential expression analysis, RNA-seq, method comparison, small sample size, variance stabilizing transformation, limma, count data, R package, simulated data
- MeSH terms
- Animals, Mice, Inbred C57BL, Mice, Inbred DBA, RNA, Messenger, Software, Genome, Sequence Analysis, RNA, DNA, Complementary, Gene Expression Profiling, Genomics, Mice
About these checks
Registry, retraction, Cites and statistics results are computed, not judged, with one exception: a printed reference that no index lists is read once by a model before it counts as a citation error. Claims are extracted by a model and kept only when their quote appears verbatim in the text; each cited source is then checked, with a model’s help, for whether it says what the claim relies on. Those verdicts can be wrong — read the claim’s quote and the cited source before relying on one.
Statistics and arithmetic are recomputed, not judged.
Confidence bands are shown only for fields calibrated on our annotated test set. None is calibrated yet, so no band is shown.
What counts as a claim ›How we measure confidence ›How we check this ›
Are you an author, or do you see a problem with this page? Request a review
