

The DOI matches its Crossref record; 27 of the 27 references it cites were found in a registry or an index.
STEM: a tool for the analysis of short time series gene expression data
Open accessAbstract
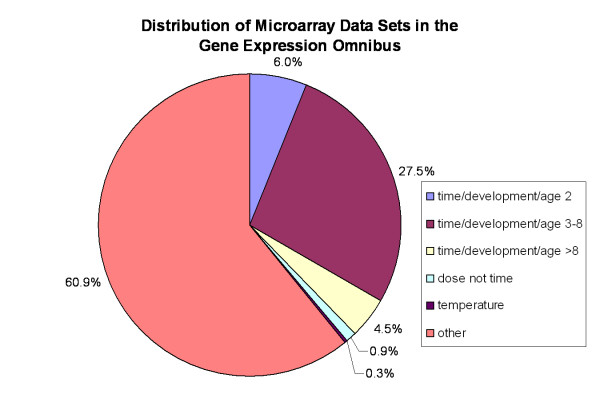
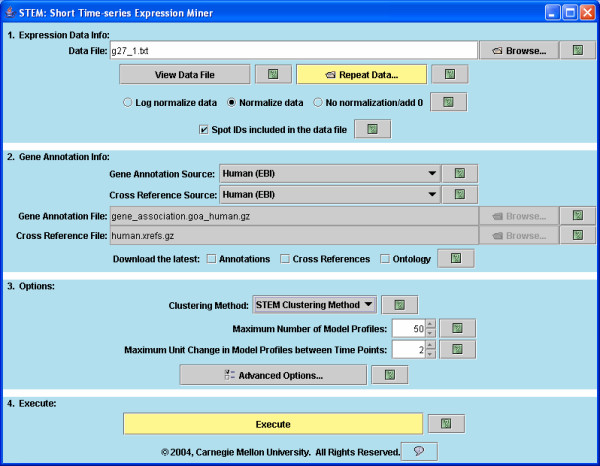
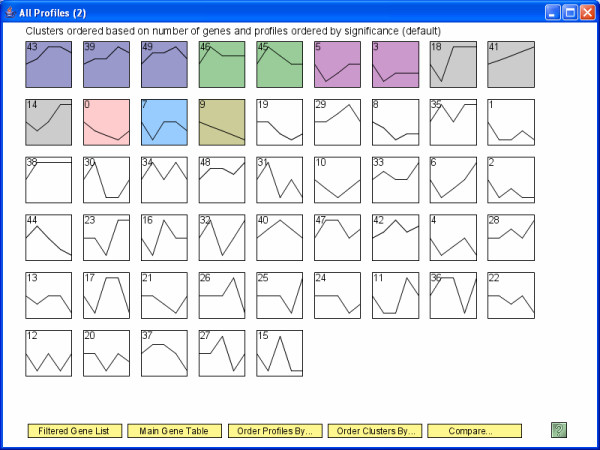
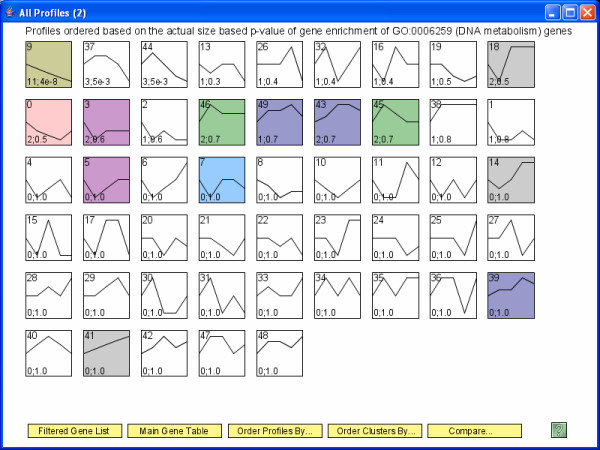
Background: Time series microarray experiments are widely used to study dynamical biological processes. Due to the cost of microarray experiments, and also in some cases the limited availability of biological material, about 80% of microarray time series experiments are short (3–8 time points). Previously short time series gene expression data has been mainly analyzed using more general gene expression analysis tools not designed for the unique challenges and opportunities inherent in short time series gene expression data. Results: We introduce the Short Time-series Expression Miner (STEM) the first software program specifically designed for the analysis of short time series microarray gene expression data. STEM implements unique methods to cluster, compare, and visualize such data. STEM also supports efficient and statistically rigorous biological interpretations of short time series data through its integration with the Gene Ontology. Conclusion: The unique algorithms STEM implements to cluster and compare short time series gene expression data combined with its visualization capabilities and integration with the Gene Ontology should make STEM useful in the analysis of data from a significant portion of all microarray studies. STEM is available for download for free to academic and non-profit users at http://www.cs.cmu.edu/~jernst/stem .
Overview
The claims and statistics of this paper haven’t been checked yet.
Run the check — free, no account needed. It reads the open-access text and checks the sources it cites.
Integrity signals
Registry
Cites
Statistics
Figures
Verification
Claims the paper makes
The claims and statistics of this paper haven’t been checked yet.
Run the check — free, no account needed. It reads the open-access text and checks the sources it cites.
Claims other papers make about this one
Each is checked against this paper’s own text: does it say what the citing paper says it does?
In the citing paper
“edge relationships using mutual information or other association measures might be necessary to accurately detect modules in time-series data, which can be non-monotonic46–48.”
From Systems biology and gene networks in neurodevelopmental and neurodegenerative disorders (2015) · cites this paper as [47]
Self-check
Percentages, sums and reported differences re-computed from the paper’s own numbers.
The self-check needs the paper’s full text.
Citations
Cites
Gene Ontology: tool for the unification of biology
Ashburner, M., Ball, C. A., Blake, J. A., Botstein, D., Butler, H., Cherry, J. M., Davis, A. P., Dolinski, K., Dwight, S. S., Eppig, J. T., et al. (2000) · Nature Genetics · doi:10.1038/75556 · Cited by 43,206
Cluster analysis and display of genome-wide expression patterns
Eisen, M. B., Spellman, P. T., Brown, P. O., & Botstein, D. (1998) · Proceedings of the National Academy of Sciences · doi:10.1073/pnas.95.25.14863 · Cited by 16,184
In silico prediction of protein-protein interactions in human macrophages
Souiai, O., Guerfali, F. Z., Miled, S. B., Brun, C., & Benkahla, A. (2014) · BMC Research Notes · doi:10.1186/1756-0500-7-157 · Cited by 10,785
Significance analysis of microarrays applied to the ionizing radiation response
Tusher, V. G., Tibshirani, R., & Chu, G. (2001) · Proceedings of the National Academy of Sciences · doi:10.1073/pnas.091062498 · Cited by 10,568
TM4: a free, open-source system for microarray data management and analysis
Saeed, A. I., Sharov, V., White, J., Li, J., Liang, W., Bhagabati, N., Braisted, J., Klapa, M., Currier, T., Thiagarajan, M., et al. (2003) · BioTechniques · doi:10.2144/03342mt01 · Cited by 4,837
Spellman, P. T., Sherlock, G. J., Zhang, M. Q., Iyer, V. R., Anders, K. R., Eisen, M. B., Brown, P. O., Botstein, D., & Futcher, B. (1998) · Molecular Biology of the Cell · doi:10.1091/mbc.9.12.3273 · Cited by 4,724
Tamayo, P., Slonim, D. K., Mesirov, J. P., Zhu, Q., Kitareewan, S., Dmitrovsky, E., Lander, E. S., & Golub, T. R. (1999) · Proceedings of the National Academy of Sciences · doi:10.1073/pnas.96.6.2907 · Cited by 2,924
Systematic determination of genetic network architecture
Tavazoie, S., Hughes, J. D., Campbell, M. J., Cho, R. J., & Church, G. M. (1999) · Nature Genetics · doi:10.1038/10343 · Cited by 2,509
NCBI GEO: mining millions of expression profiles--database and tools
Barrett, T. (2004) · Nucleic Acids Research · doi:10.1093/nar/gki022 · Cited by 1,201
Gene Expression During the Life Cycle of Drosophila melanogaster
Arbeitman, M. N., Furlong, E. E. M., Imam, F. B., Johnson, E. A., Null, B. H., Baker, B. S., Krasnow, M. A., Scott, M. P., Davis, R. W., & White, K. P. (2002) · Science · doi:10.1126/science.1072152 · Cited by 926
Cited by
Sorted by citations
Items 701–800 of 1,001
Sazegari, S., Zinati, Z., & Tahmasebi, A. (2020) · Gene Reports · doi:10.1016/j.genrep.2020.100941 · Cited by 14
Liu, C., Li, X., Shao, H., & Li, D. (2020) · Frontiers in Genetics · doi:10.3389/fgene.2020.565206 · Cited by 14
Tai, C.-S., Lan, K.-C., Wang, E., Chan, F., Hsieh, M.-T., Huang, C.-W., Weng, S., Chen, P., & Chen, W. (2021) · Nano Letters · doi:10.1021/acs.nanolett.0c04209 · Cited by 14
Ren, K., Wang, L., Wang, L., Du, Q.-X., Cao, J., Jin, Q., An, G., Li, N., Dang, L.-H., Tian, Y., et al. (2021) · Frontiers in Genetics · doi:10.3389/fgene.2021.650874 · Cited by 14
Cui, G., Zhao, M., Tan, H., Wang, Z., Meng, M., Sun, F., Zhang, C., & Xi, Y. (2021) · Frontiers in Plant Science · doi:10.3389/fpls.2021.664933 · Cited by 14
Comparative Proteomics at the Critical Node of Vigor Loss in Wheat Seeds Differing in Storability
Chen, X., Börner, A., Xin, X., Nagel, M., He, J., Li, J., Li, N., Lu, X., & Yin, G. (2021) · Frontiers in Plant Science · doi:10.3389/fpls.2021.707184 · Cited by 14
Gene Expression Profiles of Multiple Synchronous Lesions in Lung Adenocarcinoma
Lim, J., Han, Y. B., Park, S. Y., Ahn, S., Kim, H., Kwon, H. J., Lee, C., Cho, S., & Chung, J.-H. (2021) · Cells · doi:10.3390/cells10123484 · Cited by 14
Li, L., Xia, T., Li, B., & Yang, H. (2022) · Physiologia Plantarum · doi:10.1111/ppl.13674 · Cited by 14
GCRV NS38 counteracts SVCV proliferation by intracellular antagonization during co-infection
Li, Z.-C., Lu, L.-F., Zhang, C., Wang, X., Tong, J.-F., Han, K.-J., Chen, D., Li, X., Zhou, L., Gui, J., et al. (2022) · Virologica Sinica · doi:10.1016/j.virs.2022.12.003 · Cited by 14
Li, J., Duan, Y., Kong, W., Gao, H., Fu, S., Li, H., Zhou, Y., Liu, H., Yuan, D., & Zhou, C. (2024) · Aquaculture Reports · doi:10.1016/j.aqrep.2024.101998 · Cited by 14
Discovering Relations Among GO-Annotated Clusters by Graph Kernel Methods
Zoppis, I. F., Merico, D., Antoniotti, M., Mishra, B., & Mauri, G. (2007) · Springer eBooks · doi:10.1007/978-3-540-72031-7_15 · Cited by 14
Comparative antennal transcriptome of Apis cerana cerana from four developmental stages
Zhao, H., Zhu, P., Du, Y., Xu, K., Guo, L., Yang, S., Ma, W., & Jiang, Y. (2018) · Gene · doi:10.1016/j.gene.2018.03.068 · Cited by 14
Xue, H.-B., Wu, X., Li, Z., Liu, Y., Yin, X.-L., & Wang, W. (2020) · Aquaculture · doi:10.1016/j.aquaculture.2020.735936 · Cited by 16
Dynamic transcriptional response of Saccharomyces cerevisiae cells to copper
Oc, S., Eraslan, S., & Kırdar, B. (2020) · Scientific Reports · doi:10.1038/s41598-020-75511-w · Cited by 14
Proceedings of the ninth annual UT-ORNL-KBRIN Bioinformatics Summit 2010
Rouchka, E. C., Flight, R. M., & Rinehart, C. A. (2010) · BMC Bioinformatics · doi:10.1186/1471-2105-11-s4-i1 · Cited by 14
Endale, M., Ahlfeld, S. K., Bao, E. L., Chen, X., Green, J., Bess, Z., Weirauch, M. T., Xu, Y. J., & Perl, A. T. (2017) · Data in Brief · doi:10.1016/j.dib.2017.06.001 · Cited by 14
The potential role of CMC1 as an immunometabolic checkpoint in T cell immunity
Chen, Y., Gao, J., Ma, M., Wang, K., Liu, F., Yang, F., Zou, X., Cheng, Z., & Wu, D. (2024) · OncoImmunology · doi:10.1080/2162402x.2024.2344905 · Cited by 13
Negative effect of seasonal heat stress on testis morphology and transcriptomes in Angora rabbit
Ding, H., Wang, Y., Zhao, H., Wang, J., & Huang, D. (2025) · BMC Genomics · doi:10.1186/s12864-025-11659-x · Cited by 13
Hamdan, F. H., Farhadipour, M., Pérez, I., Kossick, K. F., Smith, H., Edwinson, A. L., de Hoyos‐Vega, J. M., Gonzalez, M. M., Chiang, D., Klatt, E. E., et al. (2026) · Cellular and Molecular Gastroenterology and Hepatology · doi:10.1016/j.jcmgh.2026.101774 · Cited by 13
Dynamic gene expression profiles during postnatal development of porcine subcutaneous adipose
Zhang, J., Ma, J., Long, K., Jin, L. G., Liu, Y., Zhou, C., Tian, S., Chen, L., Luo, Z., Tang, Q., et al. (2016) · PeerJ · doi:10.7717/peerj.1768 · Cited by 13
Kan, C. H., Zhao, Y., Sun, K., Tang, X., & Zhao, Y. (2023) · Journal of Phycology · doi:10.1111/jpy.13323 · Cited by 13
Early warning and diagnosis of liver cancer based on dynamic network biomarker and deep learning
Han, Y., Akhtar, J., Liu, G., Li, C., & Wang, G. (2023) · Computational and Structural Biotechnology Journal · doi:10.1016/j.csbj.2023.07.002 · Cited by 13
Yue, X., Huang, R., Xu, M., & Xu, L. (2023) · International Journal of Molecular Sciences · doi:10.3390/ijms241411334 · Cited by 13
Amir, S., Arowolo, O. K., Mironova, E., McGaunn, J. P., Oluwayiose, O. A., Sergeyev, O., Pilsner, J. R., & Suvorov, A. (2024) · eLife · doi:10.7554/elife.90992 · Cited by 13
Li, Q., Ling, Y., Ma, Y., Zhang, T., Yang, Y., & Tao, S. (2024) · Ecotoxicology and Environmental Safety · doi:10.1016/j.ecoenv.2024.115994 · Cited by 13
Wen, G., Wu, B., Wang, Y., Wu, T., Han, Z., & Zhang, X. (2024) · Journal of Integrative Plant Biology · doi:10.1111/jipb.13757 · Cited by 13
Beliakova‐Bethell, N., Jain, S., Woelk, C. H., Witt, M. D., Sun, X., Lada, S. M., Spina, C. A., Goicoechea, M., Rought, S. E., Haubrich, R., et al. (2014) · Antiviral Research · doi:10.1016/j.antiviral.2014.04.005 · Cited by 13
Xiao, X., Bai, P., Cao, S., Jiang, Y., Liang, W., Wang, T., Luo, X., Guan, Q., Gao, L., & Zhang, L. (2020) · Neurochemical Research · doi:10.1007/s11064-020-02973-9 · Cited by 14
Bernal, C., Silvano, M., Tapponnier, Y., Anand, S. K., Angulo, C., & Altaba, A. R. I. (2020) · Cell Reports · doi:10.1016/j.celrep.2020.108372 · Cited by 13
Gong, J., Shi, T., Li, Y., Wang, H., & Li, F. (2021) · Frontiers in Plant Science · doi:10.3389/fpls.2021.707496 · Cited by 13
Wang, Q., Xu, R., Guo, M., Shen, N., Chuaoen, P., Qiu, K., Bian, Y., & Xiao, Y. (2022) · Scientia Horticulturae · doi:10.1016/j.scienta.2022.110965 · Cited by 13
Hu, H., Hu, J., Wang, Q., Xiang, M., & Zhang, Y. (2022) · Journal of the Science of Food and Agriculture · doi:10.1002/jsfa.11816 · Cited by 13
Ren, L., Shang, Y., Zhang, X., Chen, S., Zheng, Y., Zou, Y., Qu, Y., Cai, J., Zhang, C., & Guo, Y. (2022) · Insects · doi:10.3390/insects13050453 · Cited by 13
Gao, D., Huang, J., Lin, G., & Lü, J. (2022) · BMC Genomics · doi:10.1186/s12864-022-08651-0 · Cited by 13
Gong, X., Luo, H., Hong, L., Jun, W., Wu, H., Song, C., Zhao, W., Han, Y., Dao, Y., Zhang, X., et al. (2022) · The Journal of Microbiology · doi:10.1007/s12275-022-2059-2 · Cited by 13
Guo, C., LiuYan, Q., Ma, Y., & JianLin, Q. (2022) · BMC Plant Biology · doi:10.1186/s12870-022-03773-9 · Cited by 13
Xiao, Y., Chen, J., Yang, S., Sun, H., Xie, L., Li, J., Jing, N., & Zhu, X. (2022) · The EMBO Journal · doi:10.15252/embj.2022111364 · Cited by 13
Li, H., Gui, Y., Zhu, K., Wei, J., Zhang, R., Yang, R., Tang, L., Zhou, H., & Liu, X. (2023) · Frontiers in Plant Science · doi:10.3389/fpls.2023.1243664 · Cited by 13
Transcriptomics integrated with metabolomics reveals the effect of cold stress on rice microspores
Li, Y., Zong, Y., Li, W., Guo, G., Zhou, L., Xu, H., Gao, R., & Liu, C. (2023) · BMC Plant Biology · doi:10.1186/s12870-023-04530-2 · Cited by 13
Fan, M., Kuwahara, H., Wang, X., Wang, S., & Gao, X. (2015) · Briefings in Bioinformatics · doi:10.1093/bib/bbv015 · Cited by 13
Ismail, I. A., & Able, A. J. (2017) · Physiological and Molecular Plant Pathology · doi:10.1016/j.pmpp.2017.03.007 · Cited by 13
Ma, L., Su, L., Liu, H., Zhao, F., Zhou, D., & Duan, D. (2017) · Fish & Shellfish Immunology · doi:10.1016/j.fsi.2017.04.023 · Cited by 13
TS-GOEA: a web tool for tissue-specific gene set enrichment analysis based on gene ontology
Peng, J., Lu, G., Xue, H., Wang, T., & Shang, X. (2019) · BMC Bioinformatics · doi:10.1186/s12859-019-3125-6 · Cited by 13
Lag penalized weighted correlation for time series clustering
Chandereng, T., & Gitter, A. (2020) · BMC Bioinformatics · doi:10.1186/s12859-019-3324-1 · Cited by 13
Long Non-coding RNA and mRNA Profile of Liver Tissue During Four Developmental Stages in the Chicken
Ning, C., Ma, T., Hu, S., Xu, Z., Zhang, P., Zhao, X., Wang, Y., Yin, H., Hu, Y., Fan, X., et al. (2020) · Frontiers in Genetics · doi:10.3389/fgene.2020.00574 · Cited by 14
Construction and Deciphering of Human Phosphorylation-Mediated Signaling Transduction Networks
Zhang, M., Li, H., He, Y., Sun, H., Li, X., Wang, L., Sun, B., Ma, L., Zhang, G., Li, J., et al. (2015) · Journal of Proteome Research · doi:10.1021/acs.jproteome.5b00249 · Cited by 13
Chen, Z., Chen, C., Chen, F., Lan, R., Li-n, G., & Xu, Y. (2022) · Frontiers in Immunology · doi:10.3389/fimmu.2022.950076 · Cited by 13
Wang, T., Wu, B., Zhang, X., Zhang, M., Zhang, S., Huang, W., Liu, T., Yu, W., Li, J., & Yu, X. (2019) · Journal of Cellular Biochemistry · doi:10.1002/jcb.27908 · Cited by 13
A novel pattern based clustering methodology for time-series microarray data
Phan, S., Famili, F. A., Tang, Z., Pan, Y., Liu, Z., Ouyang, J., Lenferink, A. E. G., & O'Connor, M. (2007) · International Journal of Computer Mathematics · doi:10.1080/00207160701203419 · Cited by 13
Yoneya, T., & Mamitsuka, H. (2007) · Bioinformatics · doi:10.1093/bioinformatics/btl667 · Cited by 13
Mao, Y., Ji, X., Meng, Q., Xu, Z., Yuan, Y., Li, M., Niu, L., Zhang, Y., & Sun, D. (2022) · Industrial Crops and Products · doi:10.1016/j.indcrop.2022.115563 · Cited by 12
Changes in and asymmetry of the proteome in the human fetal frontal lobe during early development
Zhao, X., Liang, W., Wang, W., Liu, H., Zhang, X., Liu, C., Zhu, C., Cui, B., Tang, Y., & Liu, S. (2022) · Communications Biology · doi:10.1038/s42003-022-04003-6 · Cited by 12
Ni, B., Li, W., Ifrah, K., Du, B., Xu, Y., Zhang, C., & Li, X. (2022) · Genes · doi:10.3390/genes13122341 · Cited by 12
Peng, Y., Ma, T., Wang, X., Zhang, M., Xu, Y., Wei, J., Sha, W., & Li, J. (2023) · Genes · doi:10.3390/genes14020390 · Cited by 12
Lu, C., Zhang, P., Li, S., Cheng, M., & Duan, D. (2023) · BMC Plant Biology · doi:10.1186/s12870-023-04430-5 · Cited by 12
Bai, Y., Wang, H., Zhu, K., & Cheng, Z.-M. (2023) · Horticulture Research · doi:10.1093/hr/uhad225 · Cited by 12
Dong, R., Rafique, H., Niu, Q., Zeng, X., Messia, M. C., Yuan, L., Shi, L. S., Zou, L., Li, L., & Hu, X. (2024) · Food & Function · doi:10.1039/d4fo03374d · Cited by 12
Huang, J., Fang, W., Li, J., Cai, W. C., & Lü, J. (2024) · Aquaculture · doi:10.1016/j.aquaculture.2024.741963 · Cited by 12
Yi, P., Zhao, M., Huang, F., Li, L., Sun, J. Y., Xie, L., Ling, D., Li, J., Huang, M., Gan, T., et al. (2025) · Postharvest Biology and Technology · doi:10.1016/j.postharvbio.2024.113384 · Cited by 12
Calorie restriction up-regulates iron and coppertransportgenes in Saccharomyces cerevisiae
Sharma, P. K., Mittal, N., Deswal, S., & Roy, N. (2010) · Molecular BioSystems · doi:10.1039/c0mb00084a · Cited by 13
MLCut: Exploring Multi-Level Cuts in Dendrograms for Biological Data
Vogogias, A., Kennedy, J., Archambault, D., Smith, V. A., & Currant, H. (2016) · Research Output (Edinburgh Napier University) · doi:10.2312/cgvc.20161288 · Cited by 12
Li, L., Zhang, Y., Zheng, T., Zhuo, X., Li, P., Qiu, L., Liu, W., Wang, J., Cheng, T., & Zhang, Q. (2021) · Scientific Reports · doi:10.1038/s41598-021-81892-3 · Cited by 12
Huang, S., Yang, L., Zhang, L., Sun, B., Gao, J., Chen, Z., Zhong, L., & Cao, X. (2021) · Functional & Integrative Genomics · doi:10.1007/s10142-021-00822-8 · Cited by 12
Identification of Estrus in Sows Based on Salivary Proteomics
Li, C., Song, C., Qi, K., Liu, Y., Dou, Y., Li, X., Qiao, R., Wang, K., Han, X., & Li, X. (2022) · Animals · doi:10.3390/ani12131656 · Cited by 12
Zhang, Q., Li, X., Zhou, X., Li, Y., Zhang, J., Zhang, X., Liu, Y., Chen, Y.-X., Wu, X., Ma, L., et al. (2022) · Molecular and Cellular Endocrinology · doi:10.1016/j.mce.2022.111719 · Cited by 12
Fang, R., Chen, X., Zhang, X., & Wang, B. (2022) · Food Research International · doi:10.1016/j.foodres.2022.112188 · Cited by 12
Metabolomics reveals metabolites associated with hair follicle cycle in cashmere goats
Ma, S., Cao, W., Ma, X., Ye, X., Qin, C., Li, B., Liu, W., Lu, Q., Wu, C., & Fu, X. (2024) · BMC Veterinary Research · doi:10.1186/s12917-024-04057-0 · Cited by 12
Jiang, L., Wan, Y., Anderson, J. C., Hou, J., Islam, S., Cheng, J., & Peck, S. C. (2017) · Journal of Experimental Botany · doi:10.1093/jxb/erx335 · Cited by 12
Agallou, M., Athanasiou, E., Kammona, O., Tastsoglou, S., Hatzigeorgiou, A. G., Kiparissides, C. A., & Karagouni, E. (2019) · Frontiers in Immunology · doi:10.3389/fimmu.2019.02749 · Cited by 12
Gong, L., Liu, Y., Xiong, Y., Li, T., Yin, C., Zhao, J., Yu, J., Yin, Q., Gupta, V. K., Jiang, Y., et al. (2020) · Virulence · doi:10.1080/21505594.2020.1773038 · Cited by 12
Liu, Y., Liu, S., Deng, Y., You, C., Zhang, W., Zhou, J., Chen, X., Gao, L., & Tang, Y. (2020) · Environmental and Experimental Botany · doi:10.1016/j.envexpbot.2020.104207 · Cited by 12
Li, S. Y., Wang, C. Y., Yun, X., Tang, X. B., Yuan, Z., & Bai, Y. Z. (2021) · Frontiers in Genetics · doi:10.3389/fgene.2021.605015 · Cited by 12
Wang, W., Liu, Z., Yue, W., Zhu, L., Zhong, H., Yang, C., He, T., Wan, P., & Geng, J. (2022) · Frontiers in Microbiology · doi:10.3389/fmicb.2022.875238 · Cited by 12
Qing, J., Song, W., Li, C.-Q., & Li, Y. (2022) · Journal of Immunology Research · doi:10.1155/2022/9284204 · Cited by 12
Oxidative Stress Mechanisms Do Not Discriminate between Genotoxic and Nongenotoxic Liver Carcinogens
Deferme, L., Wolters, J. E. J., Claessen, S. M. H., Briedé, J. J., & Kleinjans, J. C. S. (2015) · Chemical Research in Toxicology · doi:10.1021/acs.chemrestox.5b00222 · Cited by 12
Extracting Global System Dynamics of Corticosteroid Genomic Effects in Rat Liver
Yang, E., Almon, R. R., DuBois, D. C., Jusko, W. J., & Androulakis, I. P. (2007) · Journal of Pharmacology and Experimental Therapeutics · doi:10.1124/jpet.107.133074 · Cited by 12
Zheng, W., Men, H., Li, J., Xing, Y., Wu, B., Wang, Z., Li, J., Teng, D., Shi, Y., Li, J., et al. (2016) · PLoS ONE · doi:10.1371/journal.pone.0148677 · Cited by 12
Molecular mechanisms of autophagic memory in pathogenic T cells in human arthritis
Kumar, P., Yao, L. J., Saidin, S., Paleja, B. S., van Loosdregt, J., Chua, C. J. H., Arkachaisri, T., Consolaro, A., Gattorno, M., Martini, A., et al. (2018) · Journal of Autoimmunity · doi:10.1016/j.jaut.2018.07.014 · Cited by 12
Zhang, S., Wang, C., Qin, S., Chen, C., Bao, Y., Zhang, Y., Xu, L., Liu, Q., Zhao, Y., Li, K., et al. (2024) · Genome Research · doi:10.1101/gr.278344.123 · Cited by 13
Pinus massoniana Introgression Hybrids Display Differential Expression of Reproductive Genes
Mo, J., Xu, J., Cao, Y., Yang, L., Yin, T., Hua, H. M., Zhao, H., Guo, Z., Yang, J., & Shi, J. (2019) · Forests · doi:10.3390/f10030230 · Cited by 11
Adjei, M. O., Ma, J., Luo, R., Huang, J., Zhao, Z., Wang, Y., & Gao, A. (2023) · Journal of Plant Interactions · doi:10.1080/17429145.2023.2172226 · Cited by 11
Liang, Z., Wang, X. Q., Zhang, P., Liu, W., Wang, W., & Liu, F. (2023) · Journal of Applied Phycology · doi:10.1007/s10811-023-02921-4 · Cited by 11
Liu, Y., Min, Q., Tang, J., Yang, L., Meng, X., Peng, T., & Jiang, M. (2023) · Frontiers in Veterinary Science · doi:10.3389/fvets.2023.1204706 · Cited by 11
Transcriptome Analysis Reveals the Stress Tolerance Mechanisms of Cadmium in Zoysia japonica
Xu, Y., Li, Y., Li, Y., Zhai, C., & Zhang, K. (2023) · Plants · doi:10.3390/plants12223833 · Cited by 11
Liver transcriptome changes in pearl gentian grouper in response to acute high-temperature stress
Yang, Q.-T., Wu, R., Liang, Y., Niu, S., Miao, B., Liang, Z., & Shen, Y. (2024) · Aquaculture · doi:10.1016/j.aquaculture.2024.741336 · Cited by 11
Tan, J., Xuan, X., Su, S., Jiao, Y., Guo, H., & Zhang, Z. (2024) · BMC Genomics · doi:10.1186/s12864-024-11084-6 · Cited by 11
Chen, Y.-G., Mordes, J. P., Blankenhorn, E. P., Kashmiri, H., Kaldunski, M. L., Jia, S., Geoffrey, R., Wang, X., & Hessner, M. J. (2013) · Genes and Immunity · doi:10.1038/gene.2013.31 · Cited by 11
A temporal precedence based clustering method for gene expression microarray data
Krishna, R., Li, C., & Buchanan‐Wollaston, V. (2010) · BMC Bioinformatics · doi:10.1186/1471-2105-11-68 · Cited by 11
A multi-layer inference approach to reconstruct condition-specific genes and their regulation
Wu, M., Liu, L., Hijazi, H., & Chan, C. (2013) · Bioinformatics · doi:10.1093/bioinformatics/btt186 · Cited by 11
Di, F., Wang, T., Ding, Y., Chen, X., Wang, H., Li, J., & Liu, L. (2020) · DNA and Cell Biology · doi:10.1089/dna.2019.5169 · Cited by 11
Wang, X., Yan, P., Liu, L., Luo, Y., Zhao, L., Liu, H., Tang, Q., Long, K., Jin, L. G., Ma, J., et al. (2020) · Poultry Science · doi:10.1016/j.psj.2020.09.039 · Cited by 11
Global Profiling of lncRNAs Expression Responsive to Allopolyploidization in Cucumis
Wang, P., Yu, X., Zhu, Z., Zhai, Y., Zhao, Q., Meng, Y., Li, J., Lou, Q., & Chen, J. (2020) · Genes · doi:10.3390/genes11121500 · Cited by 11
Xiao, F., Zhao, Y., & Wang, X. (2021) · PeerJ · doi:10.7717/peerj.10933 · Cited by 11
Transcriptome Analysis Reveals the Profile of Long Non-coding RNAs During Chicken Muscle Development
Liu, J., Zhou, Y., Hu, X., Yang, J., Lei, Q., Liu, W., Han, H., Li, F., & Cao, D. (2021) · Frontiers in Physiology · doi:10.3389/fphys.2021.660370 · Cited by 11
Li, B., Chen, S., Wang, C., Chen, Q., Man, C., An, Q., Zhang, Z., Liu, Z., Du, L., & Wang, F. (2021) · PeerJ · doi:10.7717/peerj.11679 · Cited by 11
Qin, B., Xiao, T., Ding, C., Deng, Y., Lv, Z., & Su, J. (2021) · Biology · doi:10.3390/biology10121252 · Cited by 11
Li, X., Wang, Z., Yang, L., Xu, J., & Zhang, Y. (2022) · The Journal of Horticultural Science and Biotechnology · doi:10.1080/14620316.2021.1991848 · Cited by 11
Modular and mechanistic changes across stages of colorectal cancer
Rahiminejad, S., Maurya, M. R., Mukund, K., & Subramaniam, S. (2022) · BMC Cancer · doi:10.1186/s12885-022-09479-3 · Cited by 11
Profiling and Functional Analysis of mRNAs during Skeletal Muscle Differentiation in Goats
Zhan, S., Zhai, H., Tang, M., Xue, Y., Li, D., Wang, L., Zhong, T., Dai, D., Cao, J., Guo, J., et al. (2022) · Animals · doi:10.3390/ani12081048 · Cited by 11
Liang, R., Su, Y., Qin, X., Gao, Z., Fu, Z., HuiJun, Q., Xu, L., & Zhu, J. (2022) · BMC Plant Biology · doi:10.1186/s12870-022-03550-8 · Cited by 11
Metadata
- Authors
- Ernst, J., & Bar-Joseph, Z.
- Affiliations
- Carnegie Mellon University (US)
- Corresponding author
- Ernst, Jason
- ORCID
- Ernst, Jason
- Venue
- BMC Bioinformatics
- Published
- 2006-04-05
- Volume
- 7
- Issue
- 1
- Pages
- 191-191
- ISSN
- 1471-2105 (ISSN-L)
- PMC
- PMC1456994
- OpenAlex
- W2101142880
- Cited by
- 1,703
- References
- 27
- Citations by year
- 2026: 109 · 2025: 116 · 2024: 185 · 2023: 159 · 2022: 220 · 2021: 158 · 2020: 155 · 2019: 114 · 2018: 78 · 2017: 64 · 2016: 71 · 2015: 57 · 2014: 36 · 2013: 30 · 2012: 30
- FWCI
- 9.64
- Type
- journal article
- Language
- en
- Open access
- gold
- doi.org
- Licence
- cc-by
- Locations
- BMC Bioinformatics (publishedVersion, cc-by)
- PubMed Central (publishedVersion)
- PubMed (publishedVersion)
- eScholarship (California Digital Library) (submittedVersion, cc-by)
- DOAJ (DOAJ: Directory of Open Access Journals) (submittedVersion, cc-by-sa)
- eScholarship (California Digital Library) (submittedVersion)
- Funders
- National Science Foundation (0448453, CAREER)
- National Institutes of Health
- National Institute of Allergy and Infectious Diseases (N01 AI-5001, Z01AI005001)
- Topics
- Life Sciences › Biochemistry, Genetics and Molecular Biology › Molecular Biology › Gene expression and cancer classification
- Life Sciences › Biochemistry, Genetics and Molecular Biology › Molecular Biology › Bioinformatics and Genomic Networks
- Life Sciences › Biochemistry, Genetics and Molecular Biology › Molecular Biology › Genomics and Phylogenetic Studies
- Keywords
- time series microarray data, gene expression clustering, time series comparison, gene expression visualization, gene ontology annotation
- MeSH terms
- Computer Simulation, Gene Expression Regulation, Models, Biological, Pattern Recognition, Automated, Software, Time Factors, Transcription Factors, Signal Transduction, Cluster Analysis, Oligonucleotide Array Sequence Analysis, Gene Expression Profiling
About these checks
Registry, retraction, Cites and statistics results are computed, not judged, with one exception: a printed reference that no index lists is read once by a model before it counts as a citation error. Claims are extracted by a model and kept only when their quote appears verbatim in the text; each cited source is then checked, with a model’s help, for whether it says what the claim relies on. Those verdicts can be wrong — read the claim’s quote and the cited source before relying on one.
Statistics and arithmetic are recomputed, not judged.
Confidence bands are shown only for fields calibrated on our annotated test set. None is calibrated yet, so no band is shown.
What counts as a claim ›How we measure confidence ›How we check this ›
Are you an author, or do you see a problem with this page? Request a review
