

The DOI matches its Crossref record; 34 of the 35 references it cites were found in a registry or an index, and 1 are not checked yet.
Effects of dependence in high-dimensional multiple testing problems
Open accessAbstract
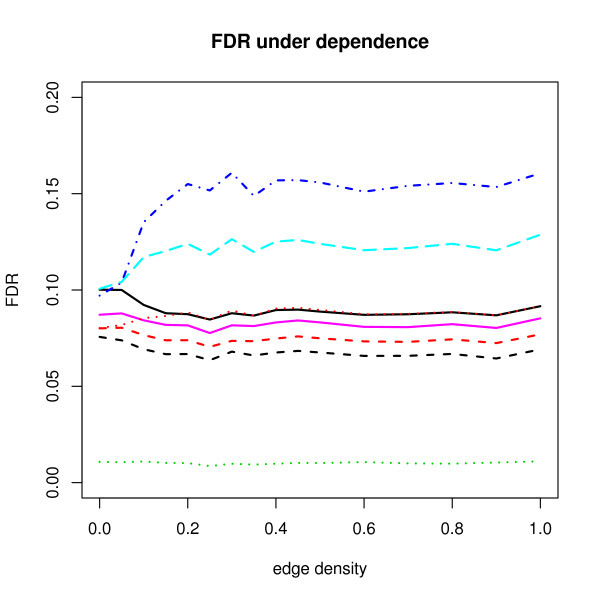
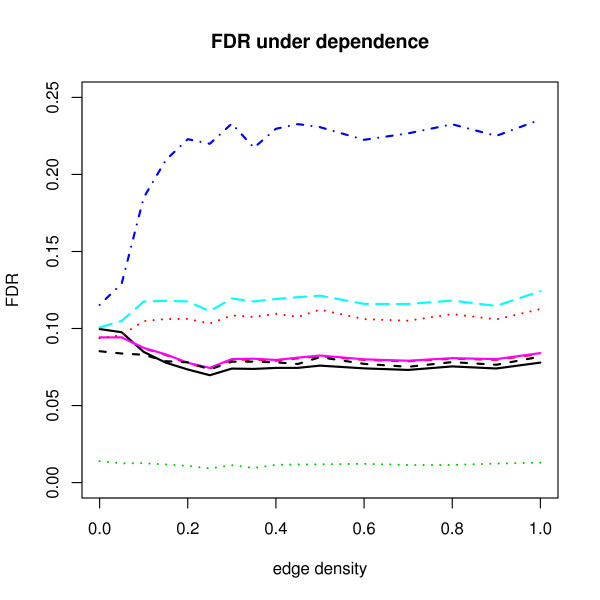
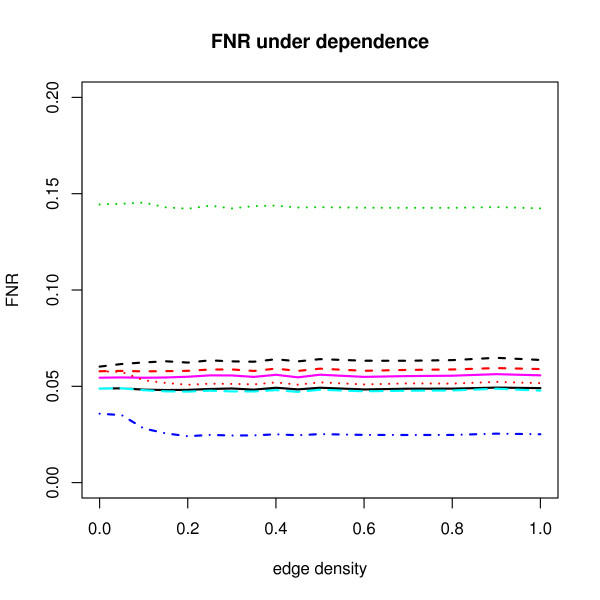
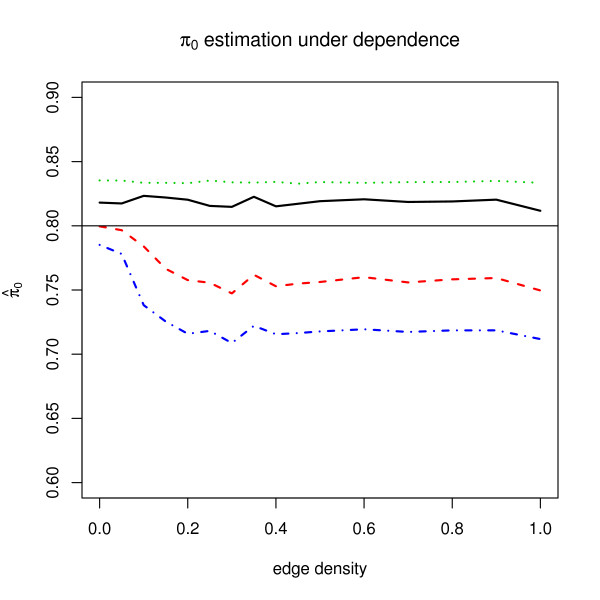
BACKGROUND: We consider effects of dependence among variables of high-dimensional data in multiple hypothesis testing problems, in particular the False Discovery Rate (FDR) control procedures. Recent simulation studies consider only simple correlation structures among variables, which is hardly inspired by real data features. Our aim is to systematically study effects of several network features like sparsity and correlation strength by imposing dependence structures among variables using random correlation matrices. RESULTS: We study the robustness against dependence of several FDR procedures that are popular in microarray studies, such as Benjamin-Hochberg FDR, Storey's q-value, SAM and resampling based FDR procedures. False Non-discovery Rates and estimates of the number of null hypotheses are computed from those methods and compared. Our simulation study shows that methods such as SAM and the q-value do not adequately control the FDR to the level claimed under dependence conditions. On the other hand, the adaptive Benjamini-Hochberg procedure seems to be most robust while remaining conservative. Finally, the estimates of the number of true null hypotheses under various dependence conditions are variable. CONCLUSION: We discuss a new method for efficient guided simulation of dependent data, which satisfy imposed network constraints as conditional independence structures. Our simulation set-up allows for a structural study of the effect of dependencies on multiple testing criterions and is useful for testing a potentially new method on pi0 or FDR estimation in a dependency context.
Overview
The claims and statistics of this paper haven’t been checked yet.
Run the check — free, no account needed. It reads the open-access text and checks the sources it cites.
Integrity signals
Registry
Cites
Statistics
Figures
Verification
Claims the paper makes
The claims and statistics of this paper haven’t been checked yet.
Run the check — free, no account needed. It reads the open-access text and checks the sources it cites.
Claims other papers make about this one
Each is checked against this paper’s own text: does it say what the citing paper says it does?
The source backs part of the claim, not all of it — or backs it for a different population, condition or comparison.
In the citing paper
“FDR correction was chosen as it has been shown to be appropriate and robust for biological data that inherently show dependencies, such as those in the present study [60, 61, 62].”
From Interpersonal Synchronization of Autonomic Physiology via Mere Visual Contact (2026) · cites this paper as [60]
Experimental — accuracy not yet measured
Self-check
Percentages, sums and reported differences re-computed from the paper’s own numbers.
The self-check needs the paper’s full text.
Citations
Cites
Controlling the False Discovery Rate: A Practical and Powerful Approach to Multiple Testing
Benjamini, Y., & Hochberg, Y. (1995) · Journal of the Royal Statistical Society Series B: Statistical Methodology · doi:10.1111/j.2517-6161.1995.tb02031.x · Cited by 109,482 · cited 3×
“[2] first suggest an implementation of FDR by a linear step up approach.”
InfluentialSubramanian, A., Tamayo, P., Mootha, V. K., Mukherjee, S., Ebert, B. L., Gillette, M. A., Paulovich, A., Pomeroy, S. L., Golub, T. R., Lander, E. S., et al. (2005) · Proceedings of the National Academy of Sciences · doi:10.1073/pnas.0506580102 · Cited by 53,625 · cited 3×
“As a data-guided simulation using known gene sets [21,25], we introduce an algorithm for using real data in the Results section.”
Gentleman R: R: A language for data analysis and graphics
Ihaka, R., & Gentleman, R. (1996) · Journal of Computational and Graphical Statistics · doi:10.1080/10618600.1996.10474713 · Cited by 11,747 · cited 2×
“Simulation program We developed R code [32] for this simulation studies.”
In silico prediction of protein-protein interactions in human macrophages
Souiai, O., Guerfali, F. Z., Miled, S. B., Brun, C., & Benkahla, A. (2014) · BMC Research Notes · doi:10.1186/1756-0500-7-157 · Cited by 10,785
Significance analysis of microarrays applied to the ionizing radiation response
Tusher, V. G., Tibshirani, R., & Chu, G. (2001) · Proceedings of the National Academy of Sciences · doi:10.1073/pnas.091062498 · Cited by 10,568
The control of the false discovery rate in multiple testing under dependency
Benjamini, Y., & Yekutieli, D. (2001) · The Annals of Statistics · doi:10.1214/aos/1013699998 · Cited by 10,490 · cited 6×
“The reason behind these phenomena is hard to explain because the implementation of FDR-AME is modified from the algorithms of Yekutieli et al. [12].”
InfluentialStatistical significance for genomewide studies
Storey, J. D., & Tibshirani, R. (2003) · Proceedings of the National Academy of Sciences · doi:10.1073/pnas.1530509100 · Cited by 9,692 · cited 1×
“[19], respectively.”
A Direct Approach to False Discovery Rates
Storey, J. D. (2002) · Journal of the Royal Statistical Society Series B: Statistical Methodology · doi:10.1111/1467-9868.00346 · Cited by 5,603 · cited 6×
“Storey [4] introduces the positive false discovery rate (pFDR) and the q -value. pFDR is known to control error rate under the clumpy dependency condition [5].”
InfluentialR: A Language for Data Analysis and Graphics
Ihaka, R., & Gentleman, R. C. (1996) · Journal of Computational and Graphical Statistics · doi:10.2307/1390807 · Cited by 4,245
Adaptive linear step-up procedures that control the false discovery rate
Benjamini, Y., Krieger, A. M., & Yekutieli, D. (2006) · Biometrika · doi:10.1093/biomet/93.3.491 · Cited by 3,228 · cited 3×
“We found that in all our simulations, the simple adaptive Benjamini-Hochberg procedure [8] is most optimal under dependence, since it achieves relatively high power while remaining conservative.”
Influential
Cited by
Sorted by citations
Items 101–200 of 225
Dror, H., Novak, L., Evans, J. S., López‐Legentil, S., & Shenkar, N. (2018) · Microbial Ecology · doi:10.1007/s00248-018-1276-z · Cited by 21
New procedures controlling the false discovery proportion via Romano–Wolf’s heuristic
Delattre, S., & Roquain, É. (2015) · The Annals of Statistics · doi:10.1214/14-aos1302 · Cited by 21
“…the celebrated paper Benjamini and Hochberg (1995) and is shown to control the expectation of the FDP, called the false discovery rate (FDR), either theoretically under constrained dependency structures (see Benjamini and Yekutieli (2001)), or with simulations (see Kim and van de Wiel (2008)).”
Shakeel, M., Xu, X., Xu, J., et al. (2017) · Scientific Reports · doi:10.1038/s41598-017-11298-7 · Cited by 21
COVID-19 Vaccine Side Effects and Long-Term Neutralizing Antibody Response
Dutcher, E. G., Epel, E. S., Mason, A. E., Hecht, F. M., Robinson, J. E., Drury, S. S., & Prather, A. A. (2024) · Annals of Internal Medicine · doi:10.7326/m23-2956 · Cited by 20
“Ultimately, 126 P values (1 to 4 per model) were drawn from 36 models; these were consolidated and corrected for multiple comparisons using the adaptive Benjamini – Hochberg method with a false discovery rate threshold of 0.05 (21, 22).”
InfluentialAssessment Method for a Power Analysis to Identify Differentially Expressed Pathways
Tripathi, S., & Emmert‐Streib, F. (2012) · PLoS ONE · doi:10.1371/journal.pone.0037510 · Cited by 20
“(1) The algorithm of [38] is based on successive orthogonal projections constraint by the network structure G, resulting in a consistent covariance matrix S.”
MethodYuan, H., Zeng, X., Ling, Z., Wei, Z., Wang, Y., Zhuang, Z., Xu, Q., Tang, Y., & Tashi, N. (2017) · Acta Physiologiae Plantarum · doi:10.1007/s11738-017-2566-7 · Cited by 19
Farahani, R. A., Zhu, X.-Y., Tang, H. J., Jordan, K. L., Lerman, A., Lerman, L. O., & Eirin, A. (2020) · Stem Cells International · doi:10.1155/2020/8845635 · Cited by 19
“Differentially expressed proteins (Lean-EVs versus MetSEVs) were identified, quality confirmed with MaxQuant [38], and differential p values adjusted [39].”
MethodType I error rate control for testing many hypotheses: a survey with proofsPreprint
Roquain, É. (2010) · arXiv (Cornell University) · doi:10.48550/arxiv.1012.4078 · Cited by 19
Zhao, H., Ren, L., Fan, X., Tang, K., & Li, B. (2017) · Acta Physiologiae Plantarum · doi:10.1007/s11738-017-2422-9 · Cited by 18
Large-Scale Simultaneous Inference with Hypothesis Testing: Multiple Testing Procedures in Practice
Emmert‐Streib, F., & Dehmer, M. (2019) · Machine Learning and Knowledge Extraction · doi:10.3390/make1020039 · Cited by 18
Time series graphical lasso and sparse VAR estimation
Dallakyan, A., Kim, R., & Pourahmadi, M. (2022) · Computational Statistics & Data Analysis · doi:10.1016/j.csda.2022.107557 · Cited by 17
Delattre, S., & Roquain, É. (2015) · Bernoulli · doi:10.3150/14-bej659 · Cited by 17
“2007/09/18 file: DR2012-v2.tex date: May 3, 2014 e.g., Farcomeni (2006); Kim and van de Wiel (2008).”
Iglesias, J. M., Leis, O., Ruiz, E. P., Barrie, J. G., Garcia‐García, F., Aduriz, A., Beloqui, I., Hernández-García, S., Lopez-Mato, M. P., Dopazo, J., et al. (2014) · Frontiers in Oncology · doi:10.3389/fonc.2014.00308 · Cited by 18
CMV2b-Dependent Regulation of Host Defense Pathways in the Context of Viral Infection
Zhao, J., Liu, X., Fang, Y., et al. (2018) · Viruses · doi:10.3390/v10110618 · Cited by 17
“The false discovery rate (FDR) was used to correct the diversity test P-value [41].”
MethodZhang, Z., Li, Y., Hu, M., et al. (2020) · Microbial Pathogenesis · doi:10.1016/j.micpath.2020.104098 · Cited by 17
Shin, J., & Im, C. (2020) · Frontiers in Neuroscience · doi:10.3389/fnins.2020.00168 · Cited by 18
Wang, C., Xu, N., & Cui, S. (2021) · PeerJ · doi:10.7717/peerj.10885 · Cited by 17
Estimation of the proportion of true null hypotheses in high-dimensional data under dependence
Friguet, C., & Causeur, D. (2011) · Computational Statistics & Data Analysis · doi:10.1016/j.csda.2011.03.016 · Cited by 17
Koralewski, T. E., Wang, H., Grant, W. E., Brewer, M. J., Elliott, N. C., & Westbrook, J. K. (2021) · Agricultural and Forest Meteorology · doi:10.1016/j.agrformet.2021.108357 · Cited by 16
Rong, X., Cai, Y., Li, M., et al. (2020) · Acta Ophthalmologica · doi:10.1111/aos.14416 · Cited by 15
“When a data set was tested two or more times in independent analyses, Bonferroni correction was used to adjust the p value (Kim & van de Wiel 2008).”
MethodCauseur, D., Friguet, C., Houée-Bigot, M., & Kloareg, M. (2011) · Journal of Statistical Software · doi:10.18637/jss.v040.i14 · Cited by 14
Prevention Focus Relates to Performance on a Loss-Framed Inhibitory Control Task
Files, B. T., Pollard, K. A., Oiknine, A. H., Passaro, A., & Khooshabeh, P. (2018) · Frontiers in Psychology · doi:10.3389/fpsyg.2019.00726 · Cited by 13
Brass, E. P., Peters, M. A., Hinchcliff, K. W., He, Y. D., & Ulrich, R. G. (2009) · Journal of Applied Physiology · doi:10.1152/japplphysiol.91347.2008 · Cited by 14
Li, S., Wu, X., Pei, Y., et al. (2019) · DNA and Cell Biology · doi:10.1089/dna.2019.4880 · Cited by 14
“The t -test was used to calculate p -value, which was subsequently adjusted by the Benjamini–Hochberg (BH) procedure (Kim and van de Wiel, 2008).”
Blasi, V., Zanette, M., Baglio, G., Giangiacomo, A., Tella, S. D., Canevini, M. P., Walder, M., Clerici, M., Baglio, F., & the BIF Group (2020) · Frontiers in Psychology · doi:10.3389/fpsyg.2020.00679 · Cited by 14
Varényiová, Ž., Rojas‐Hernandez, L. S., Spano, J. M., Čapek, V., Rosenberg‐Hasson, Y., Holmes, T. H., & Milla, C. E. (2023) · Scientific Reports · doi:10.1038/s41598-023-41577-5 · Cited by 13
Justen, C., & Herbert, C. (2016) · Frontiers in Human Neuroscience · doi:10.3389/fnhum.2016.00465 · Cited by 13
Characterization of the phosphate-specific transport system inCronobacter sakazakiiBAA-894
Liang, X., Hu, X., Wang, X., et al. (2017) · Journal of Applied Microbiology · doi:10.1111/jam.13524 · Cited by 13
“The significance of the differences in gene transcription was judged by the thresholds of false discovery rate (FDR ≤0 001) and the ratio of gene transcription in the mutant vs the same gene in the control using a logarithmic scale to base 2 (log2 R ≥1) (Kim and van de Wiel 2008).”
MethodLiu, M., Zhang, Z., Ding, C., Wang, T., Kelly, B. L., & Wang, P. (2020) · Frontiers in Cellular and Infection Microbiology · doi:10.3389/fcimb.2020.00256 · Cited by 13
Evolving strategies for global gene expression analysis of cancer
Coe, B. P., Chari, R., Lockwood, W. W., et al. (2008) · Journal of Cellular Physiology · doi:10.1002/jcp.21554 · Cited by 13
New Insights into Clostridia Through Comparative Analyses of Their 40 Genomes
Zhou, C., Ma, Q., Mao, X., et al. (2014) · BioEnergy Research · doi:10.1007/s12155-014-9486-9 · Cited by 12
Microbiota Differences of the Comb Jelly Mnemiopsis leidyi in Native and Invasive Sub-Populations
Jaspers, C., Weiland‐Bräuer, N., Fischer, M. A., Künzel, S., Schmitz, R. A., & Reusch, T. B. H. (2019) · Frontiers in Marine Science · doi:10.3389/fmars.2019.00635 · Cited by 12
Zhang, Y., Chen, S., Deng, Z., Yang, J., & Yuan, J. (2020) · Frontiers in Neuroscience · doi:10.3389/fnins.2020.00201 · Cited by 12
Whole Transcriptome Analysis of Hypertension Induced Cardiac Injury Using Deep Sequencing
Li, T., Li, X., Jia, L., Zhang, J., Zhang, W.-M., Li, Y., Qi, Y., & Du, J. (2016) · Cellular Physiology and Biochemistry · doi:10.1159/000438659 · Cited by 11
Li, S., Dong, Y., Wang, K., Wang, Z., & Zhang, X. (2017) · Journal of Orthopaedic Surgery and Research · doi:10.1186/s13018-017-0664-2 · Cited by 11
“After the t test, the p value was corrected with the Benjamini-Hochberg (BH) algorithm [16].”
MethodZhou, Q., Li, G., Zuo, S., et al. (2019) · BioMed Research International · doi:10.1155/2019/1427871 · Cited by 11
“The false discovery rate (FDR) was applied to set the p-value significance threshold in multiple tests [19] and the fold changes estimated based on the FPKM in each sample.”
Gordon, T., Roth, L., Caicci, F., Manni, L., & Shenkar, N. (2020) · Frontiers in Zoology · doi:10.1186/s12983-020-00365-x · Cited by 11
Plewan, T., & Rinkenauer, G. (2016) · Frontiers in Psychology · doi:10.3389/fpsyg.2016.01939 · Cited by 11
Evans, G. E., Phillipson, G. T. M., Sin, I. L., Frampton, C. M., Kirker, J. A., Bigby, S. M., & Evans, J. J. (2012) · Human Reproduction · doi:10.1093/humrep/des233 · Cited by 10
The Effects of Repeated Dyspnea Exposure on Response Inhibition
Sucec, J., Herzog, M., den Bergh, O. V., Diest, I. V., & von Leupoldt, A. (2019) · Frontiers in Physiology · doi:10.3389/fphys.2019.00663 · Cited by 10
Chapelle, J., Sorokina, O., Mclean, C., Salemme, V., Alfieri, A., Angelini, C., Morellato, A., Adrait, A., Menna, E., Matteoli, M., et al. (2019) · Frontiers in Cell and Developmental Biology · doi:10.3389/fcell.2019.00222 · Cited by 11
Evaluations of FDR-controlling procedures in multiple hypothesis testing
Hwang, Y., Chu, S., & Ou, S.-T. (2010) · Statistics and Computing · doi:10.1007/s11222-010-9193-0 · Cited by 10
Multi-weighting for FDR controlPreprint
Roquain, É., & van de Wiel, M. A. (2008) · arXiv (Cornell University) · Cited by 10
Bai, C., Huang, G., Qi, X., Wang, J., Qiu, L., Wang, L., & Liao, T. (2025) · International Journal of Biological Macromolecules · doi:10.1016/j.ijbiomac.2025.146169 · Cited by 9
Zhao, Z., Chen, C., Adhikari, B. M., Hong, L. E., Kochunov, P., & Chen, S. (2023) · Computational Statistics & Data Analysis · doi:10.1016/j.csda.2023.107765 · Cited by 9
Sørensen, C. K., Labouriau, R., & Hovmøller, M. S. (2017) · Frontiers in Plant Science · doi:10.3389/fpls.2017.00484 · Cited by 9
Vanheusden, F. J., Kegler, M., Ireland, K. H., et al. (2020) · Frontiers in Human Neuroscience · doi:10.3389/fnhum.2020.00109 · Cited by 9
Comparative analysis of false discovery rate methods in constructing metabolic association networks
Koo, I., Yao, S., Zhang, X., et al. (2014) · Journal of Bioinformatics and Computational Biology · doi:10.1142/s0219720014500188 · Cited by 9
“Simulated data—The simulated data are generated based on the two true network topologies such as the scale-free network [19] and the random network [18].”
Fu, Y., Zhu, Z., Chang, H., Liu, Z., Liu, J., & Chen, H. (2016) · Gene · doi:10.1016/j.gene.2016.03.027 · Cited by 9
Luo, W., Qu, Z., Zhang, L., Xie, Y., Luo, F., Tan, Y., Pan, Q., & Zhang, X. (2018) · Vaccine · doi:10.1016/j.vaccine.2018.04.025 · Cited by 9
The Global Response of Cronobacter sakazakii Cells to Amino Acid Deficiency
Chen, S., Zhou, Q., Tan, X., et al. (2018) · Frontiers in Microbiology · doi:10.3389/fmicb.2018.01875 · Cited by 8
“The significance of the differences in gene expression was judged by the thresholds of false discovery rate (FDR ≤ 0.001) and the ratio of gene expression in the M9 medium versus the same gene in the LB medium using a logarithmic scale to base 2 (log2R ≥ 1) (Kim and van de Wiel, 2008).”
InfluentialConnectivity Among Populations of the Top Shell Gibbula divaricata in the Adriatic Sea
López‐Márquez, V., Templado, J., Buckley, D., et al. (2019) · Frontiers in Genetics · doi:10.3389/fgene.2019.00177 · Cited by 8
Tian, Y., Ma, Z., Ma, H., et al. (2020) · Biotechnology & Biotechnological Equipment · doi:10.1080/13102818.2020.1803130 · Cited by 7
A central limit theorem for the Benjamini-Hochberg false discovery proportion under a factor model
Kluger, D. M., & Owen, A. B. (2023) · Bernoulli · doi:10.3150/23-bej1615 · Cited by 7
Evaluations of FWER-controlling methods in multiple hypothesis testing
Hwang, Y., Lai, J.-J., & Ou, S.-T. (2010) · Journal of Applied Statistics · doi:10.1080/02664760903136960 · Cited by 7
Cattle infection response network and its functional modules
Beiki, H., Pakdel, A., Javaremi, A. N., Masoudi‐Nejad, A., & Reecy, J. M. (2018) · BMC Immunology · doi:10.1186/s12865-017-0238-4 · Cited by 7
“The P-values were adjusted using the BenjaminiHochberg procedure [55].”
MethodOnline control of the false discovery rate in biomedical researchPreprint
Robertson, D. S., & Wason, J. M. S. (2018) · arXiv (Cornell University) · doi:10.48550/arxiv.1809.07292 · Cited by 7
Batmanov, K., Delabie, J., & Wang, J. (2019) · Frontiers in Genetics · doi:10.3389/fgene.2019.00282 · Cited by 7
Association of Metabolomics With Incidence of Age-Related Macular Degeneration: The UK Biobank Study
Yu, J. Q., Zhang, Y., Ho, M., Zhang, X. J., Kam, K. W., Young, A. L., Pang, C. P., Tham, C. C. Y., Yam, J. C. S., & Chen, L. J. (2024) · Investigative Ophthalmology & Visual Science · doi:10.1167/iovs.65.14.43 · Cited by 6
“22 This threshold was chosen to reduce the likelihood of false positives given the large number of comparisons.”
Wu, P., Wang, X., Guo, J., et al. (2023) · Scientific Reports · doi:10.1038/s41598-023-34554-5 · Cited by 6
Emmert‐Streib, F., Tripathi, S., & Dehmer, M. (2019) · Frontiers in Applied Mathematics and Statistics · doi:10.3389/fams.2019.00017 · Cited by 6
Parenting Practices and Adolescent Effortful Control: MAOA T941G Gene Polymorphism as a Moderator
Zhao, B., Cao, Y., Zhang, L., & Zhang, W. (2020) · Frontiers in Psychology · doi:10.3389/fpsyg.2020.00060 · Cited by 6
Transcriptional profiling of macrophage and tumor cell interactions in vitro
Roudnicky, F., & Hollmén, M. (2016) · Genomics Data · doi:10.1016/j.gdata.2016.02.009 · Cited by 5
“[2] with a correction for false positive (type I) and false negative (type II) errors using the FDR method [3].”
MethodImproved family-wise error rate control in multiple equivalence testing
Leday, G. G. R., Hemerik, J., Engel, J., et al. (2023) · Food and Chemical Toxicology · doi:10.1016/j.fct.2023.113928 · Cited by 5
Circulating immune signatures across clinical stages of chronic pancreatitis: a pilot study
Hagn-Meincke, R., Hart, P. A., Andersen, D. K., et al. (2023) · European Journal of Gastroenterology & Hepatology · doi:10.1097/meg.0000000000002691 · Cited by 5
“P-values were adjusted for multiple comparisons to control the false discovery rate at 5% [19,20].”
MethodBeiki, H., Murdoch, B. M., Park, C. A., Kern, C., Konetchy, D. E., Becker, G. M., Rincón, G., Jiang, H., Zhou, H., Thorne, J. W., et al. (2024) · GigaScience · doi:10.1093/gigascience/giae019 · Cited by 7
“The resulting P values were corrected for multiple testing by the Benjamini–Hochberg procedure [83].”
InfluentialLi, Y., & Wang, Y. (2017) · Molecular Medicine Reports · doi:10.3892/mmr.2017.7717 · Cited by 5
“Parathyroid hormone-related protein (12-48) is a plasma biomarker that is associated with breast cancer bone metastasis (13).”
Investment styles and the multiple testing of cross-sectional stock return predictability
Vincent, K., Hsu, Y., & Lin, H. W. (2020) · Journal of Financial Markets · doi:10.1016/j.finmar.2020.100598 · Cited by 5
RNAi silencing of the SoxE gene suppresses cell proliferation in silkworm BmN4 cells
Wei, L., Li, Z., Cheng, D., et al. (2014) · Molecular Biology Reports · doi:10.1007/s11033-014-3348-6 · Cited by 5
Mashatola, L., Kader, Z., Abdulla, N., & Kaur, M. (2024) · International Journal of Data Science and Analytics · doi:10.1007/s41060-024-00534-9 · Cited by 4
“It helps control the proportion of false positives among significant findings [49].”
Relationship of Heterologous Virus Responses and Outcomes in Hospitalized COVID-19 Patients
Rosenberg‐Hasson, Y., Holmes, T. H., Diray‐Arce, J., et al. (2023) · The Journal of Immunology · doi:10.4049/jimmunol.2300391 · Cited by 4
A false discovery approach for scanning spatial disease clusters with arbitrary shapes
Li, Y., Shu, L., & Tsung, F. (2016) · IIE Transactions · doi:10.1080/0740817x.2015.1133940 · Cited by 4
“…to the advancement and theoretical development; for example, Benjamini and Liu (1999), Benjamini and Hochberg (2000), Genovese and Wasserman (2002), Owen (2005), Benjamini et al. (2006), Sarkar (2006), Efron (2007), Far-comeni (2007), Kim and van de Wiel (2008), Wu (2008), and Sun and Cai (2009).”
BackgroundHolmes, T. H., & He, X.-S. (2016) · Journal of Immunological Methods · doi:10.1016/j.jim.2016.05.004 · Cited by 4
Hypothesis testing for shapes using vectorized persistence diagrams
Moon, C., & Lazar, N. A. (2023) · Journal of the Royal Statistical Society Series C (Applied Statistics) · doi:10.1093/jrsssc/qlad024 · Cited by 6
Cytokine profiles in patients with toxoplasmic lymphadenitis in the setting of pregnancy
Pomares-Estran, C., Holmes, T. H., Estran, R., et al. (2016) · Cytokine · doi:10.1016/j.cyto.2016.09.021 · Cited by 4
“Within each regression analysis, the false discovery rate was controlled at 5% [20,21], unadjusted p-values are also provided.”
MethodControl of the FWER in Multiple Testing Under Dependence
Causeur, D., Kloareg, M., & Friguet, C. (2009) · Communication in Statistics- Theory and Methods · doi:10.1080/03610910902936281 · Cited by 4
Effects of recombinant Agrocybe aegerita lectin as an immunoadjuvant on immune responses
Ma, L., Xu, B., Huang, M., et al. (2017) · Immunopharmacology and Immunotoxicology · doi:10.1080/08923973.2017.1392561 · Cited by 4
Functional genomics of cattle through integration of multi-omics dataPreprint
Beiki, H., Murdoch, B. M., Park, C. A., Kern, C., Konetchy, D. E., Becker, G. M., Rincón, G., Jiang, H., Zhou, H., Thorne, J. W., et al. (2022) · bioRxiv (Cold Spring Harbor Laboratory) · doi:10.1101/2022.10.05.510963 · Cited by 4
Decoding coffee’s chlorogenic acid: genetic–network pharmacology insights on kidney stones
Hou, X., Meng, H., Ying, D., et al. (2025) · Urolithiasis · doi:10.1007/s00240-025-01776-3 · Cited by 3
“For cases where FDR > 0.05 but P-value 0.05, we regarded the findings as noteworthy [ 20].”
InfluentialLiu, Y., Liu, X., Wang, M., Chen, C., Li, X.-H., Liang, Z., Shan, Y., Yin, Y., Sun, F., Li, Z., et al. (2023) · Frontiers in Nutrition · doi:10.3389/fnut.2023.1121734 · Cited by 3
“Based on the detection method of differentially expressed genes (DEGs) as previously reported (36), a strict in-house algorithm was developed to screen the DEGs of miRNAs between two samples with the multiple hypothesis test corrections set up (37) to determine the domain value of p by controlling the false discovery…”
MethodInfluentialZhang, S., Shan, T., Xu, J., et al. (2023) · Physiologia Plantarum · doi:10.1111/ppl.14010 · Cited by 3
Decreased levels and function of dendritic cells in blood and airways predict COVID ‐19 severity
Österberg, B., Falck‐Jones, S., Vangeti, S., Åhlberg, E., Yu, M., Granja, D., Snik, M. E., Falck‐Jones, R., Barros, G. W. F., Charles, A., et al. (2025) · Clinical & Translational Immunology · doi:10.1002/cti2.70026 · Cited by 4
GDNF triggers proliferation of rat C6 glioma cells via the NF-κB/CXCL1 signaling pathway
Wang, Y., Wu, Y., Li, L., et al. (2023) · PLoS ONE · doi:10.1371/journal.pone.0289071 · Cited by 3
Ugale, S. S., Holmes, T. H., Maysel-Auslender, S., Boyd, S. D., Dekker, C. L., Davis, M. M., & Maecker, H. T. (2023) · ImmunoHorizons · doi:10.4049/immunohorizons.2300050 · Cited by 3
Ferreira, J. A., & van de Wiel, M. A. (2008) · Test · doi:10.1007/s11749-008-0127-5 · Cited by 3
Zhao, L., Shan, C., Shan, T., et al. (2022) · Gene · doi:10.1016/j.gene.2022.146579 · Cited by 3
Physiological and Transcriptomic Analysis of Two Types of Hami Melons in Low-Temperature Storage
Liao, W., Xiao, L., Hao, X., et al. (2025) · Plants · doi:10.3390/plants14081153 · Cited by 2
“Dissociation curve analysis was performed as follows: 15 s at 95 ◦ C, 1 min at 60 ◦ C, 15 s at 95 ◦ C, and 30 s at 50 ◦ C. Amplification was carried out in a 96-well plate, and the SybrGreen signal was detected at the end of each extension step at 60 ◦ C in each cycle.”
Zhang, D., Zhang, X., Li, H., Liang, A., Liang, Y., Wang, Z., Shi, S., Ge, Y., Gao, W., & Liu, X. (2025) · International Dental Journal · doi:10.1016/j.identj.2025.109341 · Cited by 2
“31 Power analyses indicated that most correlations between GCDH and HNC exceeded 90%, supporting that the null findings are biologically driven rather than due to insufficient power.”
Sarkar, S. K., & Zhang, S. (2024) · Journal of Statistical Planning and Inference · doi:10.1016/j.jspi.2024.106238 · Cited by 2
Cohen, A. A., Bowman, R., Boughton, R. K., et al. (2012) · Canadian Journal of Zoology · doi:10.1139/cjz-2012-0243 · Cited by 2
Trutschel, D., Schmidt, S., Große, I., et al. (2015) · Frontiers in Bioengineering and Biotechnology · doi:10.3389/fbioe.2015.00129 · Cited by 2
A general approach to account for dependence in large-scale multiple testing
Friguet, C. (2012) · HAL · Cited by 2
Azuero, A., Redden, D. T., Tiwari, H. K., et al. (2011) · Communications in Statistics - Simulation and Computation · doi:10.1080/03610918.2011.579368 · Cited by 2
ChunTai, W. (2018) · Journal of Oil Palm Research · doi:10.21894/jopr.2018.0001 · Cited by 2
“A false discovery rate analysis was performed according to the procedure developed by Kim and van de Wiel (2008).”
MethodOn k-FWE-based critical values for controlling the false discovery proportion under dependencePreprint
Delattre, S., & Roquain, É. (2013) · arXiv (Cornell University) · Cited by 2
Prei, K., Kanig, C., Osnabruegge, M., Langguth, B., Mack, W., Abdelnaim, M. A., Schecklmann, M., & Schoisswohl, S. (2023) · medRxiv · doi:10.1101/2023.01.24.23284951 · Cited by 2
Yilmaz, G., Singha, S. K., Savaliya, B., et al. (2026) · American Journal of Physiology-Renal Physiology · doi:10.1152/ajprenal.00266.2025 · Cited by 1
Introduction to Statistical Methods for Complex Systems
Mary‐Huard, T., & Robin, S. S. (2011) · doi:10.1002/9781119970606.ch2 · Cited by 1
Paranagama, D. C. (2011) · K-State Research Exchange (Kansas State University) · Cited by 1
Phenome-wide HLA association landscape of 235,000 Finnish biobank participantsPreprint
Ritari, J., Koskela, S., Hyvärinen, K., et al. (2020) · medRxiv · doi:10.1101/2020.10.26.20219899 · Cited by 1
Metadata
- Authors
- Kim, K. I., & van de Wiel, M. A.
- Affiliations
- Eindhoven University of Technology (NL)
- Corresponding author
- Kim, Kyung In
- Venue
- BMC Bioinformatics
- Published
- 2008-02-25
- Volume
- 9
- Issue
- 1
- Pages
- 114-114
- ISSN
- 1471-2105 (ISSN-L)
- PMC
- PMC2375137
- OpenAlex
- W2116319049
- Cited by
- 220
- References
- 34
- Citations by year
- 2026: 3 · 2025: 5 · 2024: 6 · 2023: 15 · 2022: 11 · 2021: 13 · 2020: 29 · 2019: 33 · 2018: 15 · 2017: 19 · 2016: 14 · 2015: 10 · 2014: 14 · 2013: 5 · 2012: 5
- FWCI
- 7.24
- Type
- journal article
- Language
- en
- Open access
- gold
- doi.org
- Licence
- Locations
- BMC Bioinformatics (publishedVersion, cc-by)
- PubMed Central (publishedVersion, cc-by)
- PubMed (publishedVersion)
- Amsterdam UMC (VU Amsterdam) - Institutional Repository (publishedVersion, other-oa)
- TU/e Research Portal (publishedVersion, other-oa)
- Pure Amsterdam UMC (submittedVersion, other-oa)
- TU/e Research Portal (submittedVersion, other-oa)
- TU/e Research Portal (submittedVersion)
- DOAJ (DOAJ: Directory of Open Access Journals) (submittedVersion)
- VU Research Portal (submittedVersion, other-oa)
- Data Archiving and Networked Services (DANS) (submittedVersion, other-oa)
- Topics
- Physical Sciences › Mathematics › Statistics and Probability › Statistical Methods in Clinical Trials
- Life Sciences › Biochemistry, Genetics and Molecular Biology › Molecular Biology › Gene expression and cancer classification
- Physical Sciences › Mathematics › Statistics and Probability › Statistical Methods and Inference
- Keywords
- multiple comparisons, false discovery rate, high-dimensional data, microarray data, conditional independence structure, sparsity
- MeSH terms
- Algorithms, Sensitivity and Specificity, Statistics as Topic, Reproducibility of Results, Artifacts, Oligonucleotide Array Sequence Analysis, Gene Expression Profiling
About these checks
Registry, retraction, Cites and statistics results are computed, not judged, with one exception: a printed reference that no index lists is read once by a model before it counts as a citation error. Claims are extracted by a model and kept only when their quote appears verbatim in the text; each cited source is then checked, with a model’s help, for whether it says what the claim relies on. Those verdicts can be wrong — read the claim’s quote and the cited source before relying on one.
Statistics and arithmetic are recomputed, not judged.
Confidence bands are shown only for fields calibrated on our annotated test set. None is calibrated yet, so no band is shown.
What counts as a claim ›How we measure confidence ›How we check this ›
Are you an author, or do you see a problem with this page? Request a review
