

The DOI matches its Crossref record; 34 of the 35 references it cites were found in a registry or an index, and 1 are not checked yet.
Effects of dependence in high-dimensional multiple testing problems
Open accessAbstract
BACKGROUND: We consider effects of dependence among variables of high-dimensional data in multiple hypothesis testing problems, in particular the False Discovery Rate (FDR) control procedures. Recent simulation studies consider only simple correlation structures among variables, which is hardly inspired by real data features. Our aim is to systematically study effects of several network features like sparsity and correlation strength by imposing dependence structures among variables using random correlation matrices. RESULTS: We study the robustness against dependence of several FDR procedures that are popular in microarray studies, such as Benjamin-Hochberg FDR, Storey's q-value, SAM and resampling based FDR procedures. False Non-discovery Rates and estimates of the number of null hypotheses are computed from those methods and compared. Our simulation study shows that methods such as SAM and the q-value do not adequately control the FDR to the level claimed under dependence conditions. On the other hand, the adaptive Benjamini-Hochberg procedure seems to be most robust while remaining conservative. Finally, the estimates of the number of true null hypotheses under various dependence conditions are variable. CONCLUSION: We discuss a new method for efficient guided simulation of dependent data, which satisfy imposed network constraints as conditional independence structures. Our simulation set-up allows for a structural study of the effect of dependencies on multiple testing criterions and is useful for testing a potentially new method on pi0 or FDR estimation in a dependency context.
Overview
The claims and statistics of this paper haven’t been checked yet.
Run the check — free, no account needed. It reads the open-access text and checks the sources it cites.
Integrity signals
Registry
Cites
Statistics
Figures
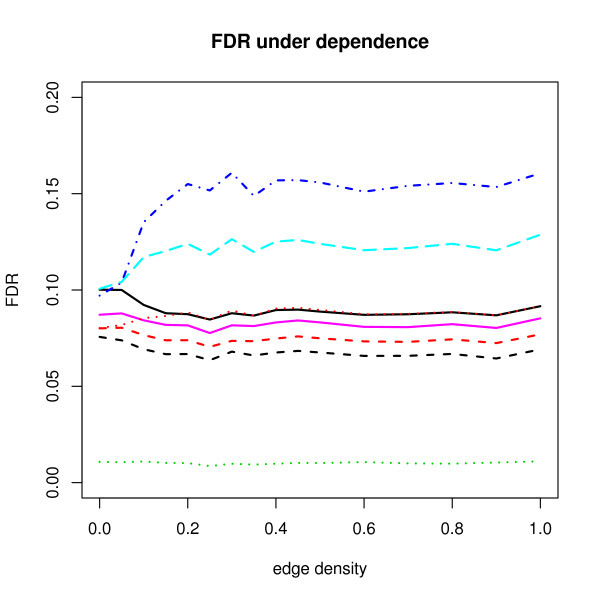
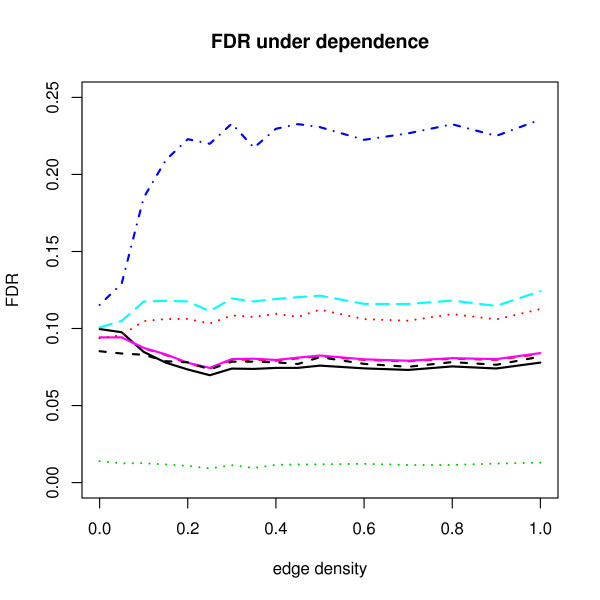
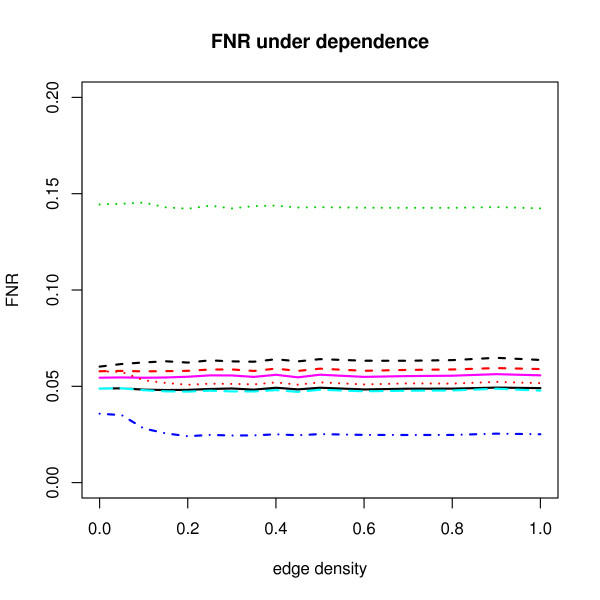
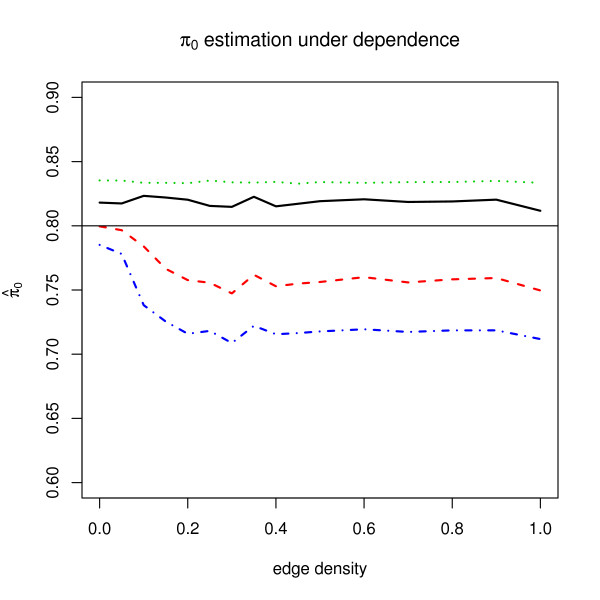
Verification
Claims the paper makes
The claims and statistics of this paper haven’t been checked yet.
Run the check — free, no account needed. It reads the open-access text and checks the sources it cites.
Claims other papers make about this one
Each is checked against this paper’s own text: does it say what the citing paper says it does?
The source backs part of the claim, not all of it — or backs it for a different population, condition or comparison.
In the citing paper
“FDR correction was chosen as it has been shown to be appropriate and robust for biological data that inherently show dependencies, such as those in the present study [60, 61, 62].”
From Interpersonal Synchronization of Autonomic Physiology via Mere Visual Contact (2026) · cites this paper as [60]
Experimental — accuracy not yet measured
Self-check
Percentages, sums and reported differences re-computed from the paper’s own numbers.
The self-check needs the paper’s full text.
Citations
Cites
Controlling the False Discovery Rate: A Practical and Powerful Approach to Multiple Testing
Benjamini, Y., & Hochberg, Y. (1995) · Journal of the Royal Statistical Society Series B: Statistical Methodology · doi:10.1111/j.2517-6161.1995.tb02031.x · Cited by 109,482 · cited 3×
“[2] first suggest an implementation of FDR by a linear step up approach.”
InfluentialSubramanian, A., Tamayo, P., Mootha, V. K., Mukherjee, S., Ebert, B. L., Gillette, M. A., Paulovich, A., Pomeroy, S. L., Golub, T. R., Lander, E. S., et al. (2005) · Proceedings of the National Academy of Sciences · doi:10.1073/pnas.0506580102 · Cited by 53,625 · cited 3×
“As a data-guided simulation using known gene sets [21,25], we introduce an algorithm for using real data in the Results section.”
Gentleman R: R: A language for data analysis and graphics
Ihaka, R., & Gentleman, R. (1996) · Journal of Computational and Graphical Statistics · doi:10.1080/10618600.1996.10474713 · Cited by 11,747 · cited 2×
“Simulation program We developed R code [32] for this simulation studies.”
In silico prediction of protein-protein interactions in human macrophages
Souiai, O., Guerfali, F. Z., Miled, S. B., Brun, C., & Benkahla, A. (2014) · BMC Research Notes · doi:10.1186/1756-0500-7-157 · Cited by 10,785
Significance analysis of microarrays applied to the ionizing radiation response
Tusher, V. G., Tibshirani, R., & Chu, G. (2001) · Proceedings of the National Academy of Sciences · doi:10.1073/pnas.091062498 · Cited by 10,568
The control of the false discovery rate in multiple testing under dependency
Benjamini, Y., & Yekutieli, D. (2001) · The Annals of Statistics · doi:10.1214/aos/1013699998 · Cited by 10,490 · cited 6×
“The reason behind these phenomena is hard to explain because the implementation of FDR-AME is modified from the algorithms of Yekutieli et al. [12].”
InfluentialStatistical significance for genomewide studies
Storey, J. D., & Tibshirani, R. (2003) · Proceedings of the National Academy of Sciences · doi:10.1073/pnas.1530509100 · Cited by 9,692 · cited 1×
“[19], respectively.”
A Direct Approach to False Discovery Rates
Storey, J. D. (2002) · Journal of the Royal Statistical Society Series B: Statistical Methodology · doi:10.1111/1467-9868.00346 · Cited by 5,603 · cited 6×
“Storey [4] introduces the positive false discovery rate (pFDR) and the q -value. pFDR is known to control error rate under the clumpy dependency condition [5].”
InfluentialR: A Language for Data Analysis and Graphics
Ihaka, R., & Gentleman, R. C. (1996) · Journal of Computational and Graphical Statistics · doi:10.2307/1390807 · Cited by 4,245
Adaptive linear step-up procedures that control the false discovery rate
Benjamini, Y., Krieger, A. M., & Yekutieli, D. (2006) · Biometrika · doi:10.1093/biomet/93.3.491 · Cited by 3,228 · cited 3×
“We found that in all our simulations, the simple adaptive Benjamini-Hochberg procedure [8] is most optimal under dependence, since it achieves relatively high power while remaining conservative.”
Influential
Cited by
Sorted by citations
Items 201–225 of 225
Interpersonal Synchronization of Autonomic Physiology via Mere Visual Contact
Koul, A., & Novembre, G. (2026) · Annals of the New York Academy of Sciences · doi:10.1111/nyas.70322 · Cited by 1
“FDR correction was chosen as it has been shown to be appropriate and robust for biological data that inherently show dependencies, such as those in the present study [ 60–62 ].”
Xin, L. (2021) · ScholarWorks@UMassAmherst (University of Massachusetts Amherst) · doi:10.7275/6955133.0
False discovery rate procedures for high-dimensional data
Kim, K. K. I. (2008) · TU/e Research Portal · doi:10.6100/ir637929
Self-citationSubgrouping Chronic Fatigue Syndrome Patients by Genetic and Immune Profiling
Montoya, J. G., Valencia, I. J., Maecker, H. T., et al. (2014) · doi:10.21236/ada608724
Simultaneous likelihood-based bootstrap confidence sets for a large number of modelsPreprint
Zhilova, M. (2015) · arXiv (Cornell University) · doi:10.18452/4583
Xie, X.-P., Xie, Y., & Wang, H. (2017) · BMC Bioinformatics · doi:10.1186/s12859-017-1794-6
“To control false positive rates (FPR), the resulted p -values were corrected using the Benjamini-Hochberg (BH) procedure [22, 23].”
MethodInfluentialIs There a Cigarette Catch-Up Effect for Biracial Black Youth?
Goings, T. C., Hidalgo, S. J. T., & Gilreath, T. D. (2019) · Journal of Child & Adolescent Substance Abuse · doi:10.1080/1067828x.2020.1714525
EEG beta-band spectral entropy predicts the effects of drug treatment on patients with herpes zosterPreprint
Wei, M., Liao, Y., Liu, J., et al. (2019) · Research Square · doi:10.21203/rs.2.9483/v1
Dong, H., Ye, Y., Guo, Y., et al. (2020) · doi:10.21203/rs.3.rs-16278/v1
Li, D., Ma, X., & Ou, S. (2022) · Advances in Medical Sciences · doi:10.1016/j.advms.2022.08.004
Bi, Y., Qiao, X., Liu, Q., Song, S., Zhu, K., Qiu, X., Zhang, X., jia, C., Wang, H., Yang, Z., et al. (2022) · Figshare · doi:10.6084/m9.figshare.20968110
Bi, Y., Qiao, X., Liu, Q., Song, S., Zhu, K., Qiu, X., Zhang, X., jia, C., Wang, H., Yang, Z., et al. (2022) · Figshare · doi:10.6084/m9.figshare.20968107
Bi, Y., Qiao, X., Liu, Q., Song, S., Zhu, K., Qiu, X., Zhang, X., jia, C., Wang, H., Yang, Z., et al. (2022) · Figshare · doi:10.6084/m9.figshare.20968101
Bi, Y., Qiao, X., Liu, Q., Song, S., Zhu, K., Qiu, X., Zhang, X., jia, C., Wang, H., Yang, Z., et al. (2022) · Figshare · doi:10.6084/m9.figshare.20968104
Bi, Y., Qiao, X., Liu, Q., Song, S., Zhu, K., Qiu, X., Zhang, X., jia, C., Wang, H., Yang, Z., et al. (2022) · Figshare · doi:10.6084/m9.figshare.20968098
Dong, H., Ye, Y., Guo, Y., et al. (2020) · Figshare · doi:10.6084/m9.figshare.13226143
Statistical Contrastive Learning for Spatio-Temporal Anomaly Detection
Zhen, Z., Chen, Y., & Gel, Y. R. (2026) · Data Science in Science · doi:10.1080/26941899.2026.2648108
Yanli, C., Lu, H., Yang, S.-E., et al. (2026) · Computers and Electronics in Agriculture · doi:10.1016/j.compag.2026.112254
Metadata
- Authors
- Kim, K. I., & van de Wiel, M. A.
- Affiliations
- Eindhoven University of Technology (NL)
- Corresponding author
- Kim, Kyung In
- Venue
- BMC Bioinformatics
- Published
- 2008-02-25
- Volume
- 9
- Issue
- 1
- Pages
- 114-114
- ISSN
- 1471-2105 (ISSN-L)
- PMC
- PMC2375137
- OpenAlex
- W2116319049
- Cited by
- 220
- References
- 34
- Citations by year
- 2026: 3 · 2025: 5 · 2024: 6 · 2023: 15 · 2022: 11 · 2021: 13 · 2020: 29 · 2019: 33 · 2018: 15 · 2017: 19 · 2016: 14 · 2015: 10 · 2014: 14 · 2013: 5 · 2012: 5
- FWCI
- 7.24
- Type
- journal article
- Language
- en
- Open access
- gold
- doi.org
- Licence
- Locations
- BMC Bioinformatics (publishedVersion, cc-by)
- PubMed Central (publishedVersion, cc-by)
- PubMed (publishedVersion)
- Amsterdam UMC (VU Amsterdam) - Institutional Repository (publishedVersion, other-oa)
- TU/e Research Portal (publishedVersion, other-oa)
- Pure Amsterdam UMC (submittedVersion, other-oa)
- TU/e Research Portal (submittedVersion, other-oa)
- TU/e Research Portal (submittedVersion)
- DOAJ (DOAJ: Directory of Open Access Journals) (submittedVersion)
- VU Research Portal (submittedVersion, other-oa)
- Data Archiving and Networked Services (DANS) (submittedVersion, other-oa)
- Topics
- Physical Sciences › Mathematics › Statistics and Probability › Statistical Methods in Clinical Trials
- Life Sciences › Biochemistry, Genetics and Molecular Biology › Molecular Biology › Gene expression and cancer classification
- Physical Sciences › Mathematics › Statistics and Probability › Statistical Methods and Inference
- Keywords
- multiple comparisons, false discovery rate, high-dimensional data, microarray data, conditional independence structure, sparsity
- MeSH terms
- Algorithms, Sensitivity and Specificity, Statistics as Topic, Reproducibility of Results, Artifacts, Oligonucleotide Array Sequence Analysis, Gene Expression Profiling
About these checks
Registry, retraction, Cites and statistics results are computed, not judged, with one exception: a printed reference that no index lists is read once by a model before it counts as a citation error. Claims are extracted by a model and kept only when their quote appears verbatim in the text; each cited source is then checked, with a model’s help, for whether it says what the claim relies on. Those verdicts can be wrong — read the claim’s quote and the cited source before relying on one.
Statistics and arithmetic are recomputed, not judged.
Confidence bands are shown only for fields calibrated on our annotated test set. None is calibrated yet, so no band is shown.
What counts as a claim ›How we measure confidence ›How we check this ›
Are you an author, or do you see a problem with this page? Request a review
