

The DOI matches its Crossref record; 11 of the 11 references it cites were found in a registry or an index.
Acetylated microtubules are required for fusion of autophagosomes with lysosomes
Abstract
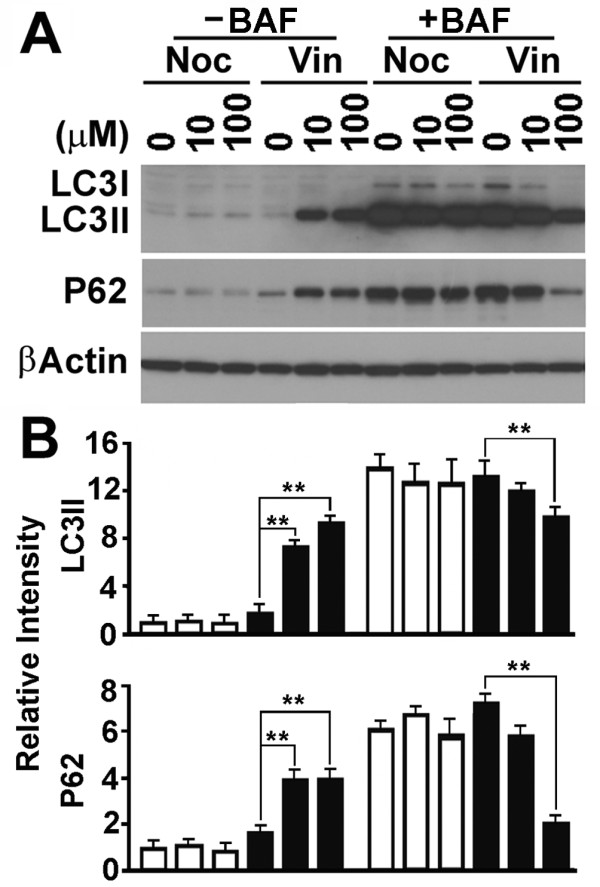
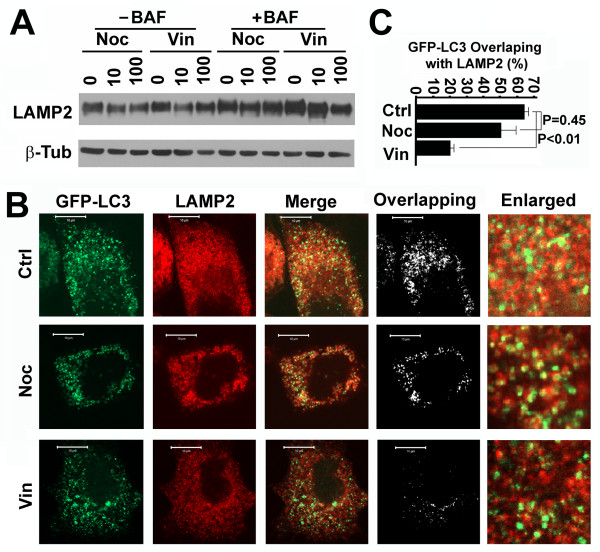
Background: Autophagy is a dynamic process during which isolation membranes package substrates to form autophagosomes that are fused with lysosomes to form autolysosomes for degradation. Although it is agreed that the LC3II-associated mature autophagosomes move along microtubular tracks, it is still in dispute if the conversion of LC3I to LC3II before autophagosomes are fully mature and subsequent fusion of mature autophagosomes with lysosomes require microtubules. Results: We use biochemical markers of autophagy and a collection of microtubule interfering reagents to test the question. Results show that interruption of microtubules with either microtubule stabilizing paclitaxel or destabilizing nocodazole similarly impairs the conversion of LC3I to LC3II, but does not block the degradation of LC3II-associated autophagosomes. Acetylation of microtubules renders them resistant to nocodazole treatment. Treatment with vinblastine that causes depolymerization of both non-acetylated and acetylated microtubules results in impairment of both LC3I-LC3II conversion and LC3II-associated autophagosome fusion with lysosomes. Conclusions: Acetylated microtubules are required for fusion of autophagosomes with lysosomes to form autolysosomes.
Overview
The claims and statistics of this paper haven’t been checked yet.
Run the check — free, no account needed. It reads the open-access text and checks the sources it cites.
Integrity signals
Registry
Cites
Statistics
Figures
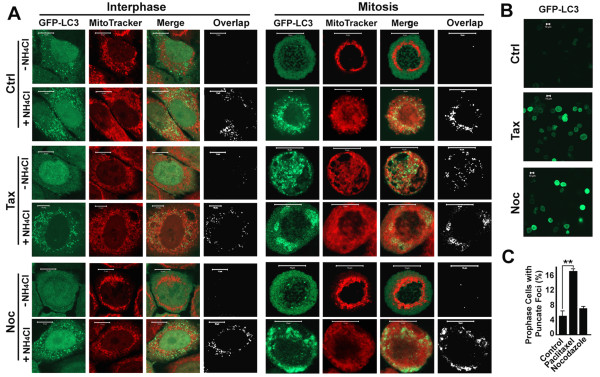
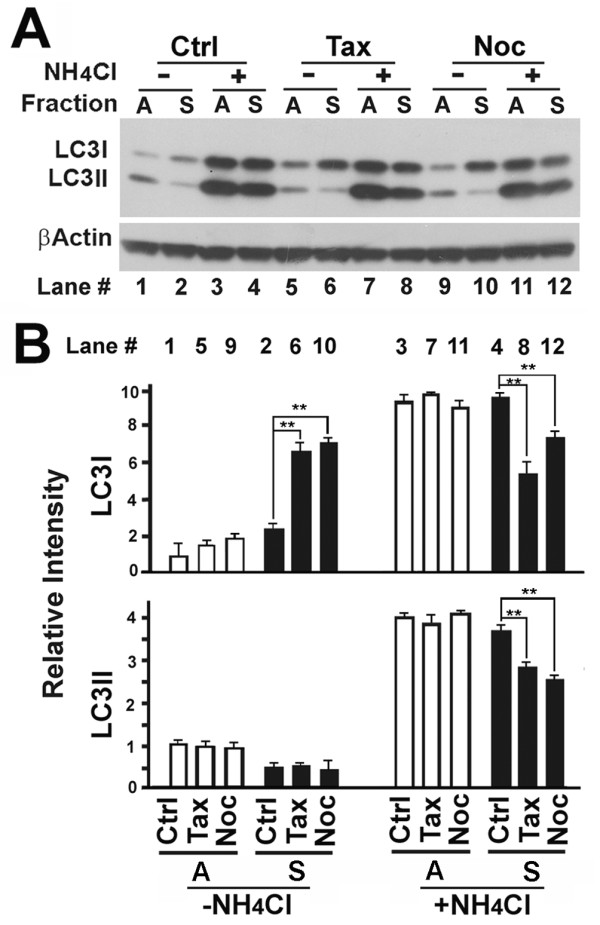
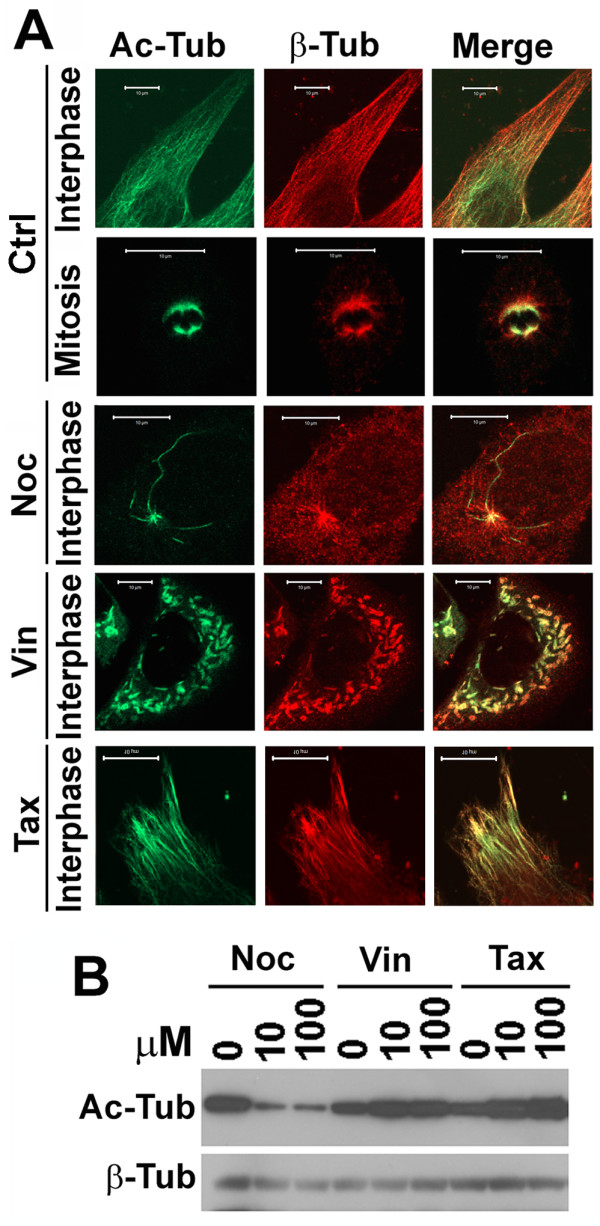
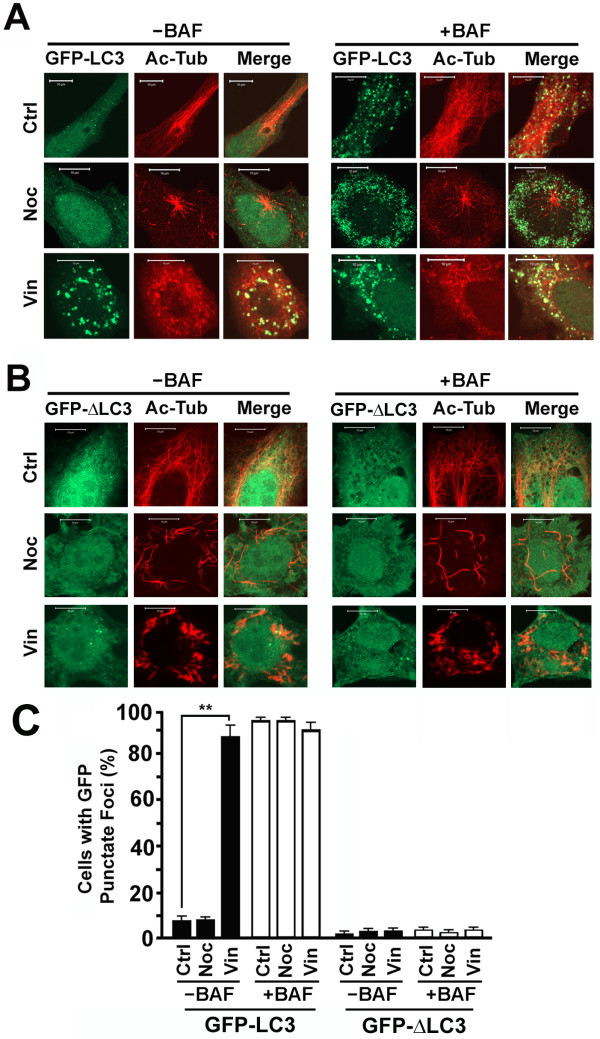
Verification
Claims the paper makes
The claims and statistics of this paper haven’t been checked yet.
Run the check — free, no account needed. It reads the open-access text and checks the sources it cites.
Claims other papers make about this one
Each is checked against this paper’s own text: does it say what the citing paper says it does?
The check wasn’t confident either way, so it gives no verdict — never disputed.
In the citing paper
“note that chloroquine blocks autophagy predominantly by inhibiting autophagosome-lysosome fusion [304]”
From Guidelines for the use and interpretation of assays for monitoring autophagy (4th edition) 1 (2021) · cites this paper as [304]
Experimental — accuracy not yet measured
Self-check
Percentages, sums and reported differences re-computed from the paper’s own numbers.
The self-check needs the paper’s full text.
Citations
Cites
LC3, a mammalian homologue of yeast Apg8p, is localized in autophagosome membranes after processing.
Kabeya, Y., Mizushima, N., Ueno, T., Yamamoto, A., Kirisako, T., Noda, T., Kominami, E., Ohsumi, Y., & Yoshimori, T. (2000) · The EMBO Journal · doi:10.1093/emboj/19.21.5720 · Cited by 6,605
Apoptosis in the Pathogenesis and Treatment of Disease
Thompson, C. B. (1995) · Science · doi:10.1126/science.7878464 · Cited by 6,524
Selective degradation of mitochondria by mitophagy
Kim, I., Rodriguez-Enriquez, S., & Lemasters, J. J. (2007) · Archives of Biochemistry and Biophysics · doi:10.1016/j.abb.2007.03.034 · Cited by 1,558
The Atg12-Atg5 Conjugate Has a Novel E3-like Activity for Protein Lipidation in Autophagy
Hanada, T., Noda, N. N., Satomi, Y., Ichimura, Y., Fujioka, Y., Takao, T., Inagaki, F., & Ohsumi, Y. (2007) · Journal of Biological Chemistry · doi:10.1074/jbc.c700195200 · Cited by 1,123 · cited 2×
“The LC3 precursor is truncated to LC3I then conjugated with phosphatidylethanolamine to membrane-associated LC3II mediated by the ATG5-ATG12 conjugate [4,5].”
BackgroundMicrotubules containing acetylated alpha-tubulin in mammalian cells in culture.
Piperno, G., LeDizet, M., & Chang, X. J. (1987) · The Journal of cell biology · doi:10.1083/jcb.104.2.289 · Cited by 873
In vivo destabilization of dynamic microtubules by HDAC6‐mediated deacetylation
Matsuyama, A., Shimazu, T., Sumida, Y., Saito, A., Yoshimatsu, Y., Seigneurin‐Berny, D., Osada, H., Komatsu, Y., Nishino, N., Khochbin, S., et al. (2002) · The EMBO Journal · doi:10.1093/emboj/cdf682 · Cited by 720
HDAC6 and microtubules are required for autophagic degradation of aggregated huntingtin.
Iwata, A., Riley, B. E., Johnston, J. A., & Kopito, R. R. (2005) · Journal of Biological Chemistry · doi:10.1074/jbc.m508786200 · Cited by 719
Kuma, A., Matsui, M., & Mizushima, N. (2007) · Autophagy · doi:10.4161/auto.4012 · Cited by 555 · cited 2×
“Caution is required to interpret the results from immunoblot since the LC3 levels are dynamically altered [8].”
Backgroundp62/SQSTM1: A Missing Link between Protein Aggregates and the Autophagy Machinery
Bjørkøy, G., Lamark, T., & Johansen, T. (2006) · Autophagy · doi:10.4161/auto.2.2.2405 · Cited by 322
Induction of Autophagy in Axonal Dystrophy and Degeneration
Wang, Q. J., Ding, Y., Kohtz, S., Mizushima, N., Cristea, I. M., Rout, M. P., Chait, B. T., Zhong, Y., Heintz, N., & Yue, Z. (2006) · The Journal of Neuroscience · doi:10.1523/jneurosci.2261-06.2006 · Cited by 308
Fass, E., Shvets, E., Degani, I., Hirschberg, K., & Elazar, Z. (2006) · Journal of Biological Chemistry · doi:10.1074/jbc.m607031200 · Cited by 286
Research works printed but not linked: 29
- Schoenfeld TA, McKerracher L, Obar R, Vallee RB: MAP 1A and MAP 1B are structurally related microtubule associated proteins with distinct developmental patterns in the CNS. J Neurosci. 1989, 9 (5): 1712-1730. · DOI
- Tanida I, Ueno T, Kominami E: LC3 conjugation system in mammalian autophagy. Int J Biochem Cell Biol. 2004, 36 (12): 2503-2518. 10.1016/j.biocel.2004.05.009. · DOI
- Mizushima N, Klionsky DJ: Protein turnover via autophagy: implications for metabolism. Annu Rev Nutr. 2007, 27: 19-40. 10.1146/annurev.nutr.27.061406.093749. · DOI
- Liu L, Xie R, Nguyen S, Ye M, McKeehan WL: Robust autophagy/mitophagy persists during mitosis. Cell Cycle. 2009, 8 (10): 1616-1620. 10.4161/cc.8.10.8577. · DOI
- Mousavi SA, Kjeken R, Berg TO, Seglen PO, Berg T, Brech A: Effects of inhibitors of the vacuolar proton pump on hepatic heterophagy and autophagy. Bioch Biophys Acta. 2001, 1510 (1-2): 243-257. 10.1016/S0005-2736(00)00354-0. · DOI
- Perry CN, Kyoi S, Hariharan N, Takagi H, Sadoshima J, Gottlieb RA: Novel methods for measuring cardiac autophagy in vivo. Method Enzymol. 2009, 453: 325-342. full_text. · DOI
- Heald R, Nogales E: Microtubule dynamics. J Cell Sci. 2002, 115 (Pt 1): 3-4. · DOI
- Nogales E: Structural insight into microtubule function. Annu Rev Biophys Biomol Struct. 2001, 30: 397-420. 10.1146/annurev.biophys.30.1.397. · DOI
- Desai A, Mitchison TJ: Microtubule polymerization dynamics. Annu Rev Cell Dev Biol. 1997, 13: 83-117. 10.1146/annurev.cellbio.13.1.83. · DOI
- Downing KH: Structural basis for the interaction of tubulin with proteins and drugs that affect microtubule dynamics. Annu Rev Cell Dev Biol. 2000, 16: 89-111. 10.1146/annurev.cellbio.16.1.89. · DOI
- Straight AF, Field CM: Microtubules, membranes and cytokinesis. Curr Biol. 2000, 10 (20): R760-770. 10.1016/S0960-9822(00)00746-6. · DOI
- Dompierre JP, Godin JD, Charrin BC, Cordelieres FP, King SJ, Humbert S, Saudou F: Histone deacetylase 6 inhibition compensates for the transport deficit in Huntington's disease by increasing tubulin acetylation. J Neurosci. 2007, 27 (13): 3571-3583. 10.1523/JNEUROSCI.0037-07.2007. · DOI · Paper page
- Bulinski JC: Microtubule modification: acetylation speeds anterograde traffic flow. Curr Biol. 2007, 17 (1): R18-20. 10.1016/j.cub.2006.11.036. · DOI
- Mann SS, Hammarback JA: Molecular characterization of light chain 3. A microtubule binding subunit of MAP1A and MAP1B. J Biol Chem. 1994, 269 (15): 11492-11497. · DOI
- Kochl R, Hu XW, Chan EY, Tooze SA: Microtubules facilitate autophagosome formation and fusion of autophagosomes with endosomes. Traffic. 2006, 7 (2): 129-145. 10.1111/j.1600-0854.2005.00368.x. · DOI
- Jahreiss L, Menzies FM, Rubinsztein DC: The itinerary of autophagosomes: from peripheral formation to kiss-and-run fusion with lysosomes. Traffic. 2008, 9 (4): 574-587. 10.1111/j.1600-0854.2008.00701.x. · DOI
- Eskelinen EL, Prescott AR, Cooper J, Brachmann SM, Wang L, Tang X, Backer JM, Lucocq JM: Inhibition of autophagy in mitotic animal cells. Traffic. 2002, 3 (12): 878-893. 10.1034/j.1600-0854.2002.31204.x. · DOI
- Tasdemir E, Maiuri MC, Tajeddine N, Vitale I, Criollo A, Vicencio JM, Hickman JA, Geneste O, Kroemer G: Cell cycle-dependent induction of autophagy, mitophagy and reticulophagy. Cell Cycle. 2007, 6 (18): 2263-2267. 10.4161/cc.6.18.4681. · DOI
- Mizushima N, Noda T, Yoshimori T, Tanaka Y, Ishii T, George MD, Klionsky DJ, Ohsumi M, Ohsumi Y: A protein conjugation system essential for autophagy. Nature. 1998, 395 (6700): 395-398. 10.1038/26506. · DOI
- Raben N, Takikita S, Pittis MG, Bembi B, Marie SK, Roberts A, Page L, Kishnani PS, Schoser BG, Chien YH, Ralston E, Nagaraju K, Plotz PH: Deconstructing Pompe disease by analyzing single muscle fibers: to see a world in a grain of sand. Autophagy. 2007, 3 (6): 546-552. · DOI
- Kirkin V, McEwan DG, Novak I, Dikic I: A role for ubiquitin in selective autophagy. Mol Cell. 2009, 34 (3): 259-269. 10.1016/j.molcel.2009.04.026. · DOI
- Liu L, Vo A, Liu G, McKeehan WL: Distinct structural domains within C19ORF5 support association with stabilized microtubules and mitochondrial aggregation and genome destruction. Can Res. 2005, 65 (10): 4191-4201. 10.1158/0008-5472.CAN-04-3865. · DOI
- Brown CL, Maier KC, Stauber T, Ginkel LM, Wordeman L, Vernos I, Schroer TA: Kinesin-2 is a motor for late endosomes and lysosomes. Traffic. 2005, 6 (12): 1114-1124. 10.1111/j.1600-0854.2005.00347.x. · DOI · Paper page
- Hammond JW, Cai D, Verhey KJ: Tubulin modifications and their cellular functions. Cur Opin Cell Biol. 2008, 20 (1): 71-76. 10.1016/j.ceb.2007.11.010. · DOI · Paper page
- Vaughan EE, Geiger RC, Miller AM, Loh-Marley PL, Suzuki T, Miyata N, Dean DA: Microtubule acetylation through HDAC6 inhibition results in increased transfection efficiency. Mol Ther. 2008, 16 (11): 1841-1847. 10.1038/mt.2008.190. · DOI
- Liu L, Xie R, Yang C, McKeehan WL: Dual function microtubule- and mitochondria-associated proteins mediate mitotic cell death. Cell Oncol. 2009, 31 (5): 393-405.
- Mizushima N, Yamamoto A, Matsui M, Yoshimori T, Ohsumi Y: In vivo analysis of autophagy in response to nutrient starvation using transgenic mice expressing a fluorescent autophagosome marker. Mol Biol Cell. 2004, 15 (3): 1101-1111. 10.1091/mbc.E03-09-0704. · DOI · Paper page
- Liu L, Vo A, McKeehan WL: Specificity of the methylation-suppressed A isoform of candidate tumor suppressor RASSF1 for microtubule hyperstabilization is determined by cell death inducer C19ORF5. CanRes. 2005, 65 (5): 1830-1838.
- Fang G, Yu H, Kirschner MW: Direct binding of CDC20 protein family members activates the anaphase-promoting complex in mitosis and G1. Mol Cell. 1998, 2 (2): 163-171. 10.1016/S1097-2765(00)80126-4. · DOI
Cited by
Sorted by citations
Guidelines for the use and interpretation of assays for monitoring autophagy (3rd edition).
Klionsky, D. J., Abdelmohsen, K., Abe, A., Abedin, M. J., Abeliovich, H., Acevedo Arozena, A., Adachi, H., Adams, C. M., Adams, P. D., Adeli, K., et al. (2016) · Autophagy · doi:10.1080/15548627.2015.1100356 · Cited by 5,894
Self-citationGuidelines for the use and interpretation of assays for monitoring autophagy
Klionsky, D. J., Abdalla, F. C., Abeliovich, H., Abraham, R. T., Acevedo-Arozena, A., Adeli, K., Agholme, L., Agnello, M., Agostinis, P., Aguirre-Ghiso, J. A., et al. (2012) · Autophagy · doi:10.4161/auto.19496 · Cited by 3,996
Self-citationGuidelines for the use and interpretation of assays for monitoring autophagy (4th edition) 1
Klionsky, D. J., Abdel-Aziz, A. K., Abdelfatah, S., Abdellatif, M., Abdoli, A., Abel, S., Abeliovich, H., Abildgaard, M. H., Abudu, Y. P., Acevedo-Arozena, A., et al. (2021) · Autophagy · doi:10.1080/15548627.2020.1797280 · Cited by 2,897
Self-citationEisenberg, T., Schroeder, S., Andryushkova, A., Pendl, T., Küttner, V., Bhukel, A., Mariño, G., Pietrocola, F., Harger, A., Zimmermann, A., et al. (2014) · Cell Metabolism · doi:10.1016/j.cmet.2014.02.010 · Cited by 256
Autophagy and microtubules - new story, old players
Mackeh, R., Perdiz, D., Lorin, S., Codogno, P., & Poüs, C. (2013) · Journal of Cell Science · doi:10.1242/jcs.115626 · Cited by 212
Metadata
- Authors
- Xie, R., Nguyen, S., McKeehan, W. L., & Liu, L.
- Venue
- BMC Cell Biology
- Published
- 2010-11-22
- Volume
- 11
- Issue
- 1
- ISSN
- 1471-2121
- PMC
- PMC2995476
- Cited by
- 195
- References
- 11
- Language
- en
About these checks
Registry, retraction, Cites and statistics results are computed, not judged, with one exception: a printed reference that no index lists is read once by a model before it counts as a citation error. Claims are extracted by a model and kept only when their quote appears verbatim in the text; each cited source is then checked, with a model’s help, for whether it says what the claim relies on. Those verdicts can be wrong — read the claim’s quote and the cited source before relying on one.
Statistics and arithmetic are recomputed, not judged.
Confidence bands are shown only for fields calibrated on our annotated test set. None is calibrated yet, so no band is shown.
What counts as a claim ›How we measure confidence ›How we check this ›
Are you an author, or do you see a problem with this page? Request a review
