

The DOI matches its Crossref record; 69 of the 69 references it cites were found in a registry or an index.
Molecular evolution of the keratin associated protein gene family in mammals, role in the evolution of mammalian hair
Open accessAbstract
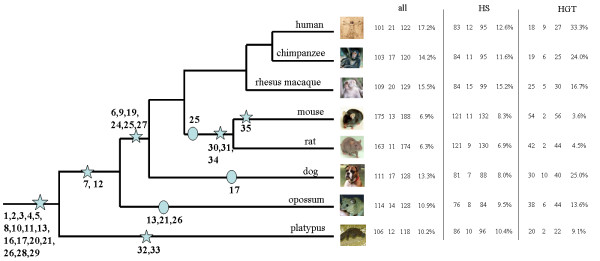
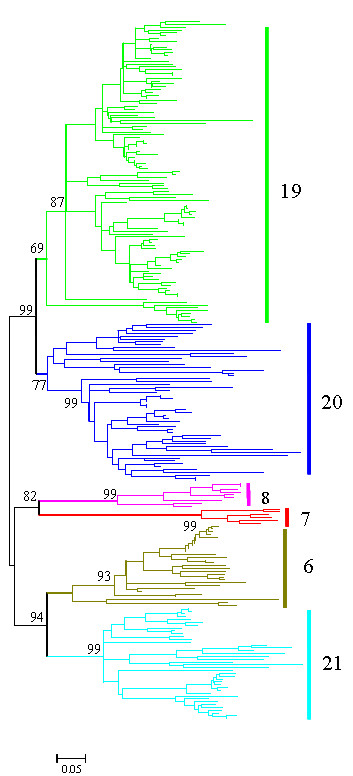
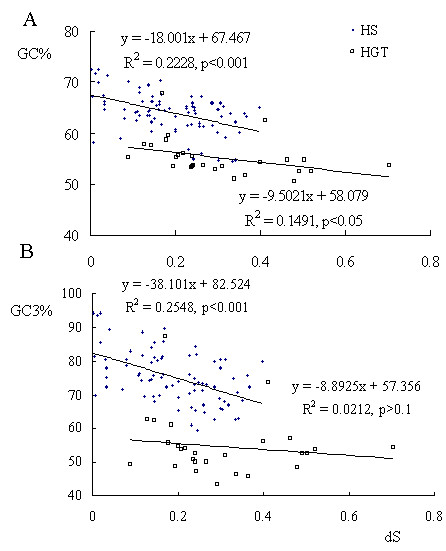
Background: Hair is unique to mammals. Keratin associated proteins (KRTAPs), which contain two major groups: high/ultrahigh cysteine and high glycine-tyrosine, are one of the major components of hair and play essential roles in the formation of rigid and resistant hair shafts. Results: The KRTAP family was identified as being unique to mammals, and near-complete KRTAP gene repertoires for eight mammalian genomes were characterized in this study. An expanded KRTAP gene repertoire was found in rodents. Surprisingly, humans have a similar number of genes as other primates despite the relative hairlessness of humans. We identified several new subfamilies not previously reported in the high/ultrahigh cysteine KRTAP genes. Genes in many subfamilies of the high/ultrahigh cysteine KRTAP genes have evolved by concerted evolution with frequent gene conversion events, yielding a higher GC base content for these gene sequences. In contrast, the high glycine-tyrosine KRTAP genes have evolved more dynamically, with fewer gene conversion events and thus have a lower GC base content, possibly due to positive selection. Conclusion: Most of the subfamilies emerged early in the evolution of mammals, thus we propose that the mammalian ancestor should have a diverse KRTAP gene repertoire. We propose that hair content characteristics have evolved and diverged rapidly among mammals because of rapid divergent evolution of KRTAPs between species. In contrast, subfamilies of KRTAP genes have been homogenized within each species due to concerted evolution.
Overview
The claims and statistics of this paper haven’t been checked yet.
Run the check — free, no account needed. It reads the open-access text and checks the sources it cites.
Integrity signals
Registry
Cites
Statistics
Figures
Verification
Claims the paper makes
The claims and statistics of this paper haven’t been checked yet.
Run the check — free, no account needed. It reads the open-access text and checks the sources it cites.
Claims other papers make about this one
Each is checked against this paper’s own text: does it say what the citing paper says it does?
The source backs part of the claim, not all of it — or backs it for a different population, condition or comparison.
In the citing paper
“Keratins and the keratin-associated proteins are conserved across multiple species with family members encoding the principal structural components of hair and wool160–163.”
From Chromosomal-level reference genome assembly of muskox (Ovibos moschatus) from Banks Island in the Canadian Arctic, a resource for conservation genomics (2024) · cites this paper as [161]
Experimental — accuracy not yet measured
Self-check
Percentages, sums and reported differences re-computed from the paper’s own numbers.
The self-check needs the paper’s full text.
Citations
Cites
Gapped BLAST and PSI-BLAST: a new generation of protein database search programs
Altschul, S. (1997) · Nucleic Acids Research · doi:10.1093/nar/25.17.3389 · Cited by 73,302
Thompson, J. D., Higgins, D. G., & Gibson, T. J. (1994) · Nucleic Acids Research · doi:10.1093/nar/22.22.4673 · Cited by 64,617
Initial sequencing and analysis of the human genome
International Human Genome Sequencing Consortium, Whitehead Institute for Biomedical Research, C. F. G. R., Lander, E. S., Linton, L. M., Birren, B., Nusbaum, C., Zody, M. C., Baldwin, J., Devon, K., Dewar, K., et al. (2001) · Nature · doi:10.1038/35057062 · Cited by 24,216
MEGA3: Integrated software for Molecular Evolutionary Genetics Analysis and sequence alignment
Kumar, S. (2004) · Briefings in Bioinformatics · doi:10.1093/bib/5.2.150 · Cited by 11,674
Initial sequencing and comparative analysis of the mouse genome
Mouse Genome Sequencing Consortium (2002) · Nature · doi:10.1038/nature01262 · Cited by 7,187
PAML: a program package for phylogenetic analysis by maximum likelihood
Yang, Z. (1997) · Computer applications in the biosciences · doi:10.1093/bioinformatics/13.5.555 · Cited by 5,377
Genome sequence, comparative analysis and haplotype structure of the domestic dog
members, B. S. P., Lindblad-Toh, K., Wade, C. M., Mikkelsen, T. S., Karlsson, E. K., Jaffe, D. B., Kamal, M., Clamp, M., Chang, J. L., Kulbokas, E. J., et al. (2005) · Nature · doi:10.1038/nature04338 · Cited by 2,568
Initial sequence of the chimpanzee genome and comparison with the human genome
The Chimpanzee Sequencing and Analysis Consortium (2005) · Nature · doi:10.1038/nature04072 · Cited by 2,459
Genome sequence of the Brown Norway rat yields insights into mammalian evolution
Gibbs, R. A., Weinstock, G. M., Metzker, M. L., Muzny, D. M., Sodergren, E. J., Scherer, S. E., Scott, G., Steffen, D. L., Worley, K. C., Burch, P. E., et al. (2004) · Nature · doi:10.1038/nature02426 · Cited by 2,170
Zhang, J. (2005) · Molecular Biology and Evolution · doi:10.1093/molbev/msi237 · Cited by 1,785
Nielsen, R., & Yang, Z. (1998) · Genetics · doi:10.1093/genetics/148.3.929 · Cited by 1,622
Yang, Z. (1998) · Molecular Biology and Evolution · doi:10.1093/oxfordjournals.molbev.a025957 · Cited by 1,471
Evolutionary and biomedical insights from the rhesus macaque genome.
Gibbs, R. A., Rogers, J., Katze, M. G., Bumgarner, R., Weinstock, G. M., Mardis, E. R., Remington, K. A., Strausberg, R. L., Venter, J. C., Wilson, R. K., et al. (2007) · Science · doi:10.1126/science.1139247 · Cited by 1,403
Concerted and Birth-and-Death Evolution of Multigene Families
Nei, M., & Rooney, A. P. (2005) · Annual Review of Genetics · doi:10.1146/annurev.genet.39.073003.112240 · Cited by 1,298
RDP2: recombination detection and analysis from sequence alignments
Martin, D. P., Williamson, C. E., & Posada, D. (2004) · Bioinformatics · doi:10.1093/bioinformatics/bth490 · Cited by 964
Punctuated equilibrium comes of age
Gould, S. J., & Eldredge, N. (1993) · Nature · doi:10.1038/366223a0 · Cited by 957
Statistical tests for detecting gene conversion.
Sawyer, S. (1989) · Molecular Biology and Evolution · doi:10.1093/oxfordjournals.molbev.a040567 · Cited by 862
Lander, E., Linton, L., Birren, B. W., & Nusbaum, C. (2001) · Cited by 772
Genome analysis of the platypus reveals unique signatures of evolution
paper, A. L. O. A. A. T. A. A. A. T. E. O. T. (2008) · Nature · doi:10.1038/nature06936 · Cited by 719 · cited 1×
“Particularly, mammals are well represented with data from: placental mammals including primates – human [35], chimpanzee [36] and rhesus macaque [37]; rodents – mouse [38] and rat [39]; carnivore – dog [40]; a marsupial, the opossum [41]; and a monotreme, the duck-billed platypus [42].”
Genome of the marsupial Monodelphis domestica reveals innovation in non-coding sequences
Broad Institute Genome Sequencing Platform, Mikkelsen, T. S., Broad Institute Whole Genome Assembly Team, Wakefield, M. J., Aken, B., Amemiya, C. T., Chang, J. L., Duke, S., Garber, M., Gentles, A. J., et al. (2007) · Nature · doi:10.1038/nature05805 · Cited by 711
Genes and ligands for odorant, vomeronasal and taste receptors
Mombaerts, P. (2004) · Nature reviews. Neuroscience · doi:10.1038/nrn1365 · Cited by 693
Anisimova, M. O., Nielsen, R., & Yang, Z. (2003) · Genetics · doi:10.1093/genetics/164.3.1229 · Cited by 561
Adaptive Evolution of Genes and Genomes
Zeyl, C., & Hughes, A. L. (2001) · Journal of Parasitology · doi:10.2307/3285093 · Cited by 502
Comparative analyses of immunoglobulin genes: surprises and portents
Flajnik, M. F. (2002) · Nature reviews. Immunology · doi:10.1038/nri889 · Cited by 372
Huntley, S., Baggott, D. M., Hamilton, A. T., Tran-Gyamfi, M. B., Yang, S., Kim, J., Gordon, L. A., Branscomb, E., & Stubbs, L. J. (2006) · Genome Research · doi:10.1101/gr.4842106 · Cited by 370
Evolutionary dynamics of olfactory receptor genes in fishes and tetrapods
Niimura, Y., & Nei, M. (2005) · Proceedings of the National Academy of Sciences · doi:10.1073/pnas.0501922102 · Cited by 351
Extensive Gains and Losses of Olfactory Receptor Genes in Mammalian Evolution
Niimura, Y., & Nei, M. (2007) · PLoS ONE · doi:10.1371/journal.pone.0000708 · Cited by 341
Biased gene conversion: implications for genome and sex evolution
Marais, G. A. B. (2003) · Trends in Genetics · doi:10.1016/s0168-9525(03)00116-1 · Cited by 327
Shi, P., & Zhang, J. (2005) · Molecular Biology and Evolution · doi:10.1093/molbev/msj028 · Cited by 296
Evolution of olfactory receptor genes in the human genome
Niimura, Y., & Nei, M. (2003) · Proceedings of the National Academy of Sciences · doi:10.1073/pnas.1635157100 · Cited by 290
The Catalog of Human Hair Keratins
Langbein, L., Rogers, M. A., Winter, H., Praetzel, S., & Schweizer, J. (2001) · Journal of Biological Chemistry · doi:10.1074/jbc.m103305200 · Cited by 277
The Catalog of Human Hair Keratins
Langbein, L., Rogers, M. A., Winter, H., Praetzel, S., Beckhaus, U., Rackwitz, H., & Schweizer, J. (1999) · Journal of Biological Chemistry · doi:10.1074/jbc.274.28.19874 · Cited by 275
Adaptive Diversification of Bitter Taste Receptor Genes in Mammalian Evolution
Shi, P. (2003) · Molecular Biology and Evolution · doi:10.1093/molbev/msg083 · Cited by 269
The evolution of bipedality and loss of functional body hair in hominids
Wheeler, P. E. (1984) · Journal of Human Evolution · doi:10.1016/s0047-2484(84)80079-2 · Cited by 239
Evolutionary dynamics of olfactory and other chemosensory receptor genes in vertebrates
Niimura, Y., & Nei, M. (2006) · Journal of Human Genetics · doi:10.1007/s10038-006-0391-8 · Cited by 238
Human Hair Keratin‐Associated Proteins (KAPs)
Rogers, M. A., Langbein, L., Praetzel‐Wunder, S., Winter, H., & Schweizer, J. (2006) · International review of cytology · doi:10.1016/s0074-7696(06)51006-x · Cited by 237
The role of keratin proteins and their genes in the growth, structure and properties of hair
Powell, B. C., & Rogers, G. E. (1997) · Birkhäuser Basel eBooks · doi:10.1007/978-3-0348-9223-0_3 · Cited by 227
Shi, P., & Zhang, J. (2007) · Genome Research · doi:10.1101/gr.6040007 · Cited by 225
Comprehensive analysis of keratin gene clusters in humans and rodents
Hesse, M., Zimek, A., Weber, K. K., & Magin, T. M. (2004) · European Journal of Cell Biology · doi:10.1078/0171-9335-00354 · Cited by 194
V2R gene families degenerated in primates, dog and cow, but expanded in opossum
Young, J. M., & Trask, B. J. (2007) · Trends in Genetics · doi:10.1016/j.tig.2007.03.004 · Cited by 194
Grus, W. E., Shi, P., Zhang, Y.-P., & Zhang, J. (2005) · Proceedings of the National Academy of Sciences · doi:10.1073/pnas.0501589102 · Cited by 193
Self-citationFormation and Structure of Human Hair
(1995) · Birkhäuser Basel eBooks · doi:10.1007/978-3-0348-9223-0 · Cited by 174
Patterns of Transitional Mutation Biases Within and Among Mammalian Genomes
Rosenberg, M. S. (2003) · Molecular Biology and Evolution · doi:10.1093/molbev/msg113 · Cited by 158
Gene conversion drives GC content evolution in mammalian histones
Galtier, N. (2003) · Trends in Genetics · doi:10.1016/s0168-9525(02)00002-1 · Cited by 145
Evolution of Bitter Taste Receptors in Humans and Apes
Fischer, A., Gilad, Y., Man, O., & Pääbo, S. (2004) · Molecular Biology and Evolution · doi:10.1093/molbev/msi027 · Cited by 125
Rogers, M. A., Langbein, L., Winter, H., Ehmann, C., Praetzel, S., & Schweizer, J. (2002) · Journal of Biological Chemistry · doi:10.1074/jbc.m206422200 · Cited by 111
Gene Conversion and the Evolution of Protocadherin Gene Cluster DiversityPreprint
Noonan, J. P., Grimwood, J., Schmutz, J., Dickson, M. C., & Myers, R. (2004) · Genome Research · doi:10.1101/gr.2133704 · Cited by 105
Rogers, M. A., Langbein, L., Winter, H., Ehmann, C., Praetzel, S., Korn, B., & Schweizer, J. (2001) · Journal of Biological Chemistry · doi:10.1074/jbc.m100657200 · Cited by 104
Mammalian skin evolution: a reevaluation
MADERSON, P. F. A. (2003) · Experimental Dermatology · doi:10.1034/j.1600-0625.2003.00069.x · Cited by 98
Regulation of Keratin Gene Expression in Hair Follicle Differentiationa
Powell, B. C., Nesci, A., & Rogers, G. E. (1991) · Annals of the New York Academy of Sciences · doi:10.1111/j.1749-6632.1991.tb24376.x · Cited by 96
Evolutionary expansion and divergence in the ZNF91 subfamily of primate-specific zinc finger genesPreprint
Hamilton, A. T., Huntley, S., Tran-Gyamfi, M. B., Baggott, D. M., Gordon, L. A., & Stubbs, L. J. (2006) · Genome Research · doi:10.1101/gr.4843906 · Cited by 84
Largest Vertebrate Vomeronasal Type 1 Receptor Gene Repertoire in the Semiaquatic Platypus
Grus, W. E., Shi, P., & Zhang, J. (2007) · Molecular Biology and Evolution · doi:10.1093/molbev/msm157 · Cited by 83
Characterization of a 300 kbp Region of Human DNA Containing the Type II Hair Keratin Gene Domain
Rogers, M. A., Winter, H., Wolf, C., Schweizer, J., & Langbein, L. (2000) · Journal of Investigative Dermatology · doi:10.1046/j.1523-1747.2000.00910.x · Cited by 77
Characterization of a 190-Kilobase Pair Domain of Human Type I Hair Keratin Genes
Rogers, M. A., Winter, H., Wolf, C., Heck, M., & Schweizer, J. (1998) · Journal of Biological Chemistry · doi:10.1074/jbc.273.41.26683 · Cited by 75
Allometry of primate hair density and the evolution of human hairlessness
Schwartz, G. G., & Rosenblum, L. A. (1981) · American Journal of Physical Anthropology · doi:10.1002/ajpa.1330550103 · Cited by 73
Characterization of the Gene Conversions Between the Multigene Family Members of the Yeast Genome
Drouin, G. (2002) · Journal of Molecular Evolution · doi:10.1007/s00239-001-0085-y · Cited by 70
Rogers, M. A., & Schweizer, J. (2005) · Journal of Investigative Dermatology · doi:10.1111/j.0022-202x.2005.23728.x · Cited by 66
Rogers, M. A., Winter, H., Beckmann, I., Schweizer, J., Langbein, L., & Praetzel, S. (2004) · Journal of Investigative Dermatology · doi:10.1046/j.0022-202x.2003.22128.x · Cited by 64
Rogers, M. A., Winter, H., Langbein, L., Wollschläger, A., Praetzel‐Wunder, S., Jave‐Suárez, L. F., & Schweizer, J. (2007) · Journal of Investigative Dermatology · doi:10.1038/sj.jid.5700702 · Cited by 64
Divergence of T2R chemosensory receptor families in humans, bonobos, and chimpanzees
Parry, C. M., Erkner, A., & le Coutre, J. (2004) · Proceedings of the National Academy of Sciences · doi:10.1073/pnas.0404894101 · Cited by 49
Polymorphisms in the Human High Sulfur Hair Keratin-associated Protein 1, KAP1, Gene Family
Shimomura, Y., Aoki, N., Schweizer, J., Langbein, L., Rogers, M. A., Winter, H., & Ito, M. (2002) · Journal of Biological Chemistry · doi:10.1074/jbc.m206398200 · Cited by 48
Shibuya, K., Obayashi, I., Asakawa, S., Minoshima, S., Kudoh, J., & Shimizu, N. (2004) · Genomics · doi:10.1016/j.ygeno.2003.09.024 · Cited by 33
Kariya, N., Shimomura, Y., & Ito, M. (2005) · Journal of Investigative Dermatology · doi:10.1111/j.0022-202x.2005.23662.x · Cited by 29
Yahagi, S., Shibuya, K., Obayashi, I., Masaki, H., Kurata, Y., Kudoh, J., & Shimizu, N. (2004) · Biochemical and Biophysical Research Communications · doi:10.1016/j.bbrc.2004.04.074 · Cited by 26
Powell, B. C., Arthur, J. F., & Nesci, A. (1995) · Differentiation · doi:10.1046/j.1432-0436.1995.5830227.x · Cited by 26
Alibardi, L. (2004) · Journal of Anatomy · doi:10.1111/j.0021-8782.2004.00324.x · Cited by 21
Alibardi, L. (2004) · Journal of Morphology · doi:10.1002/jmor.10254 · Cited by 15
Why Mammal Body Hair Is an Evolutionary Enigma
Bergman, J. (2003) · Cited by 9
Alibardi, L. (2004) · Journal of Morphology · doi:10.1002/jmor.10257 · Cited by 8
Research works printed but not linked: 1
- [http://www.ncbi.nlm.nih.gov/]
Cited by
Sorted by citations
Piezoelectric materials for tissue regeneration: A review
Rajabi, A. H., Jaffé, M., & Arinzeh, T. L. (2015) · Acta Biomaterialia · doi:10.1016/j.actbio.2015.07.010 · Cited by 641
The human hair: from anatomy to physiology
Buffoli, B., Rinaldi, F., Labanca, M., Sorbellini, E., Trink, A., Guanziroli, E., Rezzani, R., & Rodella, L. F. (2013) · International Journal of Dermatology · doi:10.1111/ijd.12362 · Cited by 268
Sack, L. M., Davoli, T., Li, M. Z., Li, Y., Xu, Q., Naxerova, K., Wooten, E. C., Bernardi, R. J., Martin, T. D., Chen, T., et al. (2018) · Cell · doi:10.1016/j.cell.2018.02.037 · Cited by 225
A whole genome Bayesian scan for adaptive genetic divergence in West African cattle
Gautier, M., Flori, L., Riebler, A., Jaffrézic, F., Laloë, D., Gut, I. G., Moazami‐Goudarzi, K., & Foulley, J. (2009) · BMC Genomics · doi:10.1186/1471-2164-10-550 · Cited by 200
The cell biology of human hair follicle pigmentation
Tobin, D. J. (2010) · Pigment Cell & Melanoma Research · doi:10.1111/j.1755-148x.2010.00803.x · Cited by 152
Metadata
- Authors
- Wu, D.-D., Irwin, D. M., & Zhang, Y.-P.
- Affiliations
- Kunming Institute of Zoology (CN)
- University of Toronto (CA)
- Corresponding author
- Zhang, Ya-Ping
- Venue
- BMC Evolutionary Biology
- Published
- 2008-08-23
- Volume
- 8
- Issue
- 1
- Pages
- 241-241
- ISSN
- 1471-2148 (ISSN-L)
- PMC
- PMC2528016
- OpenAlex
- W2059503064
- Cited by
- 121
- References
- 69
- Citations by year
- 2026: 3 · 2025: 6 · 2024: 9 · 2023: 8 · 2022: 12 · 2021: 6 · 2020: 12 · 2019: 3 · 2018: 12 · 2017: 3 · 2016: 7 · 2015: 5 · 2014: 7 · 2013: 5 · 2012: 5
- FWCI
- 2.63
- Type
- journal article
- Language
- en
- Update notices
- erratum (2009-08-25)
- Open access
- gold
- doi.org
- Licence
- cc-by
- Locations
- BMC Evolutionary Biology (publishedVersion, cc-by)
- PubMed Central (publishedVersion, cc-by)
- PubMed (publishedVersion)
- TSpace (University of Toronto) (submittedVersion)
- DOAJ (DOAJ: Directory of Open Access Journals) (submittedVersion, cc-by-sa)
- Funders
- Deutsches Krebsforschungszentrum
- National Natural Science Foundation of China (30430110, 973 Program, 30621092, 2007CB411600)
- National Key Research and Development Program of China (2007CB411600)
- Topics
- Life Sciences › Biochemistry, Genetics and Molecular Biology › Cell Biology › Skin and Cellular Biology Research
- Life Sciences › Biochemistry, Genetics and Molecular Biology › Molecular Biology › Genomics and Phylogenetic Studies
- Life Sciences › Biochemistry, Genetics and Molecular Biology › Genetics › Chromosomal and Genetic Variations
- Keywords
- keratin-associated proteins, hair shaft structure, rodents, concerted evolution, gene conversion, positive selection, GC content
- MeSH terms
- Amino Acid Sequence, Animals, Base Composition, Gene Conversion, Multigene Family, Hair, Humans, Keratins, Mammals, Phylogeny, Pseudogenes, Recombination, Genetic, Species Specificity, Genome, Human, Evolution, Molecular, Gene Duplication
About these checks
Registry, retraction, Cites and statistics results are computed, not judged, with one exception: a printed reference that no index lists is read once by a model before it counts as a citation error. Claims are extracted by a model and kept only when their quote appears verbatim in the text; each cited source is then checked, with a model’s help, for whether it says what the claim relies on. Those verdicts can be wrong — read the claim’s quote and the cited source before relying on one.
Statistics and arithmetic are recomputed, not judged.
Confidence bands are shown only for fields calibrated on our annotated test set. None is calibrated yet, so no band is shown.
What counts as a claim ›How we measure confidence ›How we check this ›
Are you an author, or do you see a problem with this page? Request a review
