

The DOI matches its Crossref record; 19 of the 19 references it cites were found in a registry or an index.
Gene expression profiling of whole blood: Comparison of target preparation methods for accurate and reproducible microarray analysis
Abstract
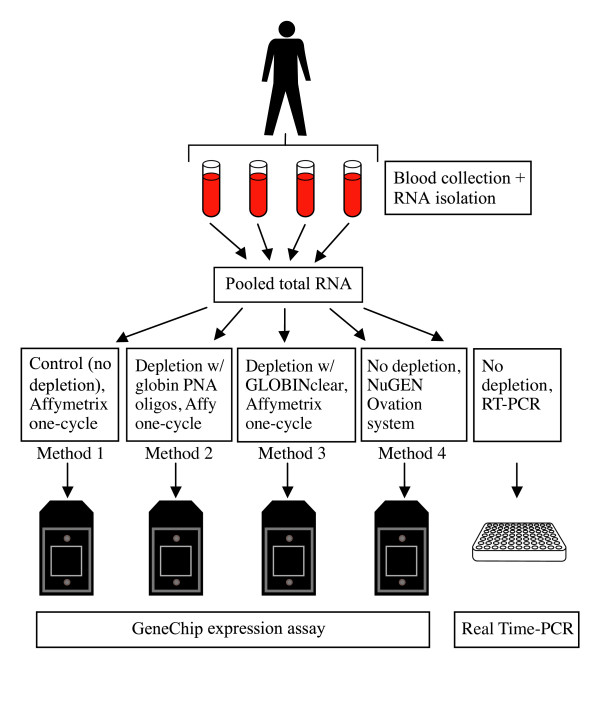
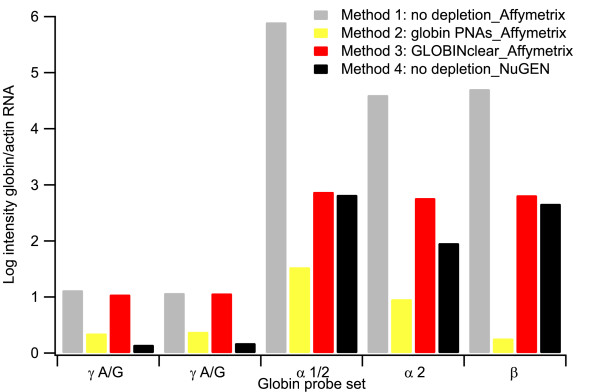
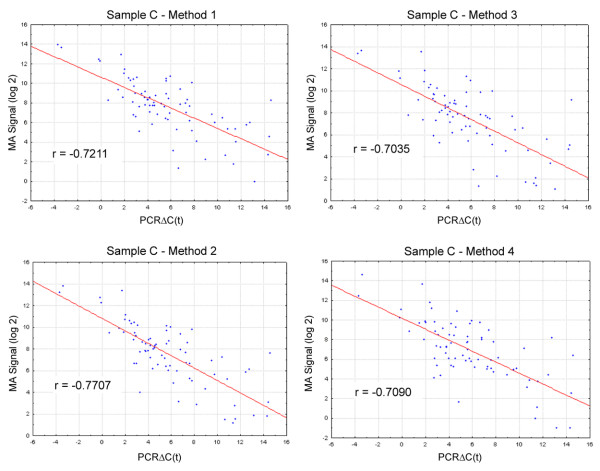
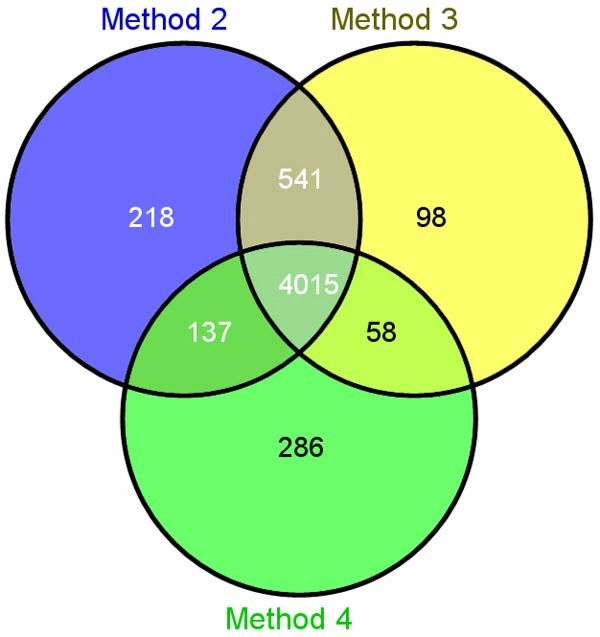
Background: Peripheral blood is an accessible and informative source of transcriptomal information for many human disease and pharmacogenomic studies. While there can be significant advantages to analyzing RNA isolated from whole blood, particularly in clinical studies, the preparation of samples for microarray analysis is complicated by the need to minimize artifacts associated with highly abundant globin RNA transcripts. The impact of globin RNA transcripts on expression profiling data can potentially be reduced by using RNA preparation and labeling methods that remove or block globin RNA during the microarray assay. We compared four different methods for preparing microarray hybridization targets from human whole blood collected in PAXGene tubes. Three of the methods utilized the Affymetrix one-cycle cDNA synthesis/in vitro transcription protocol but varied treatment of input RNA as follows: i. no treatment; ii. treatment with GLOBINclear; or iii. treatment with globin PNA oligos. In the fourth method cDNA targets were prepared with the Ovation amplification and labeling system. Results: We find that microarray targets generated with labeling methods that reduce globin mRNA levels or minimize the impact of globin transcripts during hybridization detect more transcripts in the microarray assay compared with the standard Affymetrix method. Comparison of microarray results with quantitative PCR analysis of a panel of genes from the NF-kappa B pathway shows good correlation of transcript measurements produced with all four target preparation methods, although method-specific differences in overall correlation were observed. The impact of freezing blood collected in PAXGene tubes on data reproducibility was also examined. Expression profiles show little or no difference when RNA is extracted from either fresh or frozen blood samples. Conclusion: RNA preparation and labeling methods designed to reduce the impact of globin mRNA transcripts can significantly improve the sensitivity of the DNA microarray expression profiling assay for whole blood samples. While blockage of globin transcripts during first strand cDNA synthesis with globin PNAs resulted in the best overall performance in this study, we conclude that selection of a protocol for expression profiling studies in blood should depend on several factors, including implementation requirements of the method and study design. RNA isolated from either freshly collected or frozen blood samples stored in PAXGene tubes can be used without altering gene expression profiles.
Overview
The claims and statistics of this paper haven’t been checked yet.
Run the check — free, no account needed. It reads the open-access text and checks the sources it cites.
Integrity signals
Registry
Cites
Statistics
Figures
Verification
Claims the paper makes
The claims and statistics of this paper haven’t been checked yet.
Run the check — free, no account needed. It reads the open-access text and checks the sources it cites.
Claims other papers make about this one
Each is checked against this paper’s own text: does it say what the citing paper says it does?
In the citing paper
“The biggest advantage of peripheral blood over the other blood-derived biological materials comes from very low technical variability during sample handling and processing, which makes this material very attractive for the use in a clinical setting (3).”
From Depletion of erythropoietic miR-486-5p and miR-451a improves detectability of rare microRNAs in peripheral blood-derived small RNA sequencing libraries (2020) · cites this paper as [3]
Self-check
Percentages, sums and reported differences re-computed from the paper’s own numbers.
The self-check needs the paper’s full text.
Citations
Cites
Exploration, normalization, and summaries of high density oligonucleotide array probe level data
Irizarry, R. A. (2003) · Biostatistics · doi:10.1093/biostatistics/4.2.249 · Cited by 10,603
Summaries of Affymetrix GeneChip probe level data
Irizarry, R. A. (2003) · Nucleic Acids Research · doi:10.1093/nar/gng015 · Cited by 4,887
Individuality and variation in gene expression patterns in human blood
Whitney, A. R., Diehn, M., Popper, S. J., Alizadeh, A. A., Boldrick, J. C., Relman, D. A., & Brown, P. O. (2003) · Proceedings of the National Academy of Sciences · doi:10.1073/pnas.252784499 · Cited by 775
Robust estimators for expression analysis
Hubbell, E. A., Liu, W., & Mei, R. (2002) · Bioinformatics · doi:10.1093/bioinformatics/18.12.1585 · Cited by 603
Analysis of high density expression microarrays with signed-rank call algorithms
Liu, W.-M., Mei, R., Di, X., Ryder, T. B., Hubbell, E. A., Dee, S., Webster, T. A., Harrington, C. A., Ho, M.-H., Baid, J., et al. (2002) · Bioinformatics · doi:10.1093/bioinformatics/18.12.1593 · Cited by 426
Self-citationStabilization of mRNA Expression in Whole Blood Samples
Rainen, L., Oelmüller, U., Jurgensen, S. R., Wyrich, R., Ballas, C., Schram, J., Herdman, C. A., Bankaitis-Davis, D. M., Nicholls, N. J., Trollinger, D. B., et al. (2002) · Clinical Chemistry · doi:10.1093/clinchem/48.11.1883 · Cited by 334
Debey, S., Schoenbeck, U., Hellmich, M., Gathof, B. S., Pillai, R., Zander, T., & Schultze, J. L. (2004) · The Pharmacogenomics Journal · doi:10.1038/sj.tpj.6500240 · Cited by 216
Whole blood and leukocyte RNA isolation for gene expression analyses
Feezor, R. J., Baker, H. V., Mindrinos, M. N., Hayden, D. L., Tannahill, C. L., Brownstein, B. H., Fay, A., MacMillan, S., Laramie, J. M., Xiao, W., et al. (2004) · Physiological Genomics · doi:10.1152/physiolgenomics.00020.2004 · Cited by 214
Linear mRNA Amplification from as Little as 5 ng Total RNA for Global gene Expression Analysis
Dafforn, A., Chen, P., Deng, G. Y., et al. (2004) · BioTechniques · doi:10.2144/04375pf01 · Cited by 125
Effects of Globin mRNA Reduction Methods on Gene Expression Profiles from Whole Blood
Liu, J., Walter, E. A., Stenger, D. A., & Thach, D. (2006) · Journal of Molecular Diagnostics · doi:10.2353/jmoldx.2006.060021 · Cited by 80
Cited by
A Pilot Study of an Oral Phosphodiesterase Inhibitor (Apremilast) for Atopic Dermatitis in Adults
Samrao, A., Berry, T. M., Goreshi, R., & Simpson, E. L. (2012) · Archives of Dermatology · doi:10.1001/archdermatol.2012.812 · Cited by 166
Roubroeks, J. A. Y., Smith, A. R., Smith, R. G., Pishva, E., Ibrahim, Z., Sattlecker, M., Hannon, E. J., Kłoszewska, I., Mecocci, P., Soininen, H., et al. (2020) · Neurobiology of Aging · doi:10.1016/j.neurobiolaging.2020.06.023 · Cited by 82
Pellegrino, R., Sunaga, D. Y., Guindalini, C., Martins, R. C. S., Mazzotti, D. R., Wei, Z., Daye, Z. J., Andersen, M. L., & Tufik, S. (2012) · Physiological Genomics · doi:10.1152/physiolgenomics.00058.2012 · Cited by 42
Schmidt, S., Willers, J., Stahl, F., Mutz, K.-O., Scheper, T., Hahn, A., & Schuchardt, J. P. (2012) · Lipids in Health and Disease · doi:10.1186/1476-511x-11-172 · Cited by 31
Juzenas, S., Lindqvist, C. M., Ito, G., Dolshanskaya, Y., Halfvarson, J., Franke, A., & Hemmrich-Stanisak, G. (2020) · NAR Genomics and Bioinformatics · doi:10.1093/nargab/lqaa008 · Cited by 17
Metadata
- Authors
- Vartanian, K., Slottke, R., Johnstone, T., Casale, A., Planck, S. R., Choi, D., Smith, J. R., Rosenbaum, J. T., & Harrington, C. A.
- Venue
- BMC Genomics
- Published
- 2009-01-05
- Volume
- 10
- Issue
- 1
- ISSN
- 1471-2164
- PMC
- PMC2649161
- Cited by
- 70
- References
- 19
- Language
- en
About these checks
Registry, retraction, Cites and statistics results are computed, not judged, with one exception: a printed reference that no index lists is read once by a model before it counts as a citation error. Claims are extracted by a model and kept only when their quote appears verbatim in the text; each cited source is then checked, with a model’s help, for whether it says what the claim relies on. Those verdicts can be wrong — read the claim’s quote and the cited source before relying on one.
Statistics and arithmetic are recomputed, not judged.
Confidence bands are shown only for fields calibrated on our annotated test set. None is calibrated yet, so no band is shown.
What counts as a claim ›How we measure confidence ›How we check this ›
Are you an author, or do you see a problem with this page? Request a review
Data sources
Bibliographic data: Semantic Scholar, OpenAlex, Crossref.
Contains information from the Semantic Scholar Academic Graph Datasets, made available under the ODC Attribution License (ODC-BY 1.0).
Semantic Scholar’s data is described in: Kinney, R., et al. (2023). The Semantic Scholar Open Data Platform. arXiv:2301.10140.
