

The DOI matches its Crossref record; 37 of the 37 references it cites were found in a registry or an index.
Whole-genome sequencing of a laboratory-evolved yeast strain
Open accessAbstract
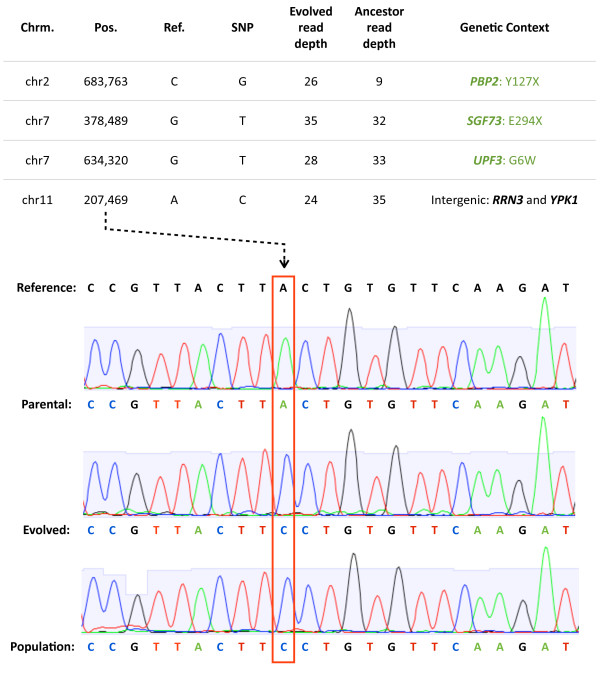
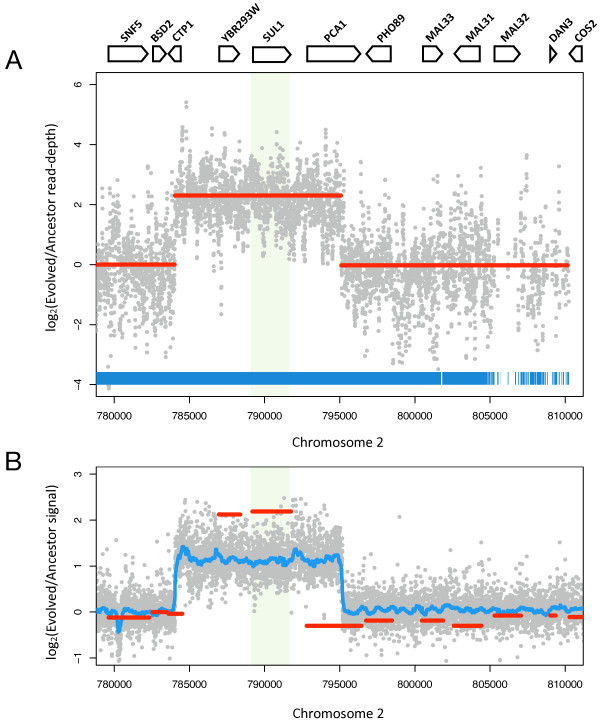
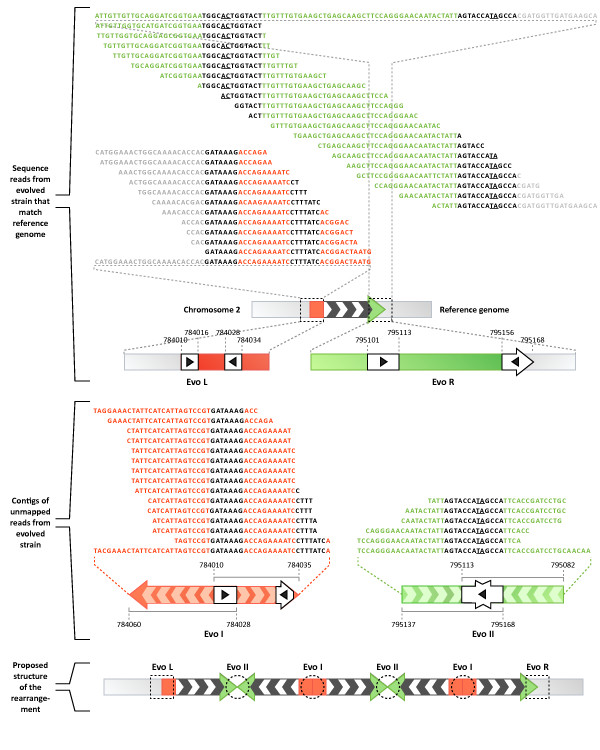
Background: Experimental evolution of microbial populations provides a unique opportunity to study evolutionary adaptation in response to controlled selective pressures. However, until recently it has been difficult to identify the precise genetic changes underlying adaptation at a genome-wide scale. New DNA sequencing technologies now allow the genome of parental and evolved strains of microorganisms to be rapidly determined. Results: We sequenced >93.5% of the genome of a laboratory-evolved strain of the yeast Saccharomyces cerevisiae and its ancestor at >28× depth. Both single nucleotide polymorphisms and copy number amplifications were found, with specific gains over array-based methodologies previously used to analyze these genomes. Applying a segmentation algorithm to quantify structural changes, we determined the approximate genomic boundaries of a 5× gene amplification. These boundaries guided the recovery of breakpoint sequences, which provide insights into the nature of a complex genomic rearrangement. Conclusions: This study suggests that whole-genome sequencing can provide a rapid approach to uncover the genetic basis of evolutionary adaptations, with further applications in the study of laboratory selections and mutagenesis screens. In addition, we show how single-end, short read sequencing data can provide detailed information about structural rearrangements, and generate predictions about the genomic features and processes that underlie genome plasticity.
Overview
The claims and statistics of this paper haven’t been checked yet.
Run the check — free, no account needed. It reads the open-access text and checks the sources it cites.
Integrity signals
Registry
Cites
Statistics
Figures
Verification
Claims the paper makes
The claims and statistics of this paper haven’t been checked yet.
Run the check — free, no account needed. It reads the open-access text and checks the sources it cites.
Claims other papers make about this one
Each is checked against this paper’s own text: does it say what the citing paper says it does?
In the citing paper
“Furthermore, changes in enterobactin biosynthetic processes (ent genes) were also observed in independent studies [84,85,91].”
From Adaptive laboratory evolution—Principles and applications for biotechnology (2013) · cites this paper as [91]
In the citing paper
“In a recent study towards increased n-butanol tolerance in E. coli, a drastic increase in solvent tolerance was rapidly achieved by combining laboratory evolution and genome shuffling of the evolved clones [91].”
From Adaptive laboratory evolution—Principles and applications for biotechnology (2013) · cites this paper as [91]
Self-check
Percentages, sums and reported differences re-computed from the paper’s own numbers.
The self-check needs the paper’s full text.
Citations
Cites
Velvet: Algorithms for de novo short read assembly using de Bruijn graphsPreprint
Zerbino, D. R., & Birney, E. (2008) · Genome Research · doi:10.1101/gr.074492.107 · Cited by 9,587
Accurate whole human genome sequencing using reversible terminator chemistry
Bentley, D. R., Balasubramanian, S., Swerdlow, H. P., Smith, G. P., Milton, J., Brown, C. G., Hall, K. P., Evers, D. J., Barnes, C. L., Bignell, H. R., et al. (2008) · Nature · doi:10.1038/nature07517 · Cited by 3,684
Mapping short DNA sequencing reads and calling variants using mapping quality scores
Li, H., Ruan, J., & Durbin, R. (2008) · Genome Research · doi:10.1101/gr.078212.108 · Cited by 2,638
Targeted capture and massively parallel sequencing of 12 human exomes
Ng, S. B., Turner, E. H., Robertson, P. D., Flygare, S. D., Bigham, A. W., Lee, C., Shaffer, T., Wong, M., Bhattacharjee, A., Eichler, E. E., et al. (2009) · Nature · doi:10.1038/nature08250 · Cited by 2,030
Exome sequencing identifies the cause of a mendelian disorder
Ng, S. B., Buckingham, K. J., Lee, C., Bigham, A. W., Tabor, H. K., Dent, K. M., Huff, C. D., Shannon, P. T., Jabs, E. W., Nickerson, D. A., et al. (2010) · Nature Genetics · doi:10.1038/ng.499 · Cited by 1,957
The complete genome of an individual by massively parallel DNA sequencing
Wheeler, D. A., Srinivasan, M., Egholm, M., Shen, Y., Chen, L., McGuire, A., He, W., Chen, Y.-J., Makhijani, V., Roth, G. T., et al. (2008) · Nature · doi:10.1038/nature06884 · Cited by 1,838
Population genomics of domestic and wild yeastsPreprint
Liti, G., Carter, D. M., Moses, A. M., Warringer, J., Parts, L., James, S. A., Davey, R., Roberts, I. N., Burt, A., Koufopanou, V., et al. (2008) · Nature Precedings · doi:10.1038/nature07743 · Cited by 1,454
Accurate Multiplex Polony Sequencing of an Evolved Bacterial Genome
Shendure, J., Porreca, G. J., Reppas, N. B., Lin, X., McCutcheon, J. P., Rosenbaum, A. M., Wang, M. D., Zhang, K., Mitra, R. D., & Church, G. M. (2005) · Science · doi:10.1126/science.1117389 · Cited by 1,402
Genome evolution and adaptation in a long-term experiment with Escherichia coli
Barrick, J. E., Yu, D. S., Yoon, S. H., Jeong, H., Oh, T. K., Schneider, D., Lenski, R. E., & Kim, J. F. (2009) · Nature · doi:10.1038/nature08480 · Cited by 1,184
A faster circular binary segmentation algorithm for the analysis of array CGH data
Venkatraman, E. S., & Olshen, A. B. (2007) · Bioinformatics · doi:10.1093/bioinformatics/btl646 · Cited by 963
Cited by
Sorted by citations
Adaptive laboratory evolution—Principles and applications for biotechnology
Dragosits, M., & Mattanovich, D. (2013) · Microbial Cell Factories · doi:10.1186/1475-2859-12-64 · Cited by 827
The genomics of speciation-with-gene-flow
Feder, J. L., Egan, S. P., & Nosil, P. (2012) · Trends in Genetics · doi:10.1016/j.tig.2012.03.009 · Cited by 827
Kawecki, T. J., Lenski, R. E., Ebert, D., Hollis, B., Olivieri, I., & Whitlock, M. C. (2012) · Trends in Ecology & Evolution · doi:10.1016/j.tree.2012.06.001 · Cited by 807
Molecular spandrels: tests of adaptation at the genetic level
Barrett, R. D. H., & Hoekstra, H. E. (2011) · Nature Reviews Genetics · doi:10.1038/nrg3015 · Cited by 562
Sandberg, T. E., Salazar, M. J., Weng, L. L., Palsson, B. Ø., & Feist, A. M. (2019) · Metabolic Engineering · doi:10.1016/j.ymben.2019.08.004 · Cited by 585
Genomic divergence during speciation: causes and consequences
Nosil, P., & Feder, J. L. (2011) · Philosophical Transactions of the Royal Society B Biological Sciences · doi:10.1098/rstb.2011.0263 · Cited by 372
Dujon, B. (2010) · Nature Reviews Genetics · doi:10.1038/nrg2811 · Cited by 330
Microbial laboratory evolution in the era of genome‐scale science
Conrad, T. M., Lewis, N. E., & Palsson, B. Ø. (2011) · Molecular Systems Biology · doi:10.1038/msb.2011.42 · Cited by 282
Mechanisms of Gene Duplication and AmplificationPreprint
Reams, A. B., & Roth, J. R. (2015) · Cold Spring Harbor Perspectives in Biology · doi:10.1101/cshperspect.a016592 · Cited by 274
Elucidating the molecular architecture of adaptation via evolve and resequence experiments
Long, A. D., Liti, G., Lupták, A., & Tenaillon, O. (2015) · Nature Reviews Genetics · doi:10.1038/nrg3937 · Cited by 272
Kvitek, D. J., & Sherlock, G. (2013) · PLoS Genetics · doi:10.1371/journal.pgen.1003972 · Cited by 235
Mans, R., Daran, J.-M. G., & Pronk, J. T. (2017) · Current Opinion in Biotechnology · doi:10.1016/j.copbio.2017.10.011 · Cited by 167
Evolutionary insight from whole‐genome sequencing of experimentally evolved microbes
DETTMAN, J. R., RODRIGUE, N., MELNYK, A. H., WONG, A., BAILEY, S. F., & KASSEN, R. (2012) · Molecular Ecology · doi:10.1111/j.1365-294x.2012.05484.x · Cited by 160
Hunger Artists: Yeast Adapted to Carbon Limitation Show Trade-Offs under Carbon Sufficiency
Wenger, J. W., Piotrowski, J., Nagarajan, S., Chiotti, K., Sherlock, G., & Rosenzweig, F. (2011) · PLoS Genetics · doi:10.1371/journal.pgen.1002202 · Cited by 154
Dragosits, M., Mozhayskiy, V., Quiñones-Soto, S., Park, J., & Tagkopoulos, I. (2013) · Molecular Systems Biology · doi:10.1038/msb.2012.76 · Cited by 149
Nowrousian, M. (2010) · Eukaryotic Cell · doi:10.1128/ec.00123-10 · Cited by 145
Improved use of a public good selects for the evolution of undifferentiated multicellularity
Koschwanez, J. H., Foster, K. R., & Murray, A. W. (2013) · eLife · doi:10.7554/elife.00367 · Cited by 140
Establishment of new mutations under divergence and genome hitchhiking
Feder, J. L., Gejji, R., Yeaman, S., & Nosil, P. (2011) · Philosophical Transactions of the Royal Society B Biological Sciences · doi:10.1098/rstb.2011.0256 · Cited by 136
Laluce, C., Schenberg, A. C. G., Gallardo, J. C. M., Coradello, L. F. C., & Sponchiado, S. R. P. (2012) · Applied Biochemistry and Biotechnology · doi:10.1007/s12010-012-9619-6 · Cited by 133
Towards the identification of the loci of adaptive evolution
Pardo‐Díaz, C., Salazar, C. A., & Jiggins, C. D. (2014) · Methods in Ecology and Evolution · doi:10.1111/2041-210x.12324 · Cited by 141
Genome Diversity and Evolution in the Budding Yeasts (Saccharomycotina)
Dujon, B., & Louis, E. J. (2017) · Genetics · doi:10.1534/genetics.116.199216 · Cited by 136
Hong, J., & Gresham, D. (2014) · PLoS Genetics · doi:10.1371/journal.pgen.1004041 · Cited by 128
The functional basis of adaptive evolution in chemostats
Gresham, D., & Hong, J. (2014) · FEMS Microbiology Reviews · doi:10.1111/1574-6976.12082 · Cited by 122
Experimental evidence for ecological selection on genome variation in the wild
Gompert, Z., Comeault, A. A., Farkas, T. E., Feder, J. L., Parchman, T. L., Buerkle, C. A., & Nosil, P. (2013) · Ecology Letters · doi:10.1111/ele.12238 · Cited by 122
The enduring utility of continuous culturing in experimental evolution
Gresham, D., & Dunham, M. J. (2014) · Genomics · doi:10.1016/j.ygeno.2014.09.015 · Cited by 129
Self-citationGenome plasticity in Candida albicans is driven by long repeat sequences
Todd, R. T., Wikoff, T. D., Forche, A., & Selmecki, A. (2019) · eLife · doi:10.7554/elife.45954 · Cited by 118
Zimmer, A., Durand, C., Loira, N., Durrens, P., Sherman, D. J., & Marullo, P. (2014) · PLoS ONE · doi:10.1371/journal.pone.0086298 · Cited by 124
Next‐generation sequencing as a tool to study microbial evolution
Brockhurst, M. A., Colegrave, N., & Rozen, D. E. (2010) · Molecular Ecology · doi:10.1111/j.1365-294x.2010.04835.x · Cited by 109
Babrzadeh, F., Jalili, R., Wang, C., Shokralla, S., Pierce, S. E., Robinson-Mosher, A., Nyrén, P., Shafer, R. W., Basso, L. C., de Amorim, H. V., et al. (2012) · Molecular Genetics and Genomics · doi:10.1007/s00438-012-0695-7 · Cited by 97
The Fitness Consequences of Aneuploidy Are Driven by Condition-Dependent Gene Effects
Sunshine, A. B., Payen, C., Ong, G. T., Liachko, I., Tan, K. M., & Dunham, M. J. (2015) · PLoS Biology · doi:10.1371/journal.pbio.1002155 · Cited by 96
Self-citationNosil, P., Parchman, T. L., Feder, J. L., & Gompert, Z. (2012) · BMC Evolutionary Biology · doi:10.1186/1471-2148-12-164 · Cited by 92
Experimental Evolution Reveals Favored Adaptive Routes to Cell Aggregation in Yeast
Hope, E. A., Amorosi, C. J., Miller, A. W., Dang, K., Heil, C. S., & Dunham, M. J. (2017) · Genetics · doi:10.1534/genetics.116.198895 · Cited by 90
Self-citationExperimental Evolution of a Facultative Thermophile from a Mesophilic Ancestor
Blaby, I. K., Lyons, B. J., Wroclawska-Hughes, E., Phillips, G. C. F., Pyle, T. P., Chamberlin, S. G., Benner, S. A., Lyons, T. J., de Crécy‐Lagard, V., & de Crécy, E. (2011) · Applied and Environmental Microbiology · doi:10.1128/aem.05773-11 · Cited by 86
Oud, B., Maris, A. J. A., Daran, J.-M., & Pronk, J. T. (2012) · FEMS Yeast Research · doi:10.1111/j.1567-1364.2011.00776.x · Cited by 82
Gerstein, A. C., Lo, D. S., & Otto, S. P. (2012) · Genetics · doi:10.1534/genetics.112.142620 · Cited by 80
Spor, A., Kvitek, D. J., Nidelet, T., Martin, J., Legrand, J., Dillmann, C., Bourgais, A., de Vienne, D., Sherlock, G., & Sicard, D. (2013) · Evolution · doi:10.1111/evo.12302 · Cited by 82
Next-generation sequencing and its potential impact on food microbial genomics
Solieri, L., Dakal, T. C., & Giudici, P. (2012) · Annals of Microbiology · doi:10.1007/s13213-012-0478-8 · Cited by 78
Payen, C., Rienzi, S. C. D., Ong, G. T., Pogachar, J. L., Sanchez, J. C., Sunshine, A. B., Raghuraman, M. K., Brewer, B. J., & Dunham, M. J. (2013) · G3 Genes Genomes Genetics · doi:10.1534/g3.113.009365 · Cited by 80
Self-citationThe Dynamic Fungal Genome: Polyploidy, Aneuploidy and Copy Number Variation in Response to Stress
Vande Zande, P., Zhou, X., & Selmecki, A. (2023) · Annual Review of Microbiology · doi:10.1146/annurev-micro-041320-112443 · Cited by 70
Birkeland, S. R., Jin, N., Ozdemir, A. C., Lyons, R. H., Weisman, L. S., & Wilson, T. E. (2010) · Genetics · doi:10.1534/genetics.110.123232 · Cited by 69
Demeke, M. M., Foulquié-Moreno, M. R., Dumortier, F. M., & Thevelein, J. M. (2015) · PLoS Genetics · doi:10.1371/journal.pgen.1005010 · Cited by 69
How Can we Identify Parasite Genes that Underlie Antimalarial Drug Resistance?
Anderson, T., Nkhoma, S. C., Ecker, A., & Fidock, D. A. (2010) · Pharmacogenomics · doi:10.2217/pgs.10.165 · Cited by 57
Brewer, B. J., Payen, C., Raghuraman, M. K., & Dunham, M. J. (2011) · PLoS Genetics · doi:10.1371/journal.pgen.1002016 · Cited by 55
Self-citationReams, A. B., Kofoid, E., Kugelberg, E., & Roth, J. R. (2012) · Genetics · doi:10.1534/genetics.112.142570 · Cited by 50
Genomic changes under rapid evolution: selection for parasitoid resistance
Jalvingh, K., Chang, P. L., Nuzhdin, S. V., & Wertheim, B. (2014) · Proceedings of the Royal Society B Biological Sciences · doi:10.1098/rspb.2013.2303 · Cited by 47
Origin-Dependent Inverted-Repeat Amplification: Tests of a Model for Inverted DNA Amplification
Brewer, B. J., Payen, C., Rienzi, S. C. D., Higgins, M. M., Ong, G. T., Dunham, M. J., & Raghuraman, M. K. (2015) · PLoS Genetics · doi:10.1371/journal.pgen.1005699 · Cited by 47
Self-citationLópez‐Malo, M., García‐Ríos, E., Melgar, B., Sánchez, M., Dunham, M. J., & Guillamón, J. M. (2015) · BMC Genomics · doi:10.1186/s12864-015-1755-2 · Cited by 45
Self-citationWhole genome profiling of spontaneous and chemically induced mutations in Toxoplasma gondii
Farrell, A., Coleman, B. I., Benenati, B., Brown, K. M., Blader, I. J., Marth, G., & Gubbels, M. (2014) · BMC Genomics · doi:10.1186/1471-2164-15-354 · Cited by 35
Genomics of Adaptation Depends on the Rate of Environmental Change in Experimental Yeast Populations
Gorter, F. A., Derks, M. F. L., van den Heuvel, J., Aarts, M. G. M., Zwaan, B. J., de Ridder, D., & de Visser, J. A. G. M. (2017) · Molecular Biology and Evolution · doi:10.1093/molbev/msx185 · Cited by 35
Phaneuf, P. V., Yurkovich, J. T., Heckmann, D., Wu, M., Sandberg, T. E., King, Z. A., Tan, J., Palsson, B. Ø., & Feist, A. M. (2020) · BMC Genomics · doi:10.1186/s12864-020-06920-4 · Cited by 32
Timmermann, B., Jarolim, S., Rußmayer, H., Kerick, M., Michel, S., Krüger, A., Bluemlein, K., Laun, P., Grillari, J., Lehrach, H., et al. (2010) · Aging · doi:10.18632/aging.100187 · Cited by 32
Differential paralog divergence modulates genome evolution across yeast species
Sanchez, M. R., Miller, A. W., Liachko, I., Sunshine, A. B., Lynch, B., Huang, M., Alcantara, E., DeSevo, C. G., Pai, D. A., Tucker, C. M., et al. (2017) · PLoS Genetics · doi:10.1371/journal.pgen.1006585 · Cited by 26
Self-citationExperimental evolution: its principles and applications in developing stress-tolerant yeasts
Swamy, K. B. S., & Zhou, N. (2019) · Applied Microbiology and Biotechnology · doi:10.1007/s00253-019-09616-2 · Cited by 25
Experimental Evolution and the Nature of Biodiversity
Kassen, R. (2024) · doi:10.1093/oso/9780192898661.001.0001 · Cited by 24
Ottilie, S., Luth, M. R., Hellemann, E., Goldgof, G. M., Vigil, E., Kumar, P., Cheung, A. L., Song, M., Godinez‐Macias, K. P., Carolino, K., et al. (2022) · Communications Biology · doi:10.1038/s42003-022-03076-7 · Cited by 23
Emerging Tools for Synthetic Genome Design
Lee, B.-R., Cho, S., Song, Y., Kim, S. C., & Cho, B. (2013) · Molecules and Cells · doi:10.1007/s10059-013-0127-5 · Cited by 22
From sequence to function: Insights from natural variation in budding yeasts
Nieduszynski, C. A., & Liti, G. (2011) · Biochimica et Biophysica Acta (BBA) - General Subjects · doi:10.1016/j.bbagen.2011.02.004 · Cited by 22
Kumar, R., Gyawali, A., Morrison, G. D., Saski, C. A., Robertson, D. J., Cook, D. D., Tharayil, N., Schaefer, R., Beissinger, T. M., & Sekhon, R. S. (2021) · Plant and Cell Physiology · doi:10.1093/pcp/pcab059 · Cited by 22
Thierry, A., Khanna, V., Créno, S., Lafontaine, I., Ma, L., Bouchier, C., & Dujon, B. (2015) · Nature Communications · doi:10.1038/ncomms7154 · Cited by 19
Martin, R., Espinoza, C. Y., Large, C. R. L., Rosswork, J., Bruinisse, C. V., Miller, A. W., Sanchez, J. C., Miller, M., Paskvan, S., Alvino, G. M., et al. (2024) · PLoS Genetics · doi:10.1371/journal.pgen.1010850 · Cited by 16
Self-citationComparative Functional Genomics of Stress Responses in Yeasts
Lelandais, G., & Devaux, F. (2010) · OMICS A Journal of Integrative Biology · doi:10.1089/omi.2010.0029 · Cited by 16
Dynamics of Dark-Fly Genome Under Environmental Selections
Izutsu, M., Toyoda, A., Fujiyama, A., Agata, K., & Fuse, N. (2015) · G3 Genes Genomes Genetics · doi:10.1534/g3.115.023549 · Cited by 17
Microbial experimental evolution in a massively multiplexed and high-throughput era
Jagdish, T., & Ba, A. N. N. (2022) · Current Opinion in Genetics & Development · doi:10.1016/j.gde.2022.101943 · Cited by 14
Basic principles of yeast genomics, a personal recollection: Graphical Abstract Figure.
Dujon, B. (2015) · FEMS Yeast Research · doi:10.1093/femsyr/fov047 · Cited by 14
Reams, A. B., Kofoid, E., Duleba, N., & Roth, J. R. (2013) · Genetics · doi:10.1534/genetics.113.158519 · Cited by 13
Pathogen Identification Using Novel Sequencing Methods
Raghavendra, P. B., & Pullaiah, T. (2018) · Elsevier eBooks · doi:10.1016/b978-0-12-813679-9.00007-5 · Cited by 12
Ecological Genomics of Adaptation and Speciation in Fungi
Leducq, J. (2013) · Advances in experimental medicine and biology · doi:10.1007/978-94-007-7347-9_4 · Cited by 11
Pandey, A. K., Kaur, H., & Gaur, N. A. (2025) · Renewable and Sustainable Energy Reviews · doi:10.1016/j.rser.2025.116266 · Cited by 10
A real-time digital-microfluidic platform for epigenetics
Ibrahim, M., Boswell, C., Chakrabarty, K., Scott, K., & Pajić, M. (2016) · International Conference on Compilers, Architecture, and Synthesis for Embedded Systems (CASES) · doi:10.1145/2968455.2968516 · Cited by 10
Application of simultaneous selective pressures slows adaptation
Merlo, L. M. F., Sprouffske, K., Howard, T. C., Gardiner, K. L., Caulin, A. F., Blum, S. M., Evans, P., Bedalov, A., Sniegowski, P., & Maley, C. C. (2020) · Evolutionary Applications · doi:10.1111/eva.13062 · Cited by 8
Tani, T., Taguchi, H., Fujimori, K. E., Sahara, T., Ohgiya, S., Kamagata, Y., & Akamatsu, T. (2016) · Journal of Bioscience and Bioengineering · doi:10.1016/j.jbiosc.2016.03.008 · Cited by 8
Experimental Microbial Evolution of Extremophiles
Blum, P., Rudrappa, D., Singh, R., McCarthy, S., & Pavlik, B. J. (2016) · Grand challenges in biology and biotechnology · doi:10.1007/978-3-319-13521-2_22 · Cited by 8
Massive Amplification at an Unselected Locus Accompanies Complex Chromosomal Rearrangements in Yeast
Thierry, A., Khanna, V., & Dujon, B. (2016) · G3 Genes Genomes Genetics · doi:10.1534/g3.115.024547 · Cited by 7
An improved algorithm for inferring mutational parameters from bar-seq evolution experiments
Li, F., Mahadevan, A., & Sherlock, G. (2023) · BMC Genomics · doi:10.1186/s12864-023-09345-x · Cited by 6
The evolution of gene expression regulatory networks in yeasts
Lelandais, G., Goudot, C., & Devaux, F. (2011) · Comptes Rendus Biologies · doi:10.1016/j.crvi.2011.05.014 · Cited by 6
Chandler, C. H. (2014) · G3 Genes Genomes Genetics · doi:10.1534/g3.114.012914 · Cited by 6
High-Throughput Yeast Strain SequencingPreprint
Schwartz, K., & Sherlock, G. (2016) · Cold Spring Harbor Protocols · doi:10.1101/pdb.top077651 · Cited by 6
Evolutionary Engineering for Industrial Microbiology
Vanee, N., Fisher, A. B., & Fong, S. S. (2012) · Sub-cellular biochemistry/Subcellular biochemistry · doi:10.1007/978-94-007-5055-5_3 · Cited by 5
Speciation genetics: Limits and promises
Karrenberg, S. (2010) · Taxon · doi:10.1002/tax.595007 · Cited by 5
Hector, R. E., Mertens, J. A., & Nichols, N. N. (2022) · Fermentation · doi:10.3390/fermentation8120669 · Cited by 4
Hoerr, R. E., Eng, A., Payen, C., Rienzi, S. C. D., Raghuraman, M. K., Dunham, M. J., Brewer, B. J., & Friedman, K. L. (2023) · Genetics · doi:10.1093/genetics/iyad010 · Cited by 3
Self-citationMukherjee, S., Thompson, L. K., Godin, S., Schackwitz, W., Lipzen, A., Martin, J., & Blanchard, J. L. (2014) · PLoS ONE · doi:10.1371/journal.pone.0086731 · Cited by 4
Toward a Functional Genetics of Adaptation: Insights From Microbial Experimental Evolution
Kassen, R. (2026) · Genome Biology and Evolution · doi:10.1093/gbe/evag158 · Cited by 2
Longan, E. R., & Fay, J. C. (2024) · Genetics · doi:10.1093/genetics/iyae160 · Cited by 2
Ahmadikhah, A., Kheiavi, E. K., & Mosammam, A. M. (2016) · Journal of Data Mining in Genomics & Proteomics · doi:10.4172/2153-0602.1000199 · Cited by 2
Kassen, R. (2024) · Oxford University Press eBooks · doi:10.1093/oso/9780192898661.003.0003 · Cited by 1
Effect of aneuploidy on cellular adaptation to hyper-osmotic and ionic stress
Natali, F. (2022) · DR-NTU (Nanyang Technological University) · doi:10.32657/10356/161063 · Cited by 1
Genomic Analysis of Chronic Heat Stress Resistance in the Nematode Caenorhabditis remanei
Claridge, S. E. (2017) · Scholars' Bank (University of Oregon)
Hube, B., & Brunke, S. (2017) · Faculty Opinions – Post-Publication Peer Review of the Biomedical Literature · doi:10.3410/f.727562646.793538535
Kassen, R. (2024) · Oxford University Press eBooks · doi:10.1093/oso/9780192898661.003.0008
Kassen, R. (2024) · Oxford University Press eBooks · doi:10.1093/oso/9780192898661.002.0006
Kassen, R. (2024) · Oxford University Press eBooks · doi:10.1093/oso/9780192898661.002.0004
An Introduction to Microbial Experimental Evolution
Kassen, R. (2024) · Oxford University Press eBooks · doi:10.1093/oso/9780192898661.003.0001
Kassen, R. (2024) · Oxford University Press eBooks · doi:10.1093/oso/9780192898661.003.0012
Coevolutionary Diversification
Kassen, R. (2024) · Oxford University Press eBooks · doi:10.1093/oso/9780192898661.003.0009
Kassen, R. (2024) · Oxford University Press eBooks · doi:10.1093/oso/9780192898661.002.0003
Kassen, R. (2024) · Oxford University Press eBooks · doi:10.1093/oso/9780192898661.003.0006
Adaptation to a Single Environment
Kassen, R. (2024) · Oxford University Press eBooks · doi:10.1093/oso/9780192898661.003.0002
Selection in Variable Environments
Kassen, R. (2024) · Oxford University Press eBooks · doi:10.1093/oso/9780192898661.003.0004
Metadata
- Authors
- Araya, C. L., Payen, C., Dunham, M. J., & Fields, S.
- Affiliations
- University of Washington (US)
- Howard Hughes Medical Institute (US)
- Corresponding author
- Fields, Stanley
- Venue
- BMC Genomics
- Published
- 2010-02-03
- Volume
- 11
- Issue
- 1
- Pages
- 88-88
- ISSN
- 1471-2164 (ISSN-L)
- PMC
- PMC2829512
- OpenAlex
- W2162383089
- Cited by
- 113
- References
- 37
- Citations by year
- 2026: 4 · 2025: 1 · 2024: 21 · 2023: 3 · 2022: 4 · 2021: 1 · 2020: 3 · 2019: 3 · 2018: 2 · 2017: 8 · 2016: 6 · 2015: 10 · 2014: 9 · 2013: 10 · 2012: 10
- FWCI
- 4.95
- Type
- journal article
- Language
- en
- Open access
- gold
- doi.org
- Licence
- cc-by
- Locations
- BMC Genomics (publishedVersion, cc-by)
- PubMed Central (publishedVersion, cc-by)
- PubMed (publishedVersion)
- DOAJ (DOAJ: Directory of Open Access Journals) (submittedVersion)
- Funders
- Howard Hughes Medical Institute
- Topics
- Life Sciences › Biochemistry, Genetics and Molecular Biology › Molecular Biology › Genomics and Phylogenetic Studies
- Life Sciences › Biochemistry, Genetics and Molecular Biology › Molecular Biology › Fungal and yeast genetics research
- Life Sciences › Biochemistry, Genetics and Molecular Biology › Genetics › Evolution and Genetic Dynamics
- Keywords
- experimental evolution, Saccharomyces cerevisiae, single nucleotide polymorphisms, copy number amplification, gene amplification, genome rearrangement, genome plasticity, structural variants, mutagenesis screen
- MeSH terms
- Algorithms, DNA, Fungal, Saccharomyces cerevisiae, Genomic Library, Genome, Fungal, Point Mutation, Sequence Analysis, DNA, Gene Dosage, Evolution, Molecular, Polymorphism, Single Nucleotide, Chromosome Breakpoints
About these checks
Registry, retraction, Cites and statistics results are computed, not judged, with one exception: a printed reference that no index lists is read once by a model before it counts as a citation error. Claims are extracted by a model and kept only when their quote appears verbatim in the text; each cited source is then checked, with a model’s help, for whether it says what the claim relies on. Those verdicts can be wrong — read the claim’s quote and the cited source before relying on one.
Statistics and arithmetic are recomputed, not judged.
Confidence bands are shown only for fields calibrated on our annotated test set. None is calibrated yet, so no band is shown.
What counts as a claim ›How we measure confidence ›How we check this ›
Are you an author, or do you see a problem with this page? Request a review
