

The DOI matches its Crossref record; 114 of the 114 references it cites were found in a registry or an index.
Phylogenetic distribution of translational GTPases in bacteria
Open accessAbstract
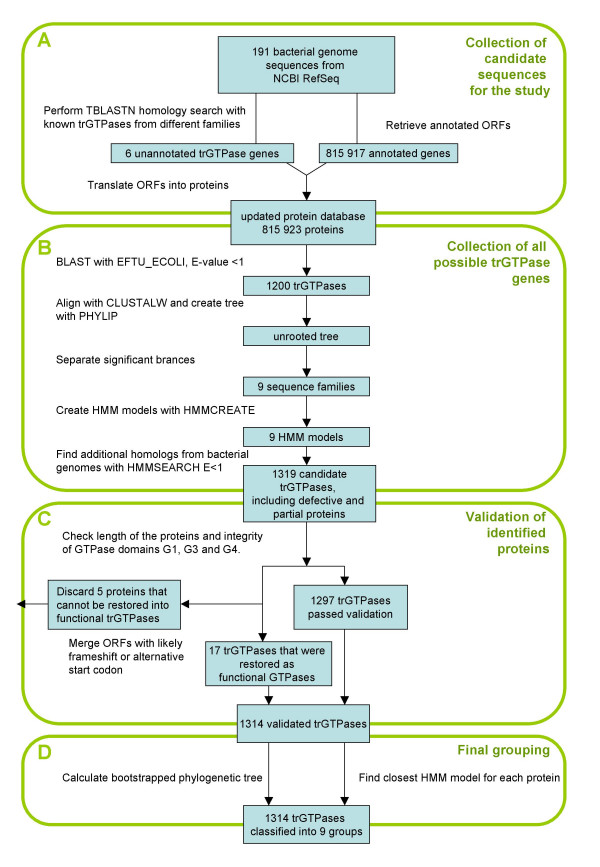
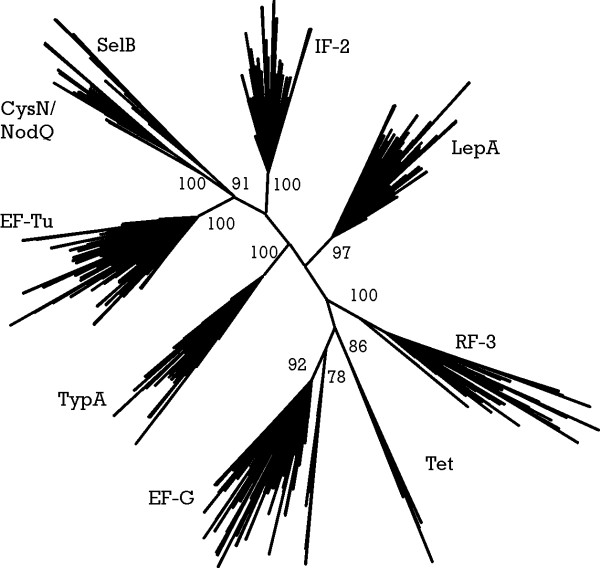
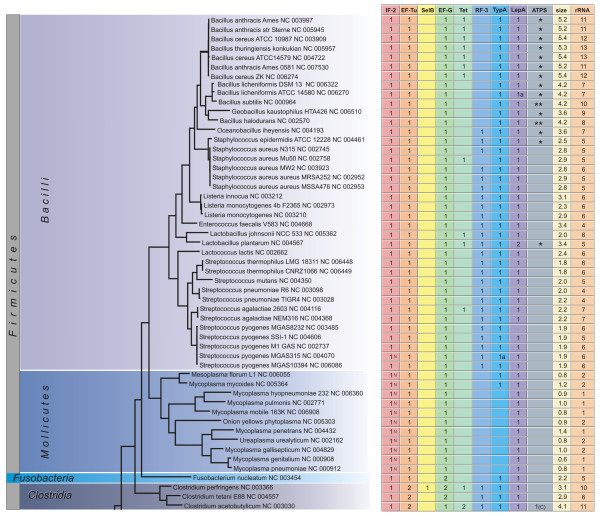
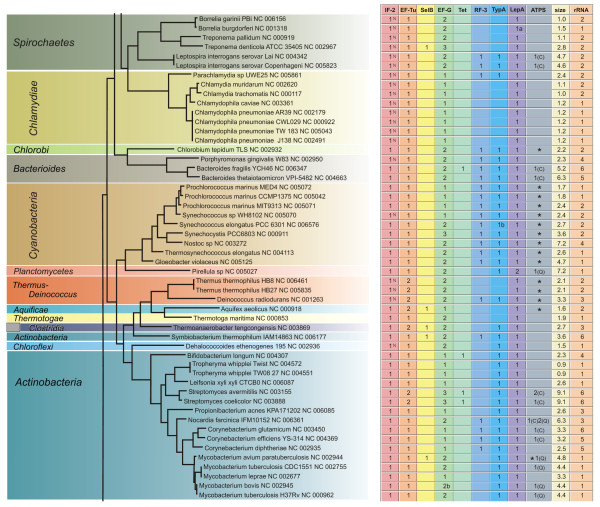
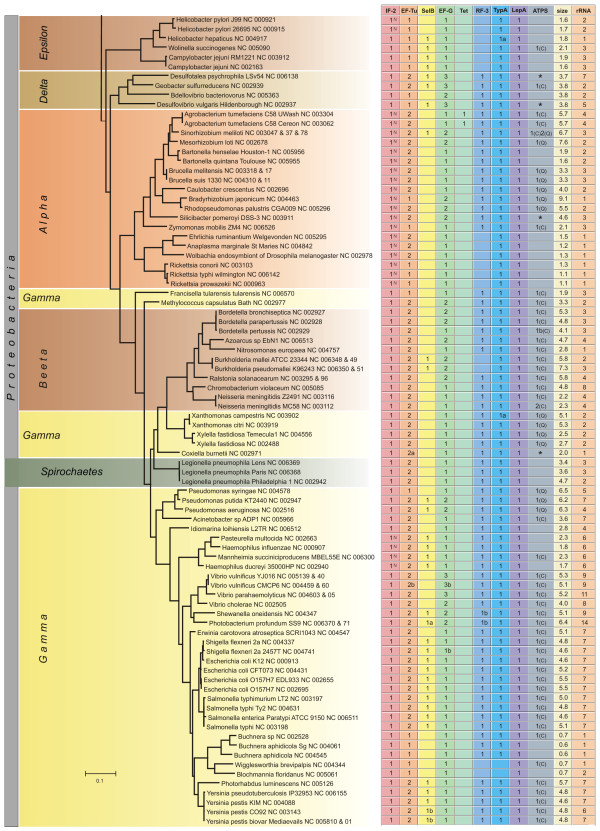
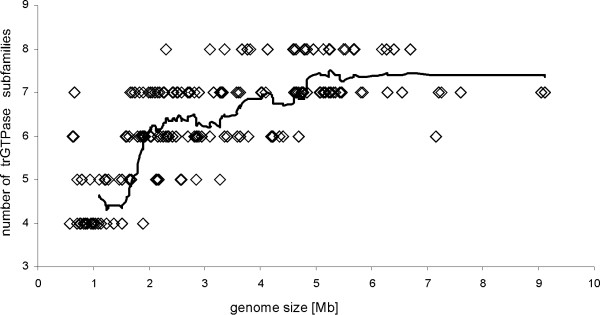
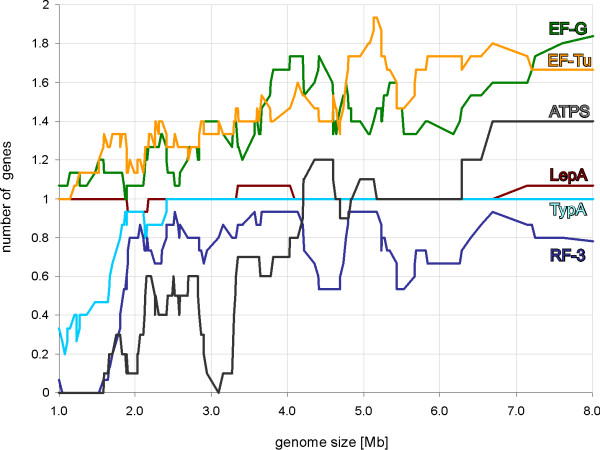
Background: Translational GTPases are a family of proteins in which GTPase activity is stimulated by the large ribosomal subunit. Conserved sequence features allow members of this family to be identified. Results: To achieve accurate protein identification and grouping we have developed a method combining searches with Hidden Markov Model profiles and tree based grouping. We found all the genes for translational GTPases in 191 fully sequenced bacterial genomes. The protein sequences were grouped into nine subfamilies. Analysis of the results shows that three translational GTPases, the translation factors EF-Tu, EF-G and IF2, are present in all organisms examined. In addition, several copies of the genes encoding EF-Tu and EF-G are present in some genomes. In the case of multiple genes for EF-Tu, the gene copies are nearly identical; in the case of multiple EF-G genes, the gene copies have been considerably diverged. The fourth translational GTPase, LepA, the function of which is currently unknown, is also nearly universally conserved in bacteria, being absent from only one organism out of the 191 analyzed. The translation regulator, TypA, is also present in most of the organisms examined, being absent only from bacteria with small genomes. Surprisingly, some of the well studied translational GTPases are present only in a very small number of bacteria. The translation termination factor RF3 is absent from many groups of bacteria with both small and large genomes. The specialized translation factor for selenocysteine incorporation – SelB – was found in only 39 organisms. Similarly, the tetracycline resistance proteins (Tet) are present only in a small number of species. Proteins of the CysN/NodQ subfamily have acquired functions in sulfur metabolism and production of signaling molecules. The genes coding for CysN/NodQ proteins were found in 74 genomes. This protein subfamily is not confined to Proteobacteria, as suggested previously but present also in many other groups of bacteria. Conclusion: Four of the translational GTPase subfamilies (IF2, EF-Tu, EF-G and LepA) are represented by at least one member in each bacterium studied, with one exception in LepA. This defines the set of translational GTPases essential for basic cell functions.
Overview
The claims and statistics of this paper haven’t been checked yet.
Run the check — free, no account needed. It reads the open-access text and checks the sources it cites.
Integrity signals
Registry
Cites
Statistics
Figures
Verification
Claims the paper makes
The claims and statistics of this paper haven’t been checked yet.
Run the check — free, no account needed. It reads the open-access text and checks the sources it cites.
Claims other papers make about this one
Each is checked against this paper’s own text: does it say what the citing paper says it does?
In the citing paper
“Tetracycline resistance protein Tet(O), which protects the bacterial ribosome from binding the antibiotic tetracycline, is a translational GTPase with significant similarity in both sequence and structure to the elongation factor EF-G.”
From Mechanism of tetracycline resistance by ribosomal protection protein Tet(O) (2013) · cites this paper as [6]
In the citing paper
“Tetracycline resistance protein Tet(O), which protects the bacterial ribosome from binding the antibiotic tetracycline, is a translational GTPase with significant similarity in both sequence and structure to the elongation factor EF-G.”
From Mechanism of tetracycline resistance by ribosomal protection protein Tet(O) (2013) · cites this paper as [6]
In the citing paper
“Several of these proteins–the best-known being Tet(M) and Tet(O) – are paralogs of the translational GTPase EF-G 6 and actively remove Tc from the ribosome in a GTP-hydrolysis-dependent fashion 7,8.”
From Mechanism of tetracycline resistance by ribosomal protection protein Tet(O) (2013) · cites this paper as [6]
Self-check
Percentages, sums and reported differences re-computed from the paper’s own numbers.
The self-check needs the paper’s full text.
Citations
Cites
1 retracted
A dedicated translation factor controls the synthesis of the global regulator Fis
Owens, R. M., Pritchard, G., Skipp, P. J. S., Hodey, M., Connell, S. R., Nierhaus, K. H., & O’Connor, C. D. (2004) · The EMBO Journal · doi:10.1038/sj.emboj.7600343 · Cited by 51
RetractedGapped BLAST and PSI-BLAST: a new generation of protein database search programs
Altschul, S. (1997) · Nucleic Acids Research · doi:10.1093/nar/25.17.3389 · Cited by 73,302
Thompson, J. D., Higgins, D. G., & Gibson, T. J. (1994) · Nucleic Acids Research · doi:10.1093/nar/22.22.4673 · Cited by 64,617
PHYLIP-Phylogeny inference package (Version 3.2)
Felsenstein, J. (1989) · Cladistics · Cited by 17,682
The Pfam Protein Families Database
Bateman, A. G. (2002) · Nucleic Acids Research · doi:10.1093/nar/30.1.276 · Cited by 14,075
MEGA3: Integrated software for Molecular Evolutionary Genetics Analysis and sequence alignment
Kumar, S. (2004) · Briefings in Bioinformatics · doi:10.1093/bib/5.2.150 · Cited by 11,674
EMBOSS: the European molecular biology open software suite.
Rice, P., Longden, I., & Bleasby, A. (2000) · Trends in Genetics · doi:10.1016/s0168-9525(00)02024-2 · Cited by 9,466
Eddy, S. R. (1998) · Bioinformatics · doi:10.1093/bioinformatics/14.9.755 · Cited by 5,515
Chopra, I., & Roberts, M. (2001) · Microbiology and Molecular Biology Reviews · doi:10.1128/mmbr.65.2.232-260.2001 · Cited by 4,517
Pruitt, K. D., Tatusova, T. A., & Maglott, D. R. (2006) · Nucleic Acids Research · doi:10.1093/nar/gkl842 · Cited by 4,441
Research works printed but not linked: 1
- Garrity GM Bell, J. A., Lilburn, T. G.: Taxonomic Outline of the Procaryotes. Bergey's Manual of Systematic Bacteriology, Second Edition. 2004, Springer-Verlag, 5:
Cited by
Sorted by citations
Stiffening hydrogels to probe short- and long-term cellular responses to dynamic mechanics
Guvendiren, M., & Burdick, J. A. (2012) · Nature Communications · doi:10.1038/ncomms1792 · Cited by 707
Structure-Function Relationships of the G Domain, a Canonical Switch Motif
Wittinghofer, A., & Vetter, I. R. (2011) · Annual Review of Biochemistry · doi:10.1146/annurev-biochem-062708-134043 · Cited by 470
The Mechanism for Activation of GTP Hydrolysis on the Ribosome
Voorhees, R. M., Schmeing, T. M., Kelley, A. C., & Ramakrishnan, V. (2010) · Science · doi:10.1126/science.1194460 · Cited by 366
The bacterial translation stress response.
Starosta, A. L., Lassak, J., Jung, K., & Wilson, D. N. (2014) · FEMS Microbiology Reviews · doi:10.1111/1574-6976.12083 · Cited by 210
Barret, M., Morrissey, J. P., & O’Gara, F. (2011) · Biology and Fertility of Soils · doi:10.1007/s00374-011-0605-x · Cited by 212
The Weird and Wonderful World of Bacterial Ribosome Regulation
Wilson, D. N., & Nierhaus, K. H. (2007) · Critical Reviews in Biochemistry and Molecular Biology · doi:10.1080/10409230701360843 · Cited by 208
The magic dance of the alarmones (p)ppGpp
Steinchen, W., & Bange, G. (2016) · Molecular Microbiology · doi:10.1111/mmi.13412 · Cited by 173
Direct binding targets of the stringent response alarmone (p)ppGpp
Kanjee, U., Ogata, K., & Houry, W. A. (2012) · Molecular Microbiology · doi:10.1111/j.1365-2958.2012.08177.x · Cited by 172
FERNANDES, P. B. (2016) · Cold Spring Harbor Perspectives in Medicine · doi:10.1101/cshperspect.a025437 · Cited by 164
Mechanism of tetracycline resistance by ribosomal protection protein Tet(O)
Li, W., Atkinson, G. C., Thakor, N. S., Allas, Ü., Lu, C.-C., Chan, K.-Y., Tenson, T., Schulten, K., Wilson, K. S., Hauryliuk, V., et al. (2013) · Nature Communications · doi:10.1038/ncomms2470 · Cited by 147
Self-citationMechanically reinforced injectable bioactive nanocomposite hydrogels for in-situ bone regeneration
Yu, X., Wang, X., Li, D., Sheng, R., Qian, Y., Zhu, R., Wang, X., & Lin, K. (2021) · Chemical Engineering Journal · doi:10.1016/j.cej.2021.132799 · Cited by 130
Antimicrobial Resistance in Campylobacter spp
Shen, Z., Wang, Y., Zhang, Q., & Shen, J. (2018) · Microbiology Spectrum · doi:10.1128/microbiolspec.arba-0013-2017 · Cited by 126
Atkinson, G. C., Baldauf, S. L., & Hauryliuk, V. (2008) · BMC Evolutionary Biology · doi:10.1186/1471-2148-8-290 · Cited by 113
Protein translation in Plasmodium parasites.
Jackson, K. E., Habib, S., Frugier, M., Hoen, R., Khan, S., Pham, J. S., de Pouplana, L. R., Royo, M., Santos, M. A. S., Sharma, A., et al. (2011) · Trends in Parasitology · doi:10.1016/j.pt.2011.05.005 · Cited by 99
Liu, X., Rodermel, S. R., & Yu, F. (2010) · BMC Plant Biology · doi:10.1186/1471-2229-10-287 · Cited by 93
Korkmaz, G., Holm, M., Wiens, T., & Sanyal, S. (2014) · Journal of Biological Chemistry · doi:10.1074/jbc.m114.606632 · Cited by 87
Yu, J., Xu, L., Li, K., Xie, N., Xi, Y., Wang, Y., Zheng, X., Chen, X., Wang, M., & Ye, X. (2017) · Scientific Reports · doi:10.1038/s41598-017-03661-5 · Cited by 87
Functions and Regulation of Translation Elongation Factors
Xu, B., Liu, L., & Song, G. (2022) · Frontiers in Molecular Biosciences · doi:10.3389/fmolb.2021.816398 · Cited by 94
The conserved GTPase LepA contributes mainly to translation initiation in Escherichia coli
Balakrishnan, R., Oman, K. M., Shoji, S., Bundschuh, R. A., & Fredrick, K. (2014) · Nucleic Acids Research · doi:10.1093/nar/gku1098 · Cited by 74
The structure of LepA, the ribosomal back translocase
Evans, R. N., Blaha, G. M., Bailey, S., & Steitz, T. A. (2008) · Proceedings of the National Academy of Sciences · doi:10.1073/pnas.0801308105 · Cited by 73
A new tRNA intermediate revealed on the ribosome during EF4-mediated back-translocation
Connell, S. R., Topf, M., Qin, Y., Wilson, D. N., Mielke, T., Fucini, P., Nierhaus, K. H., & Spahn, C. M. T. (2008) · Nature Structural & Molecular Biology · doi:10.1038/nsmb.1469 · Cited by 71
Chen, P., Zhou, H., Huang, Y., Xie, Z., Zhang, M., Wei, Y., Li, J., Ma, Y., Luo, M., Ding, W., et al. (2021) · Genome biology · doi:10.1186/s13059-021-02408-w · Cited by 69
The Membrane-bound GTPase Guf1 Promotes Mitochondrial Protein Synthesis under Suboptimal Conditions
Bauerschmitt, H., Funes, S., & Herrmann, J. M. (2008) · Journal of Biological Chemistry · doi:10.1074/jbc.m710037200 · Cited by 69
Zaher, H. S., & Green, R. (2011) · Cell · doi:10.1016/j.cell.2011.08.045 · Cited by 65
Atkinson, G. (2015) · BMC Genomics · doi:10.1186/s12864-015-1289-7 · Cited by 51
Guo, Q., Yuan, Y. D., Xu, Y., Feng, B., Liu, L., Chen, K., Sun, M., Yang, Z., Lei, J., & Gao, N. (2011) · Proceedings of the National Academy of Sciences · doi:10.1073/pnas.1104645108 · Cited by 57
Gibbs, M. R., Moon, K., Chen, M., Balakrishnan, R., Foster, L. J., & Fredrick, K. L. (2017) · Proceedings of the National Academy of Sciences · doi:10.1073/pnas.1613665114 · Cited by 58
Salmonella entericaSerovar Typhimurium BipA Exhibits Two Distinct Ribosome Binding Modes
deLivron, M. A., & Robinson, V. L. (2008) · Journal of Bacteriology · doi:10.1128/jb.00763-08 · Cited by 54
Impact of C‐terminal amino acid composition on protein expression in bacteria
Weber, M. L., Burgos, R., Yus, E., Yang, J., Lluch‐Senar, M., & Serrano, L. G. (2020) · Molecular Systems Biology · doi:10.15252/msb.20199208 · Cited by 54
Shoji, S., Janssen, B. D., Hayes, C. S., & Fredrick, K. L. (2009) · Biochimie · doi:10.1016/j.biochi.2009.11.002 · Cited by 53
Post-termination Ribosome Intermediate Acts as the Gateway to Ribosome Recycling
Prabhakar, A., Capece, M. C., Petrov, A. N., Choi, J., & Puglisi, J. D. (2017) · Cell Reports · doi:10.1016/j.celrep.2017.06.028 · Cited by 50
Understanding chloroplast biogenesis using second-site suppressors of immutans and var2
Putarjunan, A., Liu, X., Nolan, T. M., Yu, F., & Rodermel, S. R. (2013) · Photosynthesis Research · doi:10.1007/s11120-013-9855-9 · Cited by 49
Mammalian elongation factor 4 regulates mitochondrial translation essential for spermatogenesis
Gao, Y., Bai, X., Zhang, D., Han, C., Yuan, J., Liu, W., Cao, X., Chen, Z., Shangguan, F., Zhu, Z., et al. (2016) · Nature Structural & Molecular Biology · doi:10.1038/nsmb.3206 · Cited by 49
Host ecology regulates interspecies recombination in bacteria of the genus Campylobacter
Mourkas, E., Yahara, K., Bayliss, S., Calland, J., Johansson, H., Mageiros, L., Muñoz-Ramírez, Z. Y., Futcher, G., Méric, G., Hitchings, M. D., et al. (2022) · eLife · doi:10.7554/elife.73552 · Cited by 45
Mitochondrial regulation during male germ cell development
Wang, X., Yin, L., Wen, Y., & Yuan, S. (2022) · Cellular and Molecular Life Sciences · doi:10.1007/s00018-022-04134-3 · Cited by 50
Sabbagh, S. C., Lepage, C., McClelland, M., & Daigle, F. (2012) · PLoS ONE · doi:10.1371/journal.pone.0036643 · Cited by 45
Structure of BipA in GTP form bound to the ratcheted ribosome
Kumar, V., Chen, Y., Ero, R., Ahmed, T. U., Tan, J., Li, Z., Wong, A. S. W., Bhushan, S., & Gao, Y. (2015) · Proceedings of the National Academy of Sciences · doi:10.1073/pnas.1513216112 · Cited by 42
RF3:GTP promotes rapid dissociation of the class 1 termination factor
Koutmou, K. S., McDonald, M. E., Brunelle, J. L., & Green, R. (2014) · RNA · doi:10.1261/rna.042523.113 · Cited by 43
Evolution of Elongation Factor G and the Origins of Mitochondrial and Chloroplast Forms
Atkinson, G. C., & Baldauf, S. L. (2010) · Molecular Biology and Evolution · doi:10.1093/molbev/msq316 · Cited by 43
Krishnan, K., & Flower, A. M. (2008) · Journal of Bacteriology · doi:10.1128/jb.00835-08 · Cited by 39
GTPases in bacterial cell polarity and signalling
Bulyha, I., Hot, E., Huntley, S., & Søgaard‐Andersen, L. (2011) · Current Opinion in Microbiology · doi:10.1016/j.mib.2011.09.001 · Cited by 36
Eiler, D. R., Lin, J., Simonetti, A., Klaholz, B. P., & Steitz, T. A. (2013) · Proceedings of the National Academy of Sciences · doi:10.1073/pnas.1309360110 · Cited by 37
Fan, H., Hahm, J., Diggs, S., Perry, J. J. P., & Blaha, G. M. (2015) · Journal of Biological Chemistry · doi:10.1074/jbc.m115.659136 · Cited by 37
Prabhakar, A., Choi, J., Wang, J., Petrov, A. N., & Puglisi, J. D. (2017) · Protein Science · doi:10.1002/pro.3190 · Cited by 37
Translation in Giant Viruses: A Unique Mixture of Bacterial and Eukaryotic Termination Schemes
Jeudy, S., Abergel, C., Claverie, J., & Legendre, M. (2012) · PLoS Genetics · doi:10.1371/journal.pgen.1003122 · Cited by 35
Wang, F., Zhong, N., GAO, P., WANG, G., WANG, H., & Xia, G. (2008) · Plant Cell & Environment · doi:10.1111/j.1365-3040.2008.01810.x · Cited by 35
Distinct Roles for Release Factor 1 and Release Factor 2 in Translational Quality Control
Petropoulos, A. D., McDonald, M. E., Green, R., & Zaher, H. S. (2014) · Journal of Biological Chemistry · doi:10.1074/jbc.m114.564989 · Cited by 34
Gibbs, M. R., & Fredrick, K. L. (2017) · Molecular Microbiology · doi:10.1111/mmi.13895 · Cited by 34
Efficient Assembly of Ribosomes Is Inhibited by Deletion of bipA in Escherichia coli
Choudhury, P., & Flower, A. M. (2015) · Journal of Bacteriology · doi:10.1128/jb.00023-15 · Cited by 32
Role of a ribosomal RNA phosphate oxygen during the EF-G–triggered GTP hydrolysis
Koch, M., Flür, S., Kreutz, C., Ennifar, E., Micura, R., & Polacek, N. (2015) · Proceedings of the National Academy of Sciences · doi:10.1073/pnas.1505231112 · Cited by 30
Hauryliuk, V., Mitkevich, V. A., Draycheva, A., Tankov, S., Shyp, V., Ermakov, A., Kulikova, A. A., Makarov, A. А., & Ehrenberg, M. (2009) · Journal of Molecular Biology · doi:10.1016/j.jmb.2009.10.015 · Cited by 30
Translation in Organelles of Apicomplexan Parasites.
Habib, S., Vaishya, S., & Gupta, K. (2016) · Trends in Parasitology · doi:10.1016/j.pt.2016.07.005 · Cited by 27
Choi, E., & Hwang, J. (2018) · Journal of Biological Chemistry · doi:10.1074/jbc.ra118.002295 · Cited by 29
Suematsu, T., Yokobori, S., Morita, H., Yoshinari, S., Ueda, T., Kita, K., Takeuchi, N., & Watanabe, Y. (2010) · Molecular Microbiology · doi:10.1111/j.1365-2958.2010.07067.x · Cited by 29
deLivron, M. A., Makanji, H. S., Lane, M. C., & Robinson, V. L. (2009) · Biochemistry · doi:10.1021/bi901026z · Cited by 29
The paradox of elongation factor 4: highly conserved, yet of no physiological significance?
Zhang, D., & Qin, Y. (2013) · Biochemical Journal · doi:10.1042/bj20121792 · Cited by 25
Distinct mechanisms of the human mitoribosome recycling and antibiotic resistance
Koripella, R. K., Deep, A., Agrawal, E. K., Keshavan, P., Banavali, N. K., & Agrawal, R. K. (2021) · Nature Communications · doi:10.1038/s41467-021-23726-4 · Cited by 24
Differential gene expression during somatic embryogenesis in the maize (Zea mays L.) inbred line H99
Sun, L., Wu, Y., Su, S., Liu, H., Yang, G., Li, S., Shan, X., & Yuan, Y. (2011) · Plant Cell Tissue and Organ Culture (PCTOC) · doi:10.1007/s11240-011-0093-6 · Cited by 23
Zhu, P., Liu, Y., Zhang, F., Bai, X., Chen, Z., Shangguan, F., Zhang, B., Zhang, L., Chen, Q., Xie, D., et al. (2018) · Cancer Research · doi:10.1158/0008-5472.can-17-2059 · Cited by 20
Santos, T. D. P., Álvarez, L., Sit, B., Irazoki, O., Blake, J., Warner, B. R., Warr, A. R., Bala, A., Beneš, V., Waldor, M. K., et al. (2021) · eLife · doi:10.7554/elife.60607 · Cited by 21
Two Homologous EF-G Proteins from Pseudomonas aeruginosa Exhibit Distinct Functions
Palmer, S. O., Rangel, E. Y., Hu, Y., Tran, A. T., & Bullard, J. M. (2013) · PLoS ONE · doi:10.1371/journal.pone.0080252 · Cited by 20
Ero, R., Kumar, V., Chen, Y., & Gao, Y. (2016) · RNA Biology · doi:10.1080/15476286.2016.1201627 · Cited by 20
Di, D., Jiang, H. B., Tian, L.-L., Kang, J.-L., Zhang, W., Yi, X.-P., Ye, F., Zhong, Q., Ni, B., He, Y.-Y., et al. (2016) · BMC Genomics · doi:10.1186/s12864-016-3076-5 · Cited by 19
Taking a Step Back from Back-Translocation: an Integrative View of LepA/EF4's Cellular Function
Heller, J. L. E., Kamalampeta, R., & Wieden, H. (2017) · Molecular and Cellular Biology · doi:10.1128/mcb.00653-16 · Cited by 18
Choi, E., Jeon, H., Oh, J., & Hwang, J. (2020) · Frontiers in Microbiology · doi:10.3389/fmicb.2019.02982 · Cited by 18
Bacterial RF3 Senses Chaperone Function in Co-Translational Folding
Zhao, L., Castanié‐Cornet, M., Kumar, S., Genevaux, P., Hayer-Hartl, M. K., & Hartl, F. U. (2020) · Molecular Cell · doi:10.1016/j.molcel.2021.05.016 · Cited by 16
Chakraborty, A., Halder, S., Kishore, P., Saha, D., Saha, S., Sikder, K., & Basu, A. (2022) · Genes to Cells · doi:10.1111/gtc.12942 · Cited by 15
Margus, T., Remm, M., & Tenson, T. (2011) · PLoS ONE · doi:10.1371/journal.pone.0022789 · Cited by 17
Self-citationChoi, E., Jeon, H., Oh, C., & Hwang, J. (2020) · Frontiers in Microbiology · doi:10.3389/fmicb.2020.597515 · Cited by 16
Mechanisms of ribosome recycling in bacteria and mitochondria: a structural perspective
Seely, S. M., & Gagnon, M. G. (2022) · RNA Biology · doi:10.1080/15476286.2022.2067712 · Cited by 16
Structure of the GTP Form of Elongation Factor 4 (EF4) Bound to the Ribosome
Kumar, V., Ero, R., Ahmed, T. U., Goh, K. J., Yin, Z., Bhushan, S., & Gao, Y. (2016) · Journal of Biological Chemistry · doi:10.1074/jbc.m116.725945 · Cited by 16
Vaishya, S., Kumar, V., Gupta, A., Siddiqi, M. I., & Habib, S. (2016) · Molecular Microbiology · doi:10.1111/mmi.13369 · Cited by 16
Interactions of release factor RF3 with the translation machinery
O’Connor, M. (2015) · Molecular Genetics and Genomics · doi:10.1007/s00438-015-0994-x · Cited by 15
Laurentiis, E. I. D., & Wieden, H. (2015) · Scientific Reports · doi:10.1038/srep08573 · Cited by 15
Badu-Nkansah, A., & Sello, J. K. (2010) · FEMS Microbiology Letters · doi:10.1111/j.1574-6968.2010.02083.x · Cited by 15
Liu, P., Myo, T., Ma, W., Lan, D., Qi, T., Guo, J., Song, P., Guo, J., & Kang, Z. (2016) · Frontiers in Plant Science · doi:10.3389/fpls.2016.00873 · Cited by 13
Simultaneous gene inactivation and promoter reporting in cyanobacteria
Chen, K., Xu, X., Gu, L., Hildreth, M. B., & Zhou, R. (2014) · Applied Microbiology and Biotechnology · doi:10.1007/s00253-014-6209-2 · Cited by 11
Liu, B., & Chen, C. (2018) · Antimicrobial Agents and Chemotherapy · doi:10.1128/aac.02356-17 · Cited by 10
RetractedOn the Nature of the Last Common Ancestor: A Story from its Translation Machinery
Rivas, M., & Fox, G. E. (2024) · Journal of Molecular Evolution · doi:10.1007/s00239-024-10199-4 · Cited by 8
Single-molecule FRET studies on interactions between elongation factor 4 (LepA) and ribosomes
Peng, S., Sun, R., Wang, W., & Chen, C. (2017) · Chinese Chemical Letters · doi:10.1016/j.cclet.2017.12.006 · Cited by 8
First-principles model of optimal translation factors stoichiometry
Lalanne, J., & Li, G. (2021) · eLife · doi:10.7554/elife.69222 · Cited by 8
Proteomic analysis revealed the survival strategy of Coxiella burnetii to doxycycline exposure
Zúñiga-Navarrete, F., Flores‐Ramírez, G., Danchenko, M., Benada, O., Škríba, A., & Škultéty, Ľ. (2019) · Journal of Proteomics · doi:10.1016/j.jprot.2019.103479 · Cited by 8
Choi, E., Huh, A., & Hwang, J. (2023) · Frontiers in Molecular Biosciences · doi:10.3389/fmolb.2023.1175889 · Cited by 6
Question 6: Early Steps of Evolution and Some Ideas About a Simplified Translational Machinery
Nierhaus, K. H. (2007) · Origins of Life and Evolution of Biospheres · doi:10.1007/s11084-007-9096-z · Cited by 6
Evolution of Elongation Factor 1 Alpha
Saito, K., & Ito, K. (2013) · Springer eBooks · doi:10.1007/978-1-4419-9863-7_833 · Cited by 5
Ngoennet, S., Sirisattha, S., Kusolkumbot, P., Hibino, T., Kageyama, H., & Waditee‐Sirisattha, R. (2023) · Archives of Biochemistry and Biophysics · doi:10.1016/j.abb.2023.109734 · Cited by 4
Ong, J. S., Liu, Y.-W., Liong, M., Choi, S. B., Tsai, Y.-C., & Low, W. Y. (2020) · Genomics · doi:10.1016/j.ygeno.2020.06.052 · Cited by 4
The ribosome termination complex remodels release factor RF3 and ejects GDP
Li, L., Rybak, M. Y., Lin, J., & Gagnon, M. G. (2024) · Nature Structural & Molecular Biology · doi:10.1038/s41594-024-01360-0 · Cited by 4
Micklinghoff, J. C., Schmidt, M., Geffers, R., Tegge, W. J., & Bange, F. (2010) · Archives of Microbiology · doi:10.1007/s00203-010-0571-y · Cited by 4
Dynamics of release factor recycling during translation termination in bacteria
Prabhakar, A., Pavlov, M. Y., Zhang, J., Indrisiunaite, G., Wang, J., Lawson, M. R., Ehrenberg, M., & Puglisi, J. D. (2023) · Nucleic Acids Research · doi:10.1093/nar/gkad286 · Cited by 4
Antimicrobial Resistance inCampylobacterspp.
Shen, Z., Wang, Y., Zhang, Q., & Shen, J. (2018) · ASM Press eBooks · doi:10.1128/9781555819804.ch14 · Cited by 4
The Ribosome and Protein Synthesis
Huter, P., Graf, M., & Wilson, D. N. (2021) · Wiley eBooks · doi:10.1002/9783527814527.ch8 · Cited by 4
Unusual Features of the Unusual Ribosomal Elongation Factor EF4 (LepA)
Pech, M., Yamamoto, H., Karim, Z., & Nierhaus, K. H. (2010) · Israel Journal of Chemistry · doi:10.1002/ijch.201000008 · Cited by 2
Translation Elongation and Termination: Are They Conserved Processes?
Eltschinger, S., Bütikofer, P., & Altmann, M. (2016) · Springer eBooks · doi:10.1007/978-3-319-39468-8_13 · Cited by 2
Translation in Mitochondria and Apicoplasts of Apicomplexan Parasites
Gupta, A., Haider, A., Vaishya, S., & Habib, S. (2013) · Springer eBooks · doi:10.1007/978-3-642-39426-3_7 · Cited by 4
Koripella, R. K., Deep, A., Agrawal, E. K., Keshavan, P., Banavali, N. K., & Agrawal, R. K. (2020) · bioRxiv (Cold Spring Harbor Laboratory) · doi:10.1101/2020.12.20.423689 · Cited by 2
Structural and functional studies on GTPases involved in eukaryal translation initiation
Kuhle, B. (2015) · doi:10.53846/goediss-5088 · Cited by 2
Li, D.-F., Zhang, J., Liu, S., He, Y., Ma, Q., Wang, P., Ma, Z., Xu, J., & Zhou, Z. (2025) · Comparative Biochemistry and Physiology Part D Genomics and Proteomics · doi:10.1016/j.cbd.2025.101447 · Cited by 1
Lee, Y., Jin, Y., Wu, W., & Ha, U. (2025) · Microbial Pathogenesis · doi:10.1016/j.micpath.2025.107720 · Cited by 1
Arabidopsis thaliana mitochondrial EF-G1 functions in two different translation steps
Suematsu, T., Watanabe, O., Kita, K., Yokobori, S., & Watanabe, Y. (2013) · The Journal of Biochemistry · doi:10.1093/jb/mvt105 · Cited by 1
Metadata
- Authors
- Margus, T., Remm, M., & Tenson, T.
- Affiliations
- University of Tartu (EE)
- Corresponding author
- Tenson, Tanel
- Venue
- BMC Genomics
- Published
- 2007-01-10
- Volume
- 8
- Issue
- 1
- Pages
- 15-15
- ISSN
- 1471-2164 (ISSN-L)
- PMC
- PMC1780047
- OpenAlex
- W1939105798
- Cited by
- 115
- References
- 114
- Citations by year
- 2026: 1 · 2025: 5 · 2024: 2 · 2023: 3 · 2022: 5 · 2021: 14 · 2020: 8 · 2019: 1 · 2018: 5 · 2017: 7 · 2016: 11 · 2015: 8 · 2014: 6 · 2013: 8 · 2012: 4
- FWCI
- 2.51
- Type
- journal article
- Language
- en
- Open access
- gold
- doi.org
- Licence
- Locations
- BMC Genomics (publishedVersion, cc-by)
- PubMed Central (publishedVersion, cc-by)
- PubMed (publishedVersion)
- DOAJ (DOAJ: Directory of Open Access Journals) (submittedVersion)
- Funders
- Wellcome Trust (070210)
- Eesti Teadusfondi
- Topics
- Life Sciences › Biochemistry, Genetics and Molecular Biology › Molecular Biology › RNA and protein synthesis mechanisms
- Life Sciences › Biochemistry, Genetics and Molecular Biology › Molecular Biology › Genomics and Phylogenetic Studies
- Life Sciences › Biochemistry, Genetics and Molecular Biology › Genetics › Bacterial Genetics and Biotechnology
- Keywords
- translational GTPases, bacterial phylogeny, elongation factor Tu, elongation factor G, initiation factor 2, Lepas, Rf3, Selb, selenocysteine incorporation, essential genes, gene family evolution
- MeSH terms
- Amino Acid Sequence, Bacteria, Base Sequence, DNA, Bacterial, Markov Chains, Molecular Sequence Data, Phylogeny, Sequence Homology, Nucleic Acid, Protein Biosynthesis, Genome, Bacterial, GTP Phosphohydrolases
About these checks
Registry, retraction, Cites and statistics results are computed, not judged, with one exception: a printed reference that no index lists is read once by a model before it counts as a citation error. Claims are extracted by a model and kept only when their quote appears verbatim in the text; each cited source is then checked, with a model’s help, for whether it says what the claim relies on. Those verdicts can be wrong — read the claim’s quote and the cited source before relying on one.
Statistics and arithmetic are recomputed, not judged.
Confidence bands are shown only for fields calibrated on our annotated test set. None is calibrated yet, so no band is shown.
What counts as a claim ›How we measure confidence ›How we check this ›
Are you an author, or do you see a problem with this page? Request a review
