

The DOI matches its Crossref record; 50 of the 50 references it cites were found in a registry or an index.
Characterization of murine macrophages from bone marrow, spleen and peritoneum
Open accessAbstract
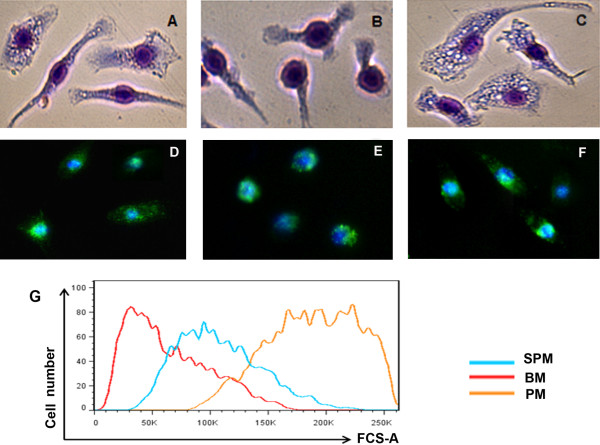
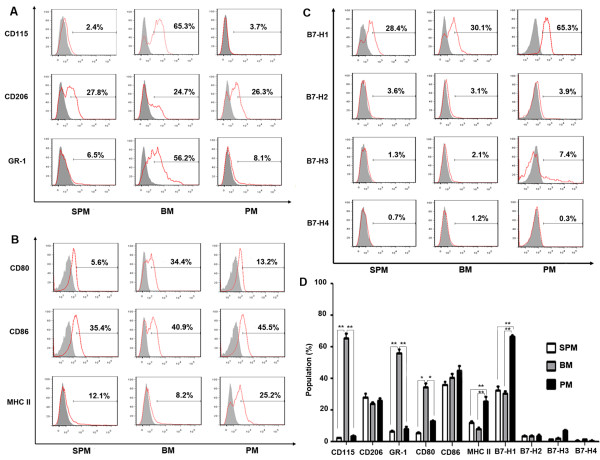
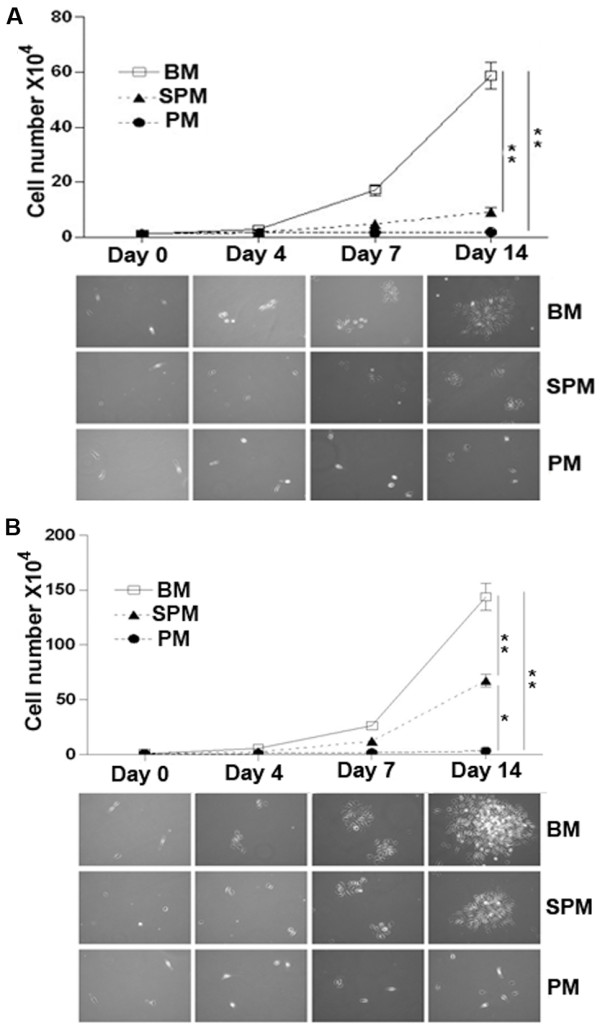
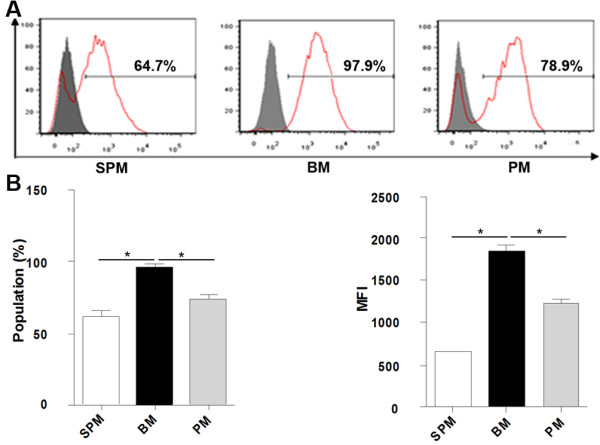
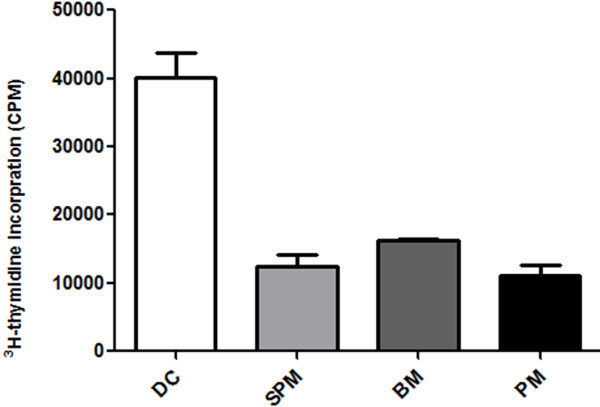
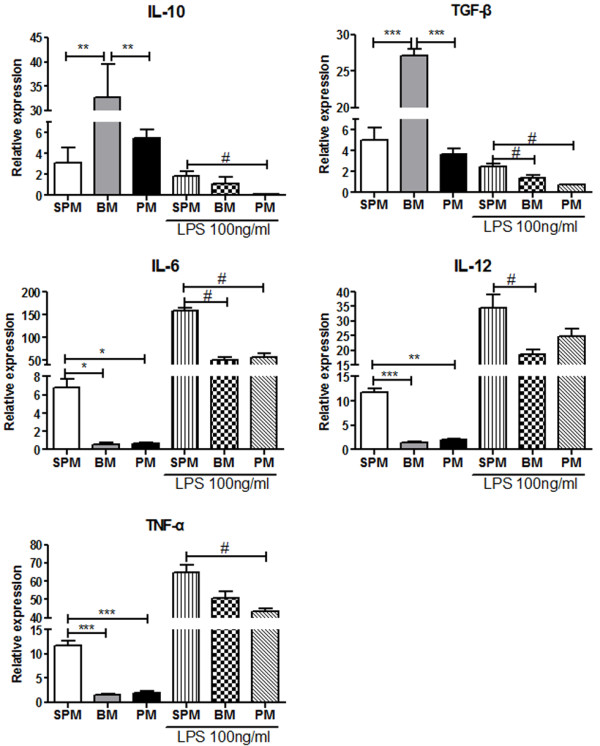
BACKGROUND: Macrophages have heterogeneous phenotypes and complex functions within both innate and adaptive immune responses. To date, most experimental studies have been performed on macrophages derived from bone marrow, spleen and peritoneum. However, differences among macrophages from these particular sources remain unclear. In this study, the features of murine macrophages from bone marrow, spleen and peritoneum were compared. RESULTS: We found that peritoneal macrophages (PMs) appear to be more mature than bone marrow derived macrophages (BMs) and splenic macrophages (SPMs) based on their morphology and surface molecular characteristics. BMs showed the strongest capacity for both proliferation and phagocytosis among the three populations of macrophage. Under resting conditions, SPMs maintained high levels of pro-inflammatory cytokines expression (IL-6, IL-12 and TNF-α), whereas BMs produced high levels of suppressive cytokines (IL-10 and TGF-β). However, SPMs activated with LPS not only maintained higher levels of (IL-6, IL-12 and TNF-α) than BMs or PMs, but also maintained higher levels of IL-10 and TGF-β. CONCLUSIONS: Our results show that BMs, SPMs and PMs are distinct populations with different biological functions, providing clues to guide their further experimental or therapeutic use.
Overview
The claims and statistics of this paper haven’t been checked yet.
Run the check — free, no account needed. It reads the open-access text and checks the sources it cites.
Integrity signals
Registry
Cites
Statistics
Figures
Verification
Claims the paper makes
The claims and statistics of this paper haven’t been checked yet.
Run the check — free, no account needed. It reads the open-access text and checks the sources it cites.
Claims other papers make about this one
Each is checked against this paper’s own text: does it say what the citing paper says it does?
The source backs part of the claim, not all of it — or backs it for a different population, condition or comparison.
In the citing paper
“This population was selected over bone-marrow derived macrophages as peritoneal macrophages differentiate within the tissue, which allows them to mold to their environment and experience hormonal changes throughout the animal’s lifespan [29, 31, 32].”
From Alzheimer’s disease-associated protective variant Plcg2-P522R modulates peripheral macrophage function in a sex-dimorphic manner (2024) · cites this paper as [32]
Experimental — accuracy not yet measured
Self-check
Percentages, sums and reported differences re-computed from the paper’s own numbers.
The self-check needs the paper’s full text.
Citations
Cites
Development of Monocytes, Macrophages, and Dendritic Cells
Geissmann, F., Manz, M. G., Jung, S., Sieweke, M. H., Merad, M., & Ley, K. (2010) · Science · doi:10.1126/science.1178331 · Cited by 3,049
Arnold, L., Henry, A., Poron, F., Baba-Amer, Y., van Rooijen, N., Plonquet, A., Gherardi, R. K., & Chazaud, B. (2007) · The Journal of Experimental Medicine · doi:10.1084/jem.20070075 · Cited by 2,002
Isaacson, P. G., Doǧan, A., Price, S. K., & Spencer, J. (1989) · The American Journal of Surgical Pathology · doi:10.1097/00000478-198912000-00004 · Cited by 1,913
F4/80, a monoclonal antibody directed specifically against the mouse macrophage
Austyn, J. M., & Gordon, S. (1981) · European Journal of Immunology · doi:10.1002/eji.1830111013 · Cited by 1,596
Huang, B., Pan, P.-Y., Li, Q., Sato, A. I., Levy, D. E., Bromberg, J., Divino, C. M., & Chen, S.-H. (2006) · Cancer Research · doi:10.1158/0008-5472.can-05-1299 · Cited by 1,435
Mac‐1: a macrophage differentiation antigen identified by monoclonal antibody
Springer, T. A., Galfré, G., Secher, D. S., & Milstein, C. (1979) · European Journal of Immunology · doi:10.1002/eji.1830090410 · Cited by 1,108
Bone Marrow-Derived Macrophages (BMM): Isolation and ApplicationsPreprint
Weischenfeldt, J., & Porse, B. T. (2008) · Cold Spring Harbor Protocols · doi:10.1101/pdb.prot5080 · Cited by 959
Brown, B. N., Ratner, B. D., Goodman, S. B., Amar, S., & Badylak, S. F. (2012) · Biomaterials · doi:10.1016/j.biomaterials.2012.02.034 · Cited by 926 · cited 1×
“Following great technical improvements in the in vitro generation of macrophages, they are now considered as candidates for cell therapy [17,30-32].”
BackgroundSasmono, R. T., Oceandy, D., Pollard, J. W., Tong, W., Pavli, P., Wainwright, B. J., Ostrowski, M. C., Himes, S. R., & Hume, D. A. (2003) · Blood · doi:10.1182/blood-2002-02-0569 · Cited by 662
The macrophage: Past, present and future
Gordon, S. (2007) · European Journal of Immunology · doi:10.1002/eji.200737638 · Cited by 640
Research works printed but not linked: 1
- Cao Q, Zheng D, Sun Y, Wang Y, Lee VW, Zheng G, Alexander SI, Harris DC: Impaired alternative activated macrophages from bone marrow in treatment of CKD: Associations with their proliferation in inflamed kidney. Presented in abstract form at the annual meeting of the American Society of Nephrology; October 27 through November 1. 2009, CA: San Diego
Cited by
Sorted by citations
Items 201–225 of 225
Modeling PPRV pathogenesis in mice to assess the contribution of innate cells and anti-viral T cellsPreprint
Sharma, Y., Sarkar, R., Jain, A., Singh, S., Shekhar, C., Shanmugam, C., Muthuchelvan, D., Tembure, P., Kaul, R., & Sehrawat, S. (2020) · bioRxiv (Cold Spring Harbor Laboratory) · doi:10.1101/2020.10.27.358309
A Syk/CARD9 szignalizáció szerepe a Candida parapsilosis immunológiai felismerésében
Zajta, E. (2020) · SZTE Repository of Dissertations (University of Szeged) · doi:10.14232/phd.10576
Li, X. R. (2020) · TSpace (University of Toronto)
Regulation of inflammation in canine species: a role for macrophages and Hsp70
Lyu, Q. (2021) · Utrecht University Repository (Utrecht University) · doi:10.33540/882
Development of the Antileishmanial Vaccine
Kumar, S., Zutshi, S., Jha, M. K., Chauhan, P. S., & Saha, B. (2021) · Methods in molecular biology · doi:10.1007/978-1-0716-1884-4_23
Timmerman, R. (2022) · Utrecht University Repository (Utrecht University) · doi:10.33540/1603
Local delivery of SBRT and IL-12 to murine PDAC tumors modulates hematopoiesis
Vrooman, T. G., Quarato, E. R., Hannon, G., Salama, N., Lesch, M. L., Hughson, A. L., Chandak, V. S., Vdovichenko, N., Jin, Z., Lakony, R., et al. (2026) · OncoImmunology · doi:10.1080/2162402x.2026.2682058
Dystrophin Dp71 is essential for the development and function of macrophagesPreprint
Chira, N., Swatler, J., Manousopoulou, A., Rumney, R. M. H., Hajto, J., Oksiejuk, A., Baquero, D. G., Róg, J., White, C., Hinz, S., et al. (2025) · bioRxiv (Cold Spring Harbor Laboratory) · doi:10.1101/2025.04.24.650386
Gudenschwager Basso, E. K., Ju, J., Soliman, E., de Jager, C., Wei, X., Pridham, K. J., Olsen, M. L., & Theus, M. H. (2024) · Figshare · doi:10.6084/m9.figshare.26676665
Gudenschwager Basso, E. K., Ju, J., Soliman, E., de Jager, C., Wei, X., Pridham, K. J., Olsen, M. L., & Theus, M. H. (2024) · Figshare · doi:10.6084/m9.figshare.26676659
Gudenschwager Basso, E. K., Ju, J., Soliman, E., de Jager, C., Wei, X., Pridham, K. J., Olsen, M. L., & Theus, M. H. (2024) · Figshare · doi:10.6084/m9.figshare.25139651
Chen, F., Liu, W., Zhang, Q., Wu, P., Xiao, A., Zhao, Y., Zhou, Y., Wang, Q., Chen, Y., & Tong, Z. (2021) · Figshare · doi:10.6084/m9.figshare.15000024
Self-citationGudenschwager Basso, E. K., Ju, J., Soliman, E., de Jager, C., Wei, X., Pridham, K. J., Olsen, M. L., & Theus, M. H. (2024) · Figshare · doi:10.6084/m9.figshare.25139583
Gudenschwager Basso, E. K., Ju, J., Soliman, E., de Jager, C., Wei, X., Pridham, K. J., Olsen, M. L., & Theus, M. H. (2024) · Figshare · doi:10.6084/m9.figshare.26676662
Shen, T., Lin, R., Hu, C., Yu, D., Ren, C., Li, T., Zhu, M., Wan, Z., Su, T., Wu, Y., et al. (2023) · Figshare · doi:10.6084/m9.figshare.24892892
Jeljeli, M. M. (2020) · theses.fr (ABES) · doi:10.70675/dfc4dd10z9fb4z4e16z836dz778a7ef9d1c1
Regulation of mRNA translation during the inflammatory response in murine macrophages
Blin, J. (2020) · theses.fr (ABES) · doi:10.70675/9eed69d2z2c72z4b4dz8603zdc632396f487
The role of the unfolded protein response in dendritic cells and multiple myeloma cells
Gigan, J. P. (2022) · theses.fr (ABES) · doi:10.70675/e412f7f8zaaafz4caaz8d4czd681169cbf7b
Hardwired and rewired: Tissue macrophages in homeostasis and cancer
Mohei, H., Deren, D. A. V., & Haldar, M. (2026) · Journal of Leukocyte Biology · doi:10.1093/jleuko/qiag046
Haile, S. A., Gatta, A., Colon, N., Philpott, D. J., Kufer, T. A., Ying, L., Tong, D., & Ferrero, R. L. (2026) · The FASEB Journal · doi:10.1096/fj.202504879r
Flow cytometric assessment of the metabolic profile of peritoneal phagocytes in wild bank volesPreprint
Semchuk, I., DOVHYI, R., Skovorodnikova, M., Fedorchuk, A., Stepankevych, B., Yevdokymenko, O., Tukalenko, E., Dovbynchuk, T., Tolstanova, G., & Skivka, L. (2026) · SSRN Electronic Journal · doi:10.2139/ssrn.7644291
Metadata
- Authors
- Wang, C., Yu, X., Cao, Q., Wang, Y., Zheng, G., Tan, T. K., Zhao, H., Zhao, Y., Wang, Y., & Harris, D. C.
- Affiliations
- Westmead Hospital (AU)
- Shanxi Medical University (CN)
- Corresponding author
- Wang, Changqi
- Venue
- BMC Immunology
- Published
- 2013-02-05
- Volume
- 14
- Issue
- 1
- Pages
- 6-6
- ISSN
- 1471-2172 (ISSN-L)
- PMC
- PMC3574850
- OpenAlex
- W2171040124
- Cited by
- 225
- References
- 50
- Citations by year
- 2026: 5 · 2025: 14 · 2024: 18 · 2023: 16 · 2022: 12 · 2021: 13 · 2020: 32 · 2019: 22 · 2018: 25 · 2017: 27 · 2016: 17 · 2015: 17 · 2014: 7
- FWCI
- 7.56
- Type
- journal article
- Language
- en
- Open access
- gold
- doi.org
- Licence
- Locations
- BMC Immunology (publishedVersion, cc-by)
- Europe PMC (PubMed Central) (publishedVersion, cc-by)
- PubMed Central (publishedVersion, cc-by)
- PubMed (publishedVersion)
- DOAJ (DOAJ: Directory of Open Access Journals) (submittedVersion, cc-by-sa)
- Funders
- Medical Research Council
- National Health and Medical Research Council (457345)
- Topics
- Life Sciences › Immunology and Microbiology › Immunology › Immune cells in cancer
- Life Sciences › Immunology and Microbiology › Immunology › Phagocytosis and Immune Regulation
- Life Sciences › Immunology and Microbiology › Immunology › Immune Response and Inflammation
- Keywords
- macrophage heterogeneity, peritoneal macrophages, bone marrow-derived macrophages, splenic macrophages, macrophage maturation, phagocytosis, macrophage proliferation, inflammatory cytokines, IL-10, TGF-beta, lipopolysaccharide stimulation, murine macrophages
- MeSH terms
- Animals, Bone Marrow Cells, Cell Membrane, Cells, Cultured, Dextrans, Flow Cytometry, Gene Expression Regulation, Lymphocyte Activation, Macrophages, Male, Mice, Inbred BALB C, Phagocytosis, Phenotype, RNA, Messenger, Spleen, CD4-Positive T-Lymphocytes, Cytokines, Fluorescein-5-isothiocyanate, Macrophages, Peritoneal, Antigen Presentation, Cell Shape, Cell Proliferation, Mice
About these checks
Registry, retraction, Cites and statistics results are computed, not judged, with one exception: a printed reference that no index lists is read once by a model before it counts as a citation error. Claims are extracted by a model and kept only when their quote appears verbatim in the text; each cited source is then checked, with a model’s help, for whether it says what the claim relies on. Those verdicts can be wrong — read the claim’s quote and the cited source before relying on one.
Statistics and arithmetic are recomputed, not judged.
Confidence bands are shown only for fields calibrated on our annotated test set. None is calibrated yet, so no band is shown.
What counts as a claim ›How we measure confidence ›How we check this ›
Are you an author, or do you see a problem with this page? Request a review
