

The DOI matches its Crossref record; 29 of the 29 references it cites were found in a registry or an index.
IGF-1 enhances cell proliferation and survival during early differentiation of mesenchymal stem cells to neural progenitor-like cells
Open accessAbstract
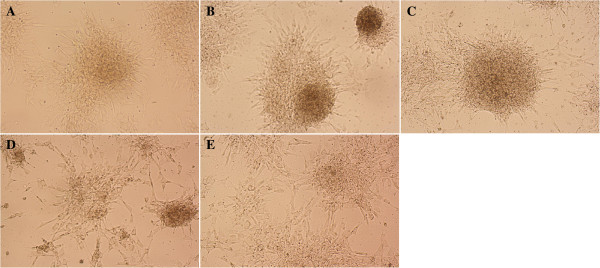
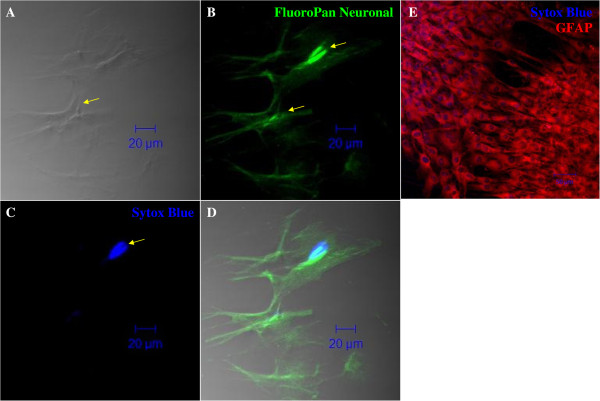
BACKGROUND: There has been increasing interest recently in the plasticity of mesenchymal stem cells (MSCs) and their potential to differentiate into neural lineages. To unravel the roles and effects of different growth factors in the differentiation of MSCs into neural lineages, we have differentiated MSCs into neural lineages using different combinations of growth factors. Based on previous studies of the roles of insulin-like growth factor 1 (IGF-1) in neural stem cell isolation in the laboratory, we hypothesized that IGF-1 can enhance proliferation and reduce apoptosis in neural progenitor-like cells (NPCs) during differentiation of MSCs into NCPs.We induced MSCs differentiation under four different combinations of growth factors: (A) EGF + bFGF, (B) EGF + bFGF + IGF-1, (C) EGF + bFGF + LIF, (D) EGF + bFGF + BDNF, and (E) without growth factors, as a negative control. The neurospheres formed were characterized by immunofluorescence staining against nestin, and the expression was measured by flow cytometry. Cell proliferation and apoptosis were also studied by MTS and Annexin V assay, respectively, at three different time intervals (24 hr, 3 days, and 5 days). The neurospheres formed in the four groups were then terminally differentiated into neuron and glial cells. RESULTS: The four derived NPCs showed a significantly higher expression of nestin than was shown by the negative control. Among the groups treated with growth factors, NPCs treated with IGF-1 showed the highest expression of nestin. Furthermore, NPCs derived using IGF-1 exhibited the highest cell proliferation and cell survival among the treated groups. The NPCs derived from IGF-1 treatment also resulted in a better yield after the terminal differentiation into neurons and glial cells than that of the other treated groups. CONCLUSIONS: Our results suggested that IGF-1 has a crucial role in the differentiation of MSCs into neuronal lineage by enhancing the proliferation and reducing the apoptosis in the NPCs. This information will be beneficial in the long run for improving both cell-based and cell-free therapy for neurodegenerative diseases.
Overview
The claims and statistics of this paper haven’t been checked yet.
Run the check — free, no account needed. It reads the open-access text and checks the sources it cites.
Integrity signals
Registry
Cites
Statistics
Figures
Verification
Claims the paper makes
The claims and statistics of this paper haven’t been checked yet.
Run the check — free, no account needed. It reads the open-access text and checks the sources it cites.
Claims other papers make about this one
Each is checked against this paper’s own text: does it say what the citing paper says it does?
In the citing paper
“There are also data that show that BDNF participates in the regulation of neuron metabolism, development, and proper functioning in cooperation with insulin-like growth factor-1 (IGF-1) [201].”
From BDNF as a Promising Therapeutic Agent in Parkinson’s Disease (2020) · cites this paper as [201]
Self-check
Percentages, sums and reported differences re-computed from the paper’s own numbers.
The self-check needs the paper’s full text.
Citations
Cites
Mesenchymal and haematopoietic stem cells form a unique bone marrow niche
Méndez‐Ferrer, S., Michurina, T. V., Ferraro, F., Mazloom, A. R., MacArthur, B. D., Lira, S. A., Scadden, D. T., Ma’ayan, A., Enikolopov, G., & Frenette, P. S. (2010) · Nature · doi:10.1038/nature09262 · Cited by 3,381 · cited 1×
“ESCs are pluripotent cells derived from the inner cell mass of the blastocyst [4], whereas ASCs are isolated from adult tissues and defined as multipotent, since they are determined to produce cell types within their niche [5].”
BackgroundWagner, W., Wein, F., Seckinger, A., Frankhauser, M., Wirkner, U., Krause, U., Blake, J., Schwager, C., Eckstein, V., Ansorge, W. J., et al. (2005) · Experimental Hematology · doi:10.1016/j.exphem.2005.07.003 · Cited by 1,257 · cited 1×
“MSCs have also been found in most postnatal organs such as the umbilical cord, adipose tissue, peripheral blood, and amniotic fluid [9-11].”
BackgroundLee, J. S., Hong, J. M., Moon, G. J., Lee, P. H., Ahn, Y. H., & Bang, O. Y. (2010) · Stem Cells · doi:10.1002/stem.430 · Cited by 775 · cited 1×
“Autologous transplantation of MSCs in stroke patients was proven therapeutically effective [13].”
BackgroundDezawa, M., Kanno, H., Hoshino, M., Cho, H., Matsumoto, N., Itokazu, Y., Tajima, N., Yamada, H., Sawada, H., Ishikawa, H., et al. (2004) · Journal of Clinical Investigation · doi:10.1172/jci20935 · Cited by 684 · cited 1×
“has been reported that MSCs can be induced into neural lineage through several methods such as incubation with cytokines [19], co-culture with nerve cells [1,6], and transfection with known factors [20].”
Efficient generation of neural stem cell-like cells from adult human bone marrow stromal cells
Hermann, A., Gastl, R., Liebau, S., Popa, M. O., Fiedler, J., Boehm, B. O., Maisel, M., Lerche, H., Schwarz, J., Brenner, R. E., et al. (2004) · Journal of Cell Science · doi:10.1242/jcs.01307 · Cited by 449 · cited 2×
“This is consistent with the previous finding that one third of MSCs died after induction [14].”
BackgroundResultWislet‐Gendebien, S., Hans, G. A., Leprince, P., Rigo, J., Moonen, G., & Rogister, B. (2005) · Stem Cells · doi:10.1634/stemcells.2004-0149 · Cited by 427
Hsieh, J.-Y., Wang, H., Chang, S., Liao, K., Lee, I., Lin, W., Wu, C., Lin, W., & Cheng, S. (2013) · PLoS ONE · doi:10.1371/journal.pone.0072604 · Cited by 324 · cited 1×
“Autologous transplantation of MSCs extracted from Wharton’s jelly has been reported to be free from immunogenic rejection [18].”
BackgroundWilkins, A., Kemp, K. C., Ginty, M., Hares, K. M., Mallam, E., & Scolding, N. J. (2009) · Stem Cell Research · doi:10.1016/j.scr.2009.02.006 · Cited by 290 · cited 1×
“However, recent studies suggested that ASCs, especially mesenchymal stem cells (MSCs) derived from bone marrow (BM), have intrinsic neurogenic potential and may be differentiated into mature cells of ectodermal origin [6-8].”
BackgroundMesenchymal stem cells: A promising candidate in regenerative medicine
Chen, Y., Shao, J., Xiang, L., Dong, X.-J., & Zhang, G. (2008) · The International Journal of Biochemistry & Cell Biology · doi:10.1016/j.biocel.2008.01.007 · Cited by 254 · cited 1×
“The trans-lineage differentiation capability and unique immunogenic properties of MSCs have made them a potential alternative for cellular transplantation use in regenerative medicine [12].”
BackgroundYang, C., Shih, Y., Ko, M., Hsu, S.-Y., Cheng, H., & Fu, Y.-S. (2008) · PLoS ONE · doi:10.1371/journal.pone.0003336 · Cited by 231 · cited 1×
“MSCs may even release certain neurotrophic factors such as BDNF, nerve growth factor, and glial-derived neurotrophic factors [26,27], and it is well known that the neurotrophic factors are important for maintaining cellular survival of neuronal cells both in vitro and in vivo.”
Background
Cited by
Sorted by citations
BDNF as a Promising Therapeutic Agent in Parkinson’s Disease
Palasz, E., Wysocka, A., Gasiorowska, A., Chalimoniuk, M., Niewiadomski, W., & Niewiadomska, G. (2020) · International Journal of Molecular Sciences · doi:10.3390/ijms21031170 · Cited by 504
“Sci. 2020, 21, 1170 12 of 23 Akt Akt enzyme, also known as protein kinase B ALS amyotrophic lateral sclerosis ASN alpha-synuclein BBB blood-brain-barrier BDNF brain-derived neurotrophic factor CaMKII calmodulin-dependent protein kinase II cAMP cyclicAMP CNS central nervous system CREB cAMP-response element-binding pro…”
BackgroundDyer, A. H., Vahdatpour, C., Sanfeliu, A., & Tropea, D. (2016) · Neuroscience · doi:10.1016/j.neuroscience.2016.03.056 · Cited by 379
Biomarkers of postoperative delirium and cognitive dysfunction
Androsova, G., Krause, R., Winterer, G., & Schneider, R. (2015) · Frontiers in Aging Neuroscience · doi:10.3389/fnagi.2015.00112 · Cited by 266
“Similarly to BDNF, insulin growth factor-1 (IGF-1) promotes neuronal proliferation, development, survival and enhanced synaptic transmission in CNS (Frost et al., 2003; Shcheglovitov et al., 2013; Huat et al., 2014).”
The Roles of Insulin-Like Growth Factors in Mesenchymal Stem Cell Niche
Youssef, A., Aboalola, D. A., & Han, V. K. M. (2017) · Stem Cells International · doi:10.1155/2017/9453108 · Cited by 144
Mesenchymal stem cell therapy for the treatment of traumatic brain injury: progress and prospects
Das, M., Mayilsamy, K., Mohapatra, S. S., & Mohapatra, S. (2019) · Reviews in the Neurosciences · doi:10.1515/revneuro-2019-0002 · Cited by 131
Long term effect and safety of Wharton's jelly-derived mesenchymal stem cells on type 2 diabetes
Hu, J., Wang, Y., Gong, H., Yu, C., Guo, C., Wang, F., Yan, S., & Xu, H. (2016) · Experimental and Therapeutic Medicine · doi:10.3892/etm.2016.3544 · Cited by 102
Riis, S., Murray, J. B., & O’Connor, R. (2020) · Cells · doi:10.3390/cells9010147 · Cited by 88
“Interestingly, the IGF-1 signalling pathway has been proposed to maintain both stem-like qualities and to enhance cell survival during cell differentiation [54,55].”
Graphene oxide-PLGA hybrid nanofibres for the local delivery of IGF-1 and BDNF in spinal cord repair
Su, P., Qi, Z., Li, Q., Ma, Y., Fu, C., Zheng, S., Kong, W., Liu, Q., & Yang, X. (2019) · Artificial Cells Nanomedicine and Biotechnology · doi:10.1080/21691401.2019.1575843 · Cited by 84
Vahdatpour, C., Dyer, A. H., & Tropea, D. (2016) · Frontiers in Neuroscience · doi:10.3389/fnins.2016.00450 · Cited by 77
“…section of the journal Frontiers in Neuroscience Received: 07 July 2016 Accepted: 20 September 2016 Published: 30 September 2016 Citation: Vahdatpour C, Dyer AH and Tropea D (2016) Insulin-Like Growth Factor 1 and Related Compounds in the Treatment of Childhood-Onset Neurodevelopmental Disorders.”
BackgroundWei, P., Xu, Y., Gu, Y., Yao, Q., Li, J., & Wang, L. (2020) · Drug Delivery · doi:10.1080/10717544.2020.1797239 · Cited by 76
“Insulin-like growth factor-1 (IGF-1) has been extensively researched for its ability to encourage cell proliferation, inhibition of cell apoptosis, and anabolic effects on musculoskeletal tissues (Huat et al., 2014; Ramos et al., 2019).”
BackgroundIs insulin-like growth factor-1 involved in Parkinson’s disease development?
Castilla‐Cortázar, I., Aguirre, G. A., Femat‐Roldán, G., Martín‐Estal, I., & Espinosa, L. (2020) · Journal of Translational Medicine · doi:10.1186/s12967-020-02223-0 · Cited by 76
Allahdadi, K. J., de Santana, T. A., Santos, G. C., Azevedo, C. M., Mota, R. A., Nonaka, C. K. V., Silva, D. N., Valim, C. X. R., Figueira, C. P., dos‐Santos, W. L. C., et al. (2019) · Stem Cell Research & Therapy · doi:10.1186/s13287-019-1223-z · Cited by 68
Yu, F., Gong, D., Yan, D., Wang, H., Witman, N., Yang, L., Fu, W. E., & Fu, Y. (2023) · Molecular Therapy · doi:10.1016/j.ymthe.2023.05.002 · Cited by 64
Stem cells and combination therapy for the treatment of traumatic brain injury
Dekmak, A., Mantash, S., Shaito, A. A., Toutonji, A., Ramadan, N., Ghazale, H., Kassem, N. A., Darwish, H., & Zibara, K. (2016) · Behavioural Brain Research · doi:10.1016/j.bbr.2016.12.039 · Cited by 64
An Overview of Protocols for the Neural Induction of Dental and Oral Stem Cells In Vitro
Heng, B. C., Lim, L. W., Wu, W., & Zhang, C. (2016) · Tissue Engineering Part B Reviews · doi:10.1089/ten.teb.2015.0488 · Cited by 59
“100,101 The last major component of the culture milieu for neural induction of DPSCs includes a diverse array of various small molecules (Table 1).”
Chen, L., Zou, X., Zhang, R., Pi, C.-J., Wu, N., Yin, L., & Deng, Z. (2016) · BMB Reports · doi:10.5483/bmbrep.2016.49.2.228 · Cited by 53
“IGF signaling is critical for the regulation of development and homeostasis, including differentiation, proliferation, and apoptosis (10-12, 22).”
BackgroundZhang, H., Xie, X., Xiong, Y., Liu, S., Hu, G., Cao, W.-F., & Wu, X. (2017) · Brain Research · doi:10.1016/j.brainres.2017.12.017 · Cited by 53
Zibara, K., Ballout, N., Mondello, S., Karnib, N., Ramadan, N., Omais, S., Nabbouh, A. I., Caliz, D., Clavijo, A., Hu, Z., et al. (2018) · Neuropharmacology · doi:10.1016/j.neuropharm.2018.09.032 · Cited by 52
“Of note, IGF-1 also exhibited an important supportive role in MSCs development leading to their proliferation and differentiation into neuronal lineages (Huat et al., 2014).”
Hormonal Regulation of Oligodendrogenesis I: Effects across the Lifespan
Long, K. L. P., Breton, J., Barraza, M., Perloff, O. S., & Kaufer, D. (2021) · Biomolecules · doi:10.3390/biom11020283 · Cited by 56
Ramos, D. M., Abdulmalik, S., Arul, M. R., Rudraiah, S., Laurencin, C. T., Mazzocca, A. D., & Kumbar, S. G. (2019) · Polymers for Advanced Technologies · doi:10.1002/pat.4553 · Cited by 49
Li, X., Wu, T., Chen, J., & Qiu, W. (2016) · Journal of Diabetes Investigation · doi:10.1111/jdi.12542 · Cited by 47
Shandilya, A., Mehan, S., Kumar, S., Sethi, P., Narula, A. S., Alshammari, A., Alharbi, M., & Alasmari, A. F. (2022) · Molecules · doi:10.3390/molecules27123878 · Cited by 46
Zhong, Z., Li, F., Li, Y., Qin, S., Wen, C., Fu, Y., & Xiao, Q. (2018) · Molecular Medicine Reports · doi:10.3892/mmr.2018.8463 · Cited by 46
“IGF-1 is a critical growth‐promoting polypeptide, which serves significant roles in cell proliferation, survival and differentiation of numerous cell types (24,25).”
BackgroundRetractedChen, C., Tseng, K., Lai, Y.-L., Chen, Y., Lin, F., & Lin, S. (2017) · Theranostics · doi:10.7150/thno.16637 · Cited by 46
“Factors, such as platelet-derived growth factor (PDGF) [20, 21], fibroblast growth factor (FGF) [22, 23], and insulin-like growth factor 1 (IGF-1) [24, 25], act as bone cell mitogens [20-22].”
BackgroundIs Delirium the Cognitive Harbinger of Frailty in Older Adults? A Review about the Existing Evidence
Bellelli, G., Moresco, R., Panina‐Bordignon, P., Arosio, B., Gelfi, C., Morandi, A., & Cesari, M. (2017) · Frontiers in Medicine · doi:10.3389/fmed.2017.00188 · Cited by 45
“Importantly, cytokines can disrupt the neurotransmitter system balance, leading to reduced acetylcholine release (56) and decreased cholinesterase activity (57) and can activate the microglial cells, provoking an inflammatory response which can interfere with the connection and transmission functions of synapses (58,…”
BackgroundShen, H., Gu, X., Wei, Z. Z., Wu, A., Liu, X., & Wei, L. (2020) · Experimental Neurology · doi:10.1016/j.expneurol.2020.113542 · Cited by 43
Loss of MeCP2 in immature neurons leads to impaired network integration
Sun, Y. X., Gao, Y., Tidei, J. J., Shen, M., Hoang, J. T., Wagner, D. F., & Zhao, X. (2018) · Human Molecular Genetics · doi:10.1093/hmg/ddy338 · Cited by 44
Huat, T. J., Khan, A. A., Abdullah, J. M., Idris, F. M., & Jaafar, H. (2015) · International Journal of Molecular Sciences · doi:10.3390/ijms16059693 · Cited by 39
“05) enhance BMSCs-derived NPCs viability in undifferentiated state [3].”
BackgroundMethodResultInfluentialSelf-citationZhao, B., & Zheng, Z. (2017) · Medical Science Monitor · doi:10.12659/msm.901055 · Cited by 38
“Moreover, IGF-1 is reported to be an essential growth factor for promoting proliferation and suppressing apoptosis of neural progenitor-like cells [19].”
BackgroundRetractedWISP2/IGF1 promotes the survival of DSCs and impairs the cytotoxicity of decidual NK cells
Shi, J., Yang, H., Lai, Z., Shen, H., Qin, X., Qiu, X., Wang, Y., Wu, J., & Li, M. (2021) · Reproduction · doi:10.1530/rep-20-0658 · Cited by 37
Khan, A. A., Huat, T. J., Mutery, A. A., El-Serafi, A. T., Kacem, H. H., Abdallah, S. H., Reza, M. F., Abdullah, J. M., & Jaafar, H. (2020) · Cell & Bioscience · doi:10.1186/s13578-020-00487-z · Cited by 39
Self-citationPotential of mesenchymal stem cells alone, or in combination, to treat traumatic brain injury
Willing, A. E., Das, M., Howell, M., Mohapatra, S. S., & Mohapatra, S. (2020) · CNS Neuroscience & Therapeutics · doi:10.1111/cns.13300 · Cited by 35
Littlejohn, E. L., Scott, D., & Saatman, K. E. (2020) · Acta Neuropathologica Communications · doi:10.1186/s40478-020-00925-6 · Cited by 34
Ning, L., Zhang, Y., Zhang, Y., Zhu, M., Ding, W., Jiang, Y., Zhang, Y., Luo, J., & Qin, T. (2021) · Frontiers in Cell and Developmental Biology · doi:10.3389/fcell.2021.651583 · Cited by 34
Gupta, A., & Singh, S. (2021) · Molecular Neurobiology · doi:10.1007/s12035-021-02646-w · Cited by 36
“BMMSCs Insulin-like growth factor (IGF-1), bFGF, EGF Nestin, Sox-2 [56]”
BackgroundZhao, S., Heng, N., Sahlu, B. W., Wang, H., & Zhu, H. (2021) · International Journal of Molecular Sciences · doi:10.3390/ijms222413579 · Cited by 32
Regenerative Endodontic Procedures: A Perspective from Stem Cell Niche Biology
Marí‐Beffa, M., Segura-Egea, J. J., & Díaz‐Cuenca, A. (2016) · Journal of Endodontics · doi:10.1016/j.joen.2016.09.011 · Cited by 32
The brittle star genome illuminates the genetic basis of animal appendage regeneration
Parey, E., Ortega‐Martinez, O., Delroisse, J., Piovani, L., Czarkwiani, A., Dylus, D. V., Arya, S., Dupont, S., Thorndyke, M. C., Larsson, T., et al. (2024) · Nature Ecology & Evolution · doi:10.1038/s41559-024-02456-y · Cited by 37
“4b), as well as genes involved in signalling pathways known to promote cell proliferation in vertebrates and fruit flies (VEGF, AKT, insulin-like and JAK-STAT pathways) 93–96 (Fig.”
Xu, G., Li, Z., Huang, Z., Brunicardi, F. C., Fu, J., Song, C., Zou, H., & Sun, R. (2019) · Molecular Genetics & Genomic Medicine · doi:10.1002/mgg3.860 · Cited by 31
“IGF1 has been shown to play important roles in both normal and pathological biological processes including cancer (Brouwer‐ Visser & Huang, 2015; Bruchim, Attias, & Werner, 2009; Huat et al., 2014; Livingstone, 2013; Schlegel et al., 2013; Sekharam et al., 2003; Sjögren et al., 2010; Svensson et al., 2007; Tirapegui,…”
BackgroundRetractedAvilkina, V., Chauveau, C., & Mhenni, O. G. (2021) · Bone · doi:10.1016/j.bone.2021.116232 · Cited by 33
Effects of IGF-1 on neural differentiation of human umbilical cord derived mesenchymal stem cells
Zhao, L., Feng, Y., Chen, X., Yuan, J., Liu, X., Chen, Y., Zhao, Y., Liu, P., & Li, Y. (2016) · Life Sciences · doi:10.1016/j.lfs.2016.03.001 · Cited by 30
Zhao, T., Su, L., Ma, C.-Y., Zhai, X., Duan, Z., Zhu, Y., Zhao, G., Li, C., Wang, L., & Yang, D. (2015) · BMC Gastroenterology · doi:10.1186/s12876-015-0311-5 · Cited by 25
“Some previous studies also indicated that IGF-I upregualted tight junction protein expressions in osteoblast- like MC3T3-E1 cells and reduced apoptosis in mesenchymal stem cells [7, 8].”
ResultZalouli, V., Rajavand, H., Bayat, M., Khaleghnia, J., Sharifianjazi, F., Jafarinazhad, F., & Beheshtizadeh, N. (2023) · Biomedicine & Pharmacotherapy · doi:10.1016/j.biopha.2023.115078 · Cited by 27
RetractedParé, B., & Gros‐Louis, F. (2017) · Reviews in the Neurosciences · doi:10.1515/revneuro-2017-0004 · Cited by 24
“It also reduces apoptosis and promotes cell proliferation as well as survival of differentiated neural progenitor-like cells derived from mesenchymal stem cells (Huat et al., 2014).”
BackgroundIkeda, Y., Sakaue, M., Chijimatsu, R., Hart, D. A., Otsubo, H., Shimomura, K., Madry, H., Suzuki, T., Yoshikawa, H., Yamashita, T., et al. (2017) · Stem Cells International · doi:10.1155/2017/5804147 · Cited by 23
“IGF-1 promotes the proliferation of MSCs [24] and also leads to increased production of aggrecan and type 2 collagen and thus contributes to maintaining the phenotype of chondrocytes [23, 25].”
The factors affecting neurogenesis after stroke and the role of acupuncture
Mu, J.-D., Ma, L., Zhang, Z., Xu, Q., Zhang, Q., Ma, L.-H., & Sun, T. (2023) · Frontiers in Neurology · doi:10.3389/fneur.2023.1082625 · Cited by 22
“Insulin-like growth factor-1 (IGF-1) is a growth factor primarily produced by the liver in adults and plays a crucial role in cell proliferation, maturation, and survival (71).”
BackgroundLi, W., Yang, F., Gao, J.-X., Tang, Y., Wang, J., & Pan, Y. (2019) · Neuroscience · doi:10.1016/j.neuroscience.2019.06.041 · Cited by 20
Sha, Y., Wang, C., Chen, L., Xu, C., Zhang, B., & Hong, H. (2022) · Current Protein and Peptide Science · doi:10.2174/1389203724666221208145549 · Cited by 19
Role of mTOR complex in IGF-1 induced neural differentiation of DPSCs
Huang, D. Y., Shen, S., Cai, M., Lin, J., Lü, J., Xu, K., Zhang, J., Feng, G., Hu, Y., Zheng, K., et al. (2019) · Journal of Molecular Histology · doi:10.1007/s10735-019-09825-z · Cited by 19
Aguilera-Castrejon, A., Pasantes‐Morales, H., Montesinos, J. J., Cortés-Medina, L. V., Castro-Manrreza, M. E., Mayani, H., & Ramos‐Mandujano, G. (2016) · Neurochemical Research · doi:10.1007/s11064-016-2086-7 · Cited by 18
“The floating structures formed by NP-like cells increase in size with time in culture, and this has been interpreted as evidence of cell proliferation [22].”
BackgroundLiu, Y.-J., Cui, Z.-Y., Yang, A., Jallow, A. W., Huang, H., Shan, C., & Lee, S. (2021) · Aging · doi:10.18632/aging.203431 · Cited by 17
“Insulin-like growth factor (IGF-1) plays an essential role in promoting cell proliferation, differentiation and inhibiting neural apoptosis through the activation of PI3K/AKT signaling pathway [30].”
BackgroundGrowth Factors and Their Application in the Therapy of Hereditary Neurodegenerative Diseases
Issa, S. S., Fayoud, H. J., Shaimardanova, A. A., Sufianov, A. A., Суфианова, Г. З., Solovyeva, V. V., & Rizvanov, A. A. (2024) · Biomedicines · doi:10.3390/biomedicines12081906 · Cited by 17
“…to regulate a wide variety of cellular processes on both intercellular and intracellular levels [2], including cell proliferation and survival [10], cell growth and differentiation [11], cell motility [12], metabolism regulation [13], and other functions that will be discussed later in this…”
BackgroundProliferation and osteogenic differentiation of amniotic fluid-derived stem cells
Muduli, S., Lee, H. H., Yang, J.-S., Chen, T.-Y., Higuchi, A., Kumar, S. S., Alarfaj, A. A., Munusamy, M. A., Benelli, G., Murugan, K., et al. (2017) · Journal of Materials Chemistry B · doi:10.1039/c7tb01152k · Cited by 16
Li, X., Liao, D., Sun, G., & Chu, H. (2020) · Journal of Cellular and Molecular Medicine · doi:10.1111/jcmm.15158 · Cited by 16
Nonviral Reprogramming of Human Wharton's Jelly Cells Reveals Differences Between ATOH1 Homologues
Mellott, A. J., Devarajan, K., Shinogle, H. E., Moore, D. S., Talata, Z., Laurence, J. S., Forrest, M. L., Noji, S., Tanaka, E. I., Staecker, H., et al. (2015) · Tissue Engineering Part A · doi:10.1089/ten.tea.2014.0340 · Cited by 15
Li, X. Y., Wu, S. Y., & Leung, P. S. (2019) · International Journal of Molecular Sciences · doi:10.3390/ijms20174083 · Cited by 15
Tan, S. H. D., Zhi, P. K., Luo, Z., & Shi, J. (2015) · Neuroscience · doi:10.1016/j.neuroscience.2015.06.041 · Cited by 15
“As we all know, upregulation of insulin/insulin-like growth factors (IGF) signaling reinforced neurogenesis (Erickson et al., 2008; Speder et al., 2011; Supeno et al., 2013; Huat et al., 2014).”
Fazeli, Z., Omrani, M. D., & Ghaderian, S. M. H. (2016) · Neuroscience Letters · doi:10.1016/j.neulet.2016.07.056 · Cited by 14
Current and Future Trends in Adipose Stem Cell Differentiation into Neuroglia
George, S., Hamblin, M. R., & Abrahamse, H. (2018) · Photomedicine and Laser Surgery · doi:10.1089/pho.2017.4411 · Cited by 14
Increasing proliferation of murine adipose tissue-derived mesenchymal stem cells by TNF-α plus IFN-γ
Mohammadpour, H., Pourfathollah, A. A., Zarif, M. N., & Hashemi, S. M. (2015) · Immunopharmacology and Immunotoxicology · doi:10.3109/08923973.2015.1115519 · Cited by 14
Górna, S., & Domaszewska, K. (2022) · Journal of Clinical Medicine · doi:10.3390/jcm11123556 · Cited by 14
Park, S., Park, H.-L., Lee, S.-Y., & Jh, N. (2015) · International Journal of Obesity · doi:10.1038/ijo.2015.194 · Cited by 13
Xiao, B., Wang, G., & Li, W. (2020) · PeerJ · doi:10.7717/peerj.8907 · Cited by 13
“Gene miRNA BHLHE40 hsa-miR-374a-5p hsa-miR-8485 hsa-miR-4469 hsa-miR-454-3p FOXQ1 hsa-miR-378j hsa-miR-6507-3p hsa-miR-6839-5p hsa-miR-422a hsa-miR-6780a-3p hsa-miR-520h hsa-miR-1271-5p hsa-miR-520g-3p hsa-miR-506-3p HBEGF hsa-miR-4659a-3p hsa-miR-6868-3p hsa-miR-4659b-3p hsa-miR-30a-3p hsa-miR-30e-3p hsa-miR-4254 hsa…”
InfluentialPatil, S., Fageeh, H. N., Fageeh, H. I., Ibraheem, W., Alshehri, A. S., Albrakati, A., Almoammar, S., Almagbol, M., Dewan, H., Khan, S. S., et al. (2022) · Saudi Journal of Biological Sciences · doi:10.1016/j.sjbs.2022.02.039 · Cited by 13
“The hypoxic environment also promoted osteogenic differentiation via the upregulation of growth factors (Hung et al., 2012) Hypoxia preconditioning is a widely adopted strategy as the concentration of O2 employed in in vitro conditions is high whereas the oxygen concentration in an ischemic…”
BackgroundLi, H., Yu, S., Hao, F., Sun, X., Zhao, J., Xu, Q., & Duan, D. (2018) · Cell Biochemistry and Function · doi:10.1002/cbf.3353 · Cited by 13
“differentiation was initiated according to the protocols described by Huat et al.(3) The P4 BMSCs were harvested, seeded into a 24‐well plate (10(5) cells/cm(2)), and cultured in DMEM medium for 4 hours; the medium was subsequently replaced by NeuroCultTM NS‐A Basal Medium (Rat) and NeuroCultTM NS‐A Proliferation Supp…”
BackgroundMethodInfluentialUpregulated IGF‑1 in the lungs of asthmatic mice originates from alveolar macrophages
He, J., Mu, M., Wang, H., Ma, H., Tang, X., Fang, Q., Guo, S., & Song, C. (2018) · Molecular Medicine Reports · doi:10.3892/mmr.2018.9726 · Cited by 13
Aghdam, S. Y., Kenchegowda, D., Sharma, N. K., Holmes‐Hampton, G. P., Legesse, B., Moroni, M., & Ghosh, S. P. (2020) · International Journal of Molecular Sciences · doi:10.3390/ijms21145049 · Cited by 12
Qiao, H., Zhang, R., Gao, L., Guo, Y., Wang, J., Zhang, R., Li, X., Li, C., Chen, Y., & Cao, F. (2016) · BioMed Research International · doi:10.1155/2016/1363902 · Cited by 11
Jalali, M. S., Saki, G., Farbood, Y., Azandeh, S., Mansouri, E., Dehcheshmeh, M. G., & Sarkaki, A. (2021) · Journal of Chemical Neuroanatomy · doi:10.1016/j.jchemneu.2021.101921 · Cited by 11
Xie, L. H., Fang, Q., Wei, X., Zhou, L., & Wang, S. (2021) · Journal of Neurophysiology · doi:10.1152/jn.00124.2021 · Cited by 11
Oral administration of cyclic glycyl-proline facilitates task learning in a rat stroke model
Kaneko, H., Namihira, M., Yamamoto, S., Numata, N., & Hyodo, K. (2021) · Behavioural Brain Research · doi:10.1016/j.bbr.2021.113561 · Cited by 11
Cell-Based Therapies for Glaucoma
Luis, J., Eastlake, K., Lamb, W. D. B., Limb, G. A., Jayaram, H., & Khaw, P. T. (2023) · Translational Vision Science & Technology · doi:10.1167/tvst.12.7.23 · Cited by 11
Singh, A. K., & Kashyap, M. P. (2015) · Molecular Neurobiology · doi:10.1007/s12035-015-9202-6 · Cited by 11
Adipose Tissues Have Been Overlooked as Players in Prostate Cancer Progression
Liermann-Wooldrik, K. T., Kosmacek, E. A., & Oberley‐Deegan, R. E. (2024) · International Journal of Molecular Sciences · doi:10.3390/ijms252212137 · Cited by 11
“Additionally, adipocytes secrete insulin-like growth factor-1 (IGF-1) that stimulates angiogenic growth factors in endothelial cells and ASCs to proliferate and survive [26,27].”
Chen, C., Chang, C.-J., Kuo, C., Luo, G.-J., Dash, B. S., Govindaraju, D. T., & Chen, J. (2025) · International Journal of Biological Macromolecules · doi:10.1016/j.ijbiomac.2025.144756 · Cited by 9
Kim, Y., Jo, D., Arjunan, A., Ryu, Y., Lim, Y.-H., Choi, S. Y., Kim, H. K., & Song, J. (2024) · International Journal of Molecular Sciences · doi:10.3390/ijms25052567 · Cited by 10
“Previous studies have shown that IGF-1 boosts neuronal cell differentiation and neuronal stem cell proliferation [100,101].”
BackgroundWang, J., Wang, X., Chen, H., Liu, J., Tredget, E. E., & Wu, Y. (2017) · Inflammation · doi:10.1007/s10753-017-0655-9 · Cited by 9
“According to literature, IGF-1 plays significant roles in the differentiation of mesenchymal stem cells by enhancing the proliferation and reducing the apoptosis [41, 42].”
BackgroundMaillacheruvu, P. F., Engel, L. M., Crum, I. T., Agrawal, D. K., & Peeples, E. S. (2017) · Pediatric Research · doi:10.1038/pr.2017.251 · Cited by 9
Wang, Q., Zhang, F., & Hong, Y. (2018) · Molecular Medicine Reports · doi:10.3892/mmr.2018.8445 · Cited by 9
“Previous studies indicated that additional supplements of the growth factors, such as insulin-like growth factor 1 (IGF-1), fibroblast growth factor, epidermal growth factor, basic fibroblast growth factor (bFGF) and platelet-derived growth factor may promote the proliferation of MSCs (11-13).”
Ramos, D. M., Abdulmalik, S., Arul, M. R., Sardashti, N., Banasavadi‐Siddegowda, Y., Nukavarapu, S. P., Drissi, H., & Kumbar, S. G. (2022) · ACS Applied Bio Materials · doi:10.1021/acsabm.2c00243 · Cited by 8
Zhang, G., Zhou, J., Huang, W. M., Fang, M., Yu, L., Wang, H., & Zhang, Y. (2019) · Toxicology · doi:10.1016/j.tox.2019.152237 · Cited by 8
Chen, T., Huang, D., Chen, G., Ting-shu, Y., Yi, J., & Tian, M. (2014) · Journal of Molecular Histology · doi:10.1007/s10735-014-9599-7 · Cited by 8
Xu, Y., He, F., Qi, F., Yang, G., Zheng, F., Yang, J., Wang, X., Liu, J., & Zou, J. (2017) · Neurobiology of Learning and Memory · doi:10.1016/j.nlm.2017.03.002 · Cited by 8
“Accumulating evidence has demonstrated that cross talk between inflammation and Wnt/b-catenin signaling contributes to neurogenesis (Jiang et al., 2015; L’Episcopo et al., 2012).”
BackgroundMechanical stretch promotes antioxidant responses and cardiomyogenic differentiation in P19 cells
Cheng, J., Zou, Q., Xue, Y., Sun, C., & Zhang, D. (2021) · Journal of Tissue Engineering and Regenerative Medicine · doi:10.1002/term.3184 · Cited by 7
“, 2013), trophic factors such as insulin‐ like growth factor‐1, bone morphogenetic protein‐2, and platelet‐ derived growth factors (Beederman et al., 2013; Huat et al., 2014; Li et al., 2014), as well as the extracellular matrix and mechanical cues”
BackgroundRetractedTork, M. A. B., Saberifar, M., Yekta, H. J., Hajinejad, M., Ravandi, H. H., Gorji, A., & Negah, S. S. (2025) · Scientific Reports · doi:10.1038/s41598-025-85698-5 · Cited by 7
Network-Based Method for Identifying Co-Regeneration Genes in Bone, Dentin, Nerve and Vessel Tissues
Chen, L., Pan, H., Zhang, Y., Feng, K., Kong, X., Huang, T., & Cai, Y. (2017) · Genes · doi:10.3390/8100252 · Cited by 7
The role of insulin-like growth factors in modulating the activity of dental mesenchymal stem cells
Bashir, N. Z. (2020) · Archives of Oral Biology · doi:10.1016/j.archoralbio.2020.104993 · Cited by 7
Translational Medicine Strategies in Drug Development for Neurodevelopmental Disorders
Srivastava, S., Şahin, M., & Prock, L. A. (2019) · Handbook of behavioral neuroscience · doi:10.1016/b978-0-12-803161-2.00022-9 · Cited by 6
Mohamed, O. A., Samir, S., Omar, H., Hassan, E. A., & Abdelazeem, E. (2022) · Recent Patents on Biotechnology · doi:10.2174/1872208316666220412105822 · Cited by 6
Kurniawan, F., Tahapary, D. L., de Ruiter, K., Yunir, E., Biermasz, N. R., Smit, J. W. A., Supali, T., Sartono, E., Yazdanbakhsh, M., & Soewondo, P. (2020) · Scientific Reports · doi:10.1038/s41598-020-75781-4 · Cited by 6
Wong, T.-H., Chen, T., Tseng, K., Chen, Z.-Y., Chen, C., Lin, F., Wu, H., & Lin, S. (2020) · Aging · doi:10.18632/aging.202166 · Cited by 6
“IGF-I is a mitogen and a mediator of skeletal growth [11, 12].”
BackgroundHuat, T. J., Khan, A. A., Abdullah, J. M., Idris, F. M., & Jaafar, H. (2015) · Genomics Data · doi:10.1016/j.gdata.2015.06.015 · Cited by 6
“Cell culture Primary culture of MSCs was isolated from Sprague Dawley rats' bone marrow tissue by their selective adherence to plastic surface as described previously [2].”
Self-citationLee, H., Han, N. R., Hwang, J. Y., Yun, J. I., Kim, C., Park, K.-H., & Lee, S. T. (2016) · DNA and Cell Biology · doi:10.1089/dna.2016.3237 · Cited by 6
“…et al. , 2015) as chemical compounds, epidermal growth factor (EGF) (Huat et al. , 2014; Mukai et al. , 2016), basic fibroblast growth factor (bFGF) (Huat et al. , 2014; Mukai et al. , 2016), and brain-derived neurotrophic factor (BDNF) (Wang et al. , 2013; Tsai et al. , 2014) as growth factors,…”
InfluentialSeeger, F. H., Rasper, T., Bonig, H. B., Aßmus, B., Zeiher, A. M., & Dimmeler, S. (2014) · Journal of Cardiovascular Translational Research · doi:10.1007/s12265-014-9584-2 · Cited by 5
Zhao, X., Han, C., Zeng, Z., Liu, L., Wang, H., Xu, J., Feng, Z., Little, P. J., Quirion, R., & Zheng, W. (2020) · Oxidative Medicine and Cellular Longevity · doi:10.1155/2020/5173184 · Cited by 5
“Insulin-like growth factor 1 receptor (IGF-1R) signaling mediated by IGF-1 is an important pathway for the survival and maintenance of multiple cell types within the central nervous system [12].”
Gul, M. T., Khattak, M. N. K., Qaisar, R., Jayakumar, M. N., Samsudin, A. B. R., & Khan, A. A. (2025) · Molecular Neurobiology · doi:10.1007/s12035-025-04702-1 · Cited by 5
“The differentiation potential of MSCs into NPCs is enhanced with the addition of insulin-like growth factor-1 (IGF-1) [14, 15].”
Self-citationKurşun, K. (2025) · Veterinary Medicine and Science · doi:10.1002/vms3.70400 · Cited by 4
Al-Zikri, P. N. H., Huat, T. J., Khan, A. A., Patar, A., Reza, F., Idris, F. M., Abdullah, J. M., & Jaafar, H. (2022) · Heliyon · doi:10.1016/j.heliyon.2022.e10384 · Cited by 4
“Differentiation of BMSCs into neural progenitor-like stem cells (NPCs) BMSCs were induced into a neural lineage according to the protocol published previously (Huat et al., 2014).”
BackgroundMethodResultInfluentialSelf-citationKyun, S., Kim, J., Hwang, D., Jang, I., Park, H., & Lim, K. (2024) · Physiological Reports · doi:10.14814/phy2.15952 · Cited by 3
Peeples, E. S., Dafferner, A. J., Jiang, J., Lyden, E. R., Punsoni, M., & Agrawal, D. K. (2019) · Developmental Neuroscience · doi:10.1159/000505264 · Cited by 4
Metadata
- Authors
- Huat, T. J., Khan, A. A., Pati, S., Mustafa, Z., Abdullah, J. M., & Jaafar, H.
- Affiliations
- Universiti Sains Malaysia (MY)
- Corresponding author
- Huat, Tee Jong
- Venue
- BMC Neuroscience
- Published
- 2014-07-22
- Volume
- 15
- Issue
- 1
- Pages
- 91-91
- ISSN
- 1471-2202 (ISSN-L)
- PMC
- PMC4117972
- OpenAlex
- W2045159954
- Cited by
- 129
- References
- 29
- Citations by year
- 2026: 1 · 2025: 10 · 2024: 9 · 2023: 7 · 2022: 7 · 2021: 13 · 2020: 20 · 2019: 13 · 2018: 9 · 2017: 14 · 2016: 14 · 2015: 9 · 2014: 3
- FWCI
- 6.68
- Type
- journal article
- Language
- en
- Open access
- gold
- doi.org
- Licence
- cc-by
- Locations
- BMC Neuroscience (publishedVersion, cc-by)
- PubMed Central (publishedVersion, cc-by)
- PubMed (publishedVersion)
- Greater South Information System
- Funders
- Universiti Sains Malaysia
- Topics
- Life Sciences › Biochemistry, Genetics and Molecular Biology › Cell Biology › Mesenchymal stem cell research
- Life Sciences › Neuroscience › Developmental Neuroscience › Neurogenesis and neuroplasticity mechanisms
- Life Sciences › Biochemistry, Genetics and Molecular Biology › Molecular Biology › Pluripotent Stem Cells Research
- Keywords
- insulin-like growth factor I, mesenchymal stem cells, neural progenitor-like cells, neuronal differentiation, cell proliferation, apoptosis, growth factor combination, epidermal growth factor, basic fibroblast growth factor, LiF, brain-derived neurotrophic factor, nestin, neurospheres, neurodegenerative disease treatment
- MeSH terms
- Animals, Cell Survival, Cells, Cultured, Insulin-Like Growth Factor I, Neuroglia, Neurons, Rats, Sprague-Dawley, Apoptosis, Intercellular Signaling Peptides and Proteins, Cell Proliferation, Neurogenesis, Neural Stem Cells, Mesenchymal Stem Cells, Nestin
About these checks
Registry, retraction, Cites and statistics results are computed, not judged, with one exception: a printed reference that no index lists is read once by a model before it counts as a citation error. Claims are extracted by a model and kept only when their quote appears verbatim in the text; each cited source is then checked, with a model’s help, for whether it says what the claim relies on. Those verdicts can be wrong — read the claim’s quote and the cited source before relying on one.
Statistics and arithmetic are recomputed, not judged.
Confidence bands are shown only for fields calibrated on our annotated test set. None is calibrated yet, so no band is shown.
What counts as a claim ›How we measure confidence ›How we check this ›
Are you an author, or do you see a problem with this page? Request a review
