

The DOI matches its Crossref record; 57 of the 57 references it cites were found in a registry or an index.
Adjustment for reporting bias in network meta-analysis of antidepressant trials
Open accessAbstract
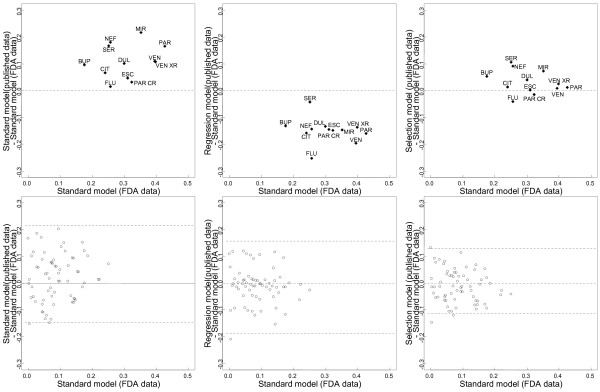
BACKGROUND: Network meta-analysis (NMA), a generalization of conventional MA, allows for assessing the relative effectiveness of multiple interventions. Reporting bias is a major threat to the validity of MA and NMA. Numerous methods are available to assess the robustness of MA results to reporting bias. We aimed to extend such methods to NMA. METHODS: We introduced 2 adjustment models for Bayesian NMA. First, we extended a meta-regression model that allows the effect size to depend on its standard error. Second, we used a selection model that estimates the propensity of trial results being published and in which trials with lower propensity are weighted up in the NMA model. Both models rely on the assumption that biases are exchangeable across the network. We applied the models to 2 networks of placebo-controlled trials of 12 antidepressants, with 74 trials in the US Food and Drug Administration (FDA) database but only 51 with published results. NMA and adjustment models were used to estimate the effects of the 12 drugs relative to placebo, the 66 effect sizes for all possible pair-wise comparisons between drugs, probabilities of being the best drug and ranking of drugs. We compared the results from the 2 adjustment models applied to published data and NMAs of published data and NMAs of FDA data, considered as representing the totality of the data. RESULTS: Both adjustment models showed reduced estimated effects for the 12 drugs relative to the placebo as compared with NMA of published data. Pair-wise effect sizes between drugs, probabilities of being the best drug and ranking of drugs were modified. Estimated drug effects relative to the placebo from both adjustment models were corrected (i.e., similar to those from NMA of FDA data) for some drugs but not others, which resulted in differences in pair-wise effect sizes between drugs and ranking. CONCLUSIONS: In this case study, adjustment models showed that NMA of published data was not robust to reporting bias and provided estimates closer to that of NMA of FDA data, although not optimal. The validity of such methods depends on the number of trials in the network and the assumption that conventional MAs in the network share a common mean bias mechanism.
Overview
The claims and statistics of this paper haven’t been checked yet.
Run the check — free, no account needed. It reads the open-access text and checks the sources it cites.
Integrity signals
Registry
Cites
Statistics
Figures
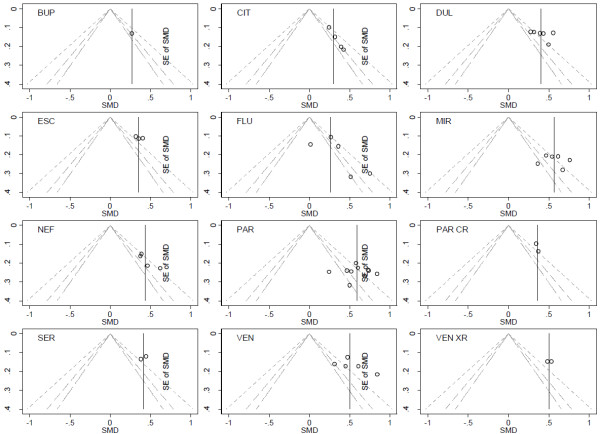
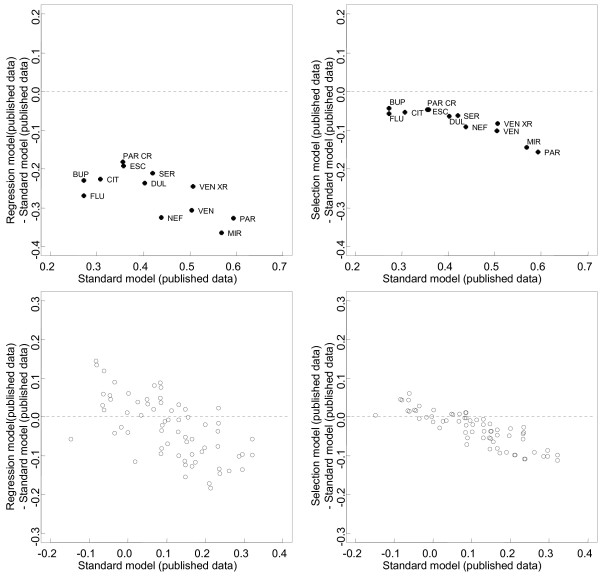
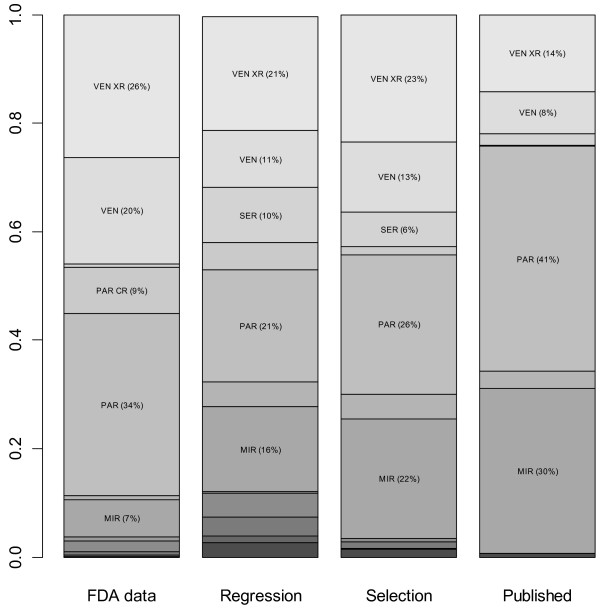
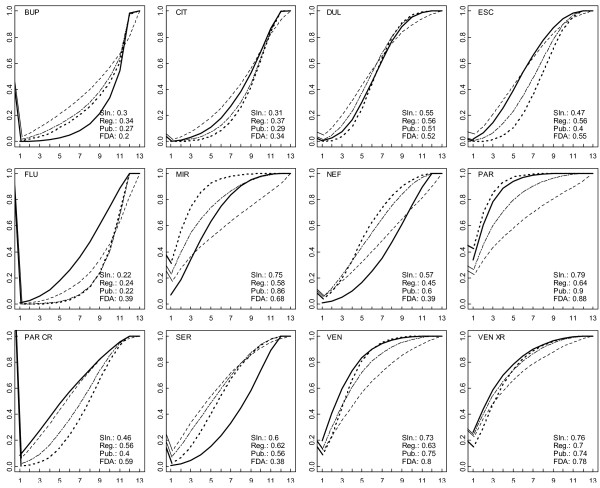
Verification
Claims the paper makes
The claims and statistics of this paper haven’t been checked yet.
Run the check — free, no account needed. It reads the open-access text and checks the sources it cites.
Claims other papers make about this one
Each is checked against this paper’s own text: does it say what the citing paper says it does?
In the citing paper
“To check for the presence of bias due to small‐scale studies, which may lead to publication bias in NMA, a network funnel plot was generated (Figure S8) and visually inspected using the criterion of symmetry. 37”
From What exercise prescription is optimal to improve body composition and cardiorespiratory fitness in adults living with obesity? A network meta‐analysis (2021) · cites this paper as [37]
In the citing paper
“To check for the presence of bias due to small‐scale studies, which may lead to publication bias in NMA, a network funnel plot was generated (Figure S8) and visually inspected using the criterion of symmetry. 37”
From What exercise prescription is optimal to improve body composition and cardiorespiratory fitness in adults living with obesity? A network meta‐analysis (2021) · cites this paper as [37]
Self-check
Percentages, sums and reported differences re-computed from the paper’s own numbers.
The self-check needs the paper’s full text.
Citations
Cites
Gelman, A., Carlin, J. B., Stern, H. S., & Rubin, D. B. (2003) · doi:10.1201/9780429258480 · Cited by 27,276
Duval, S., & Tweedie, R. (2000) · Biometrics · doi:10.1111/j.0006-341x.2000.00455.x · Cited by 14,099
Salanti, G., Ades, A. E., & Ioannidis, J. P. A. (2011) · Journal of Clinical Epidemiology · doi:10.1016/j.jclinepi.2010.03.016 · Cited by 3,766
Selective publication of antidepressant trials and its influence on apparent efficacy
Turner, E. H., Matthews, A. M., Linardatos, E., Tell, R. A., & Rosenthal, R. (2008) · New England Journal of Medicine · doi:10.1056/nejmsa065779 · Cited by 2,435
Combination of direct and indirect evidence in mixed treatment comparisons
Lu, G., & Ades, A. E. (2004) · Statistics in Medicine · doi:10.1002/sim.1875 · Cited by 2,172
Pharmaceutical industry sponsorship and research outcome and quality: systematic review
Lexchin, J., Bero, L. A., Djulbegovic, B., & Clark, O. (2003) · BMJ · doi:10.1136/bmj.326.7400.1167 · Cited by 2,147 · cited 1×
“In head-to-head trials, the direction of bias is uncertain but assumptions in defining Iijk could be that the sponsored treatment is favored (sponsorship bias) [45,46] or that the newest treatment is favored (optimism bias) [37,47,48].”
BackgroundSystematic Review of the Empirical Evidence of Study Publication Bias and Outcome Reporting Bias
Dwan, K., Altman, D. G., Arnaiz, J. A., Bloom, J., Chan, A.-W., Cronin, E., Decullier, E., Easterbrook, P. J., Von Elm, E., Gamble, C., et al. (2008) · PLoS ONE · doi:10.1371/journal.pone.0003081 · Cited by 1,546
Network meta‐analysis for indirect treatment comparisons
Lumley, T. (2002) · Statistics in Medicine · doi:10.1002/sim.1201 · Cited by 1,206
Nedelman, J. R. (2005) · Computational Statistics · doi:10.1007/bf02741321 · Cited by 1,087
Evaluation of networks of randomized trials
Salanti, G., Higgins, J. P., Ades, A., & Ioannidis, J. P. (2008) · Statistical Methods in Medical Research · doi:10.1177/0962280207080643 · Cited by 1,078
Cited by
Sorted by citations
Hutton, B., Salanti, G., Caldwell, D. M., Chaimani, A., Schmid, C. H., Cameron, C., Ioannidis, J. P. A., Straus, S., Thorlund, K., Jansen, J. P., et al. (2015) · Annals of Internal Medicine · doi:10.7326/m14-2385 · Cited by 8,269
GetReal in network meta-analysis: a review of the methodology
Efthimiou, O., Debray, T. P. A., van Valkenhoef, G., Trelle, S., Panayidou, K., Moons, K. G. M., Reitsma, J. B., Shang, A., Salanti, G., & on behalf of GetReal Methods Review Group (2016) · Research Synthesis Methods · doi:10.1002/jrsm.1195 · Cited by 401
Assessing key assumptions of network meta‐analysis: a review of methods
Donegan, S., Williamson, P. R., D’Alessandro, U., & Smith, C. T. (2013) · Research Synthesis Methods · doi:10.1002/jrsm.1085 · Cited by 275
O'Donoghue, G., Blake, C., Cunningham, C., Lennon, O., & Perrotta, C. (2021) · Obesity Reviews · doi:10.1111/obr.13137 · Cited by 190
Network meta-analysis for comparing treatment effects of multiple interventions: an introduction
Catalá-López, F., Tobı́as, A., Cameron, C. G., Moher, D., & Hutton, B. (2014) · Rheumatology International · doi:10.1007/s00296-014-2994-2 · Cited by 172
Metadata
- Authors
- Trinquart, L., Chatellier, G., & Ravaud, P.
- Affiliations
- Cochrane (GB)
- Inserm (FR)
- Corresponding author
- Trinquart, Ludovic
- Venue
- BMC Medical Research Methodology
- Published
- 2012-09-27
- Volume
- 12
- Issue
- 1
- Pages
- 150-150
- ISSN
- 1471-2288 (ISSN-L)
- PMC
- PMC3537713
- OpenAlex
- W2103017208
- Cited by
- 122
- References
- 55
- Citations by year
- 2026: 2 · 2025: 13 · 2024: 8 · 2023: 9 · 2022: 5 · 2021: 18 · 2020: 16 · 2019: 11 · 2018: 11 · 2017: 9 · 2016: 5 · 2015: 4 · 2014: 6 · 2013: 5
- FWCI
- 1.32
- Type
- journal article
- Language
- en
- Open access
- gold
- doi.org
- Licence
- Locations
- BMC Medical Research Methodology (publishedVersion, cc-by)
- Europe PMC (PubMed Central) (publishedVersion, cc-by)
- PubMed Central (publishedVersion, cc-by)
- PubMed (publishedVersion)
- HAL (submittedVersion, other-oa)
- DOAJ (DOAJ: Directory of Open Access Journals) (submittedVersion)
- Topics
- Social Sciences › Decision Sciences › Statistics, Probability and Uncertainty › Meta-analysis and systematic reviews
- Physical Sciences › Mathematics › Statistics and Probability › Statistical Methods in Clinical Trials
- Health Sciences › Nursing › Issues, ethics and legal aspects › Pharmaceutical industry and healthcare
- Keywords
- reporting bias, network meta-analysis, antidepressants, Bayesian network meta-analysis, meta-regression, selection model, publication bias, drug ranking, bias correction
- MeSH terms
- Antidepressive Agents, Clinical Trials as Topic, Humans, Regression Analysis, Research Design, Meta-Analysis as Topic, Bias, Case-Control Studies, Publication Bias
About these checks
Registry, retraction, Cites and statistics results are computed, not judged, with one exception: a printed reference that no index lists is read once by a model before it counts as a citation error. Claims are extracted by a model and kept only when their quote appears verbatim in the text; each cited source is then checked, with a model’s help, for whether it says what the claim relies on. Those verdicts can be wrong — read the claim’s quote and the cited source before relying on one.
Statistics and arithmetic are recomputed, not judged.
Confidence bands are shown only for fields calibrated on our annotated test set. None is calibrated yet, so no band is shown.
What counts as a claim ›How we measure confidence ›How we check this ›
Are you an author, or do you see a problem with this page? Request a review
