

The DOI matches its Crossref record; 23 of the 23 references it cites were found in a registry or an index.
Interpreting the concordance statistic of a logistic regression model: relation to the variance and odds ratio of a continuous explanatory variable
Open accessAbstract
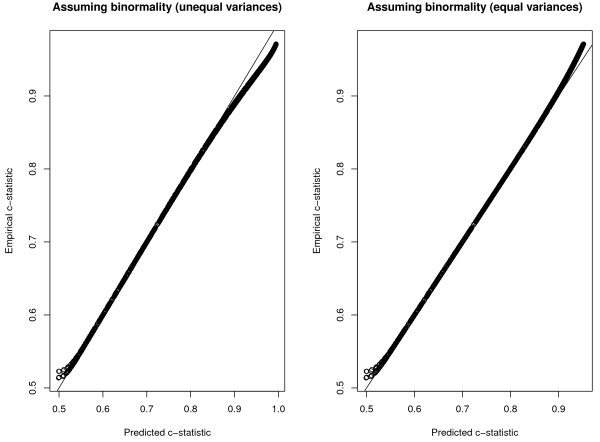
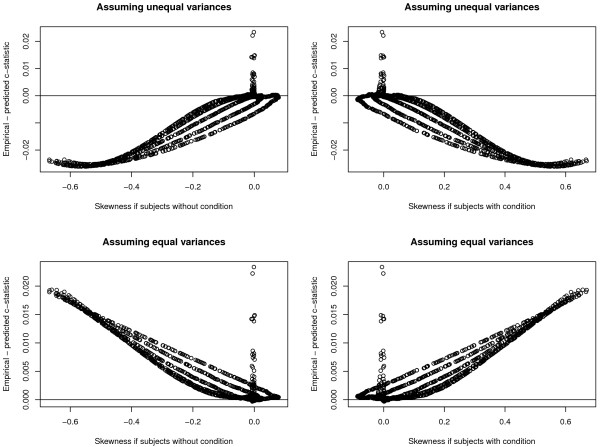
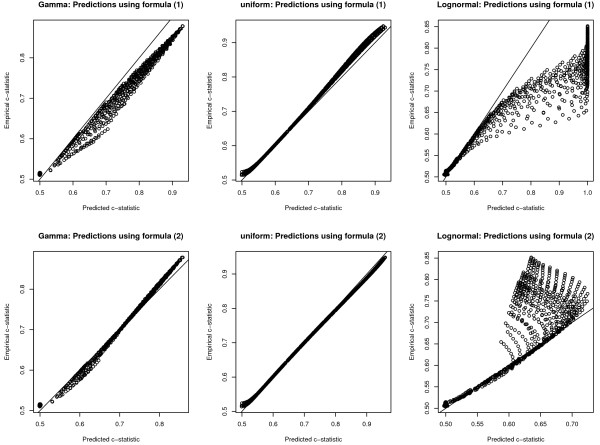
BACKGROUND: When outcomes are binary, the c-statistic (equivalent to the area under the Receiver Operating Characteristic curve) is a standard measure of the predictive accuracy of a logistic regression model. METHODS: An analytical expression was derived under the assumption that a continuous explanatory variable follows a normal distribution in those with and without the condition. We then conducted an extensive set of Monte Carlo simulations to examine whether the expressions derived under the assumption of binormality allowed for accurate prediction of the empirical c-statistic when the explanatory variable followed a normal distribution in the combined sample of those with and without the condition. We also examine the accuracy of the predicted c-statistic when the explanatory variable followed a gamma, log-normal or uniform distribution in combined sample of those with and without the condition. RESULTS: Under the assumption of binormality with equality of variances, the c-statistic follows a standard normal cumulative distribution function with dependence on the product of the standard deviation of the normal components (reflecting more heterogeneity) and the log-odds ratio (reflecting larger effects). Under the assumption of binormality with unequal variances, the c-statistic follows a standard normal cumulative distribution function with dependence on the standardized difference of the explanatory variable in those with and without the condition. In our Monte Carlo simulations, we found that these expressions allowed for reasonably accurate prediction of the empirical c-statistic when the distribution of the explanatory variable was normal, gamma, log-normal, and uniform in the entire sample of those with and without the condition. CONCLUSIONS: The discriminative ability of a continuous explanatory variable cannot be judged by its odds ratio alone, but always needs to be considered in relation to the heterogeneity of the population.
Overview
The claims and statistics of this paper haven’t been checked yet.
Run the check — free, no account needed. It reads the open-access text and checks the sources it cites.
Integrity signals
Registry
Cites
Statistics
Figures
Verification
Claims the paper makes
The claims and statistics of this paper haven’t been checked yet.
Run the check — free, no account needed. It reads the open-access text and checks the sources it cites.
Claims other papers make about this one
Each is checked against this paper’s own text: does it say what the citing paper says it does?
The cited source says what the claim attributes to it.
In the citing paper
“Although ROC analysis is mathematically related to logistic regression (Austin & Steyerberg, 2012)”
From Stress, stress-induced cortisol responses, and eyewitness identification performance (2016) · cites this paper as Austin & Steyerberg, 2012
In the citing paper
“For instance, it is well known that a model’s discrimination performance tends to deteriorate when it is applied to populations or subgroups with a more homogeneous case-mix, as there is less separation of predicted risks across individuals.”
From A framework for meta-analysis of prediction model studies with binary and time-to-event outcomes (2019) · cites this paper as [20]
In the citing paper
“For instance, for prediction models with a binary outcome, the c-statistic is a reparameterization of Somer’s D,19 and can also be derived from the distribution of the linear predictor,20 Cohen’s effect size,20 or several correlation indices.21”
From A framework for meta-analysis of prediction model studies with binary and time-to-event outcomes (2019) · cites this paper as [20]
Self-check
Percentages, sums and reported differences re-computed from the paper’s own numbers.
The self-check needs the paper’s full text.
Citations
Cites
R: A Language and Environment for Statistical Computing
R Core Team (2000) · doi:10.32614/r.manuals · Cited by 355,893
(1990) · Choice Reviews Online · doi:10.5860/choice.27-3338 · Cited by 35,305
The meaning and use of the area under a receiver operating characteristic (ROC) curve.
Hanley, J. A., & McNeil, B. J. (1982) · Radiology · doi:10.1148/radiology.143.1.7063747 · Cited by 21,856
Regression Modeling Strategies
Harrell, F. E. (2001) · Springer series in statistics · doi:10.1007/978-1-4757-3462-1 · Cited by 9,270
Kupper, L. L., Hosmer, D. W., & Lemeshow, S. A. (1990) · Journal of the American Statistical Association · doi:10.2307/2290035 · Cited by 7,690
Harrell (2015) · Springer Series in Statistics · doi:10.1007/978-3-319-19425-7 · Cited by 6,878
Austin, P. C. (2009) · Statistics in Medicine · doi:10.1002/sim.3697 · Cited by 6,758
Self-citationAssessing the Performance of Prediction Models: A Framework for Traditional and Novel Measures
Steyerberg, E. W., Vickers, A. J., Cook, N. R., Gerds, T., Gonen, M., Obuchowski, N., Pencina, M. J., & Kattan, M. W. (2010) · Epidemiology · doi:10.1097/ede.0b013e3181c30fb2 · Cited by 5,170
Self-citationClinical Prediction Models: A Practical Approach to Development, Validation, and Updating
Steyerberg, E. W. (2019) · Statistics for Biology and Health · doi:10.1007/978-3-030-16399-0 · Cited by 3,281
Self-citationDeeks, J. J., Macaskill, P., & Irwig, L. (2005) · Journal of Clinical Epidemiology · doi:10.1016/j.jclinepi.2005.01.016 · Cited by 2,910
Research works printed but not linked: 2
- Cohen J: Statistical Power Analysis for the Behavioural Sciences. 1988, Lawrence Erlbaum Associates, Hillsdale, NJ, 2
- Tu JV, Donovan LR, Lee DS, Austin PC, Ko DT, Wang JT, et al: Quality of Cardiac Care in Ontario. 2004, Institute for Clinical Evaluative Sciences, Toronto, Ontario
Cited by
Sorted by citations
Items 101–200 of 271
Prognostic factors and clinical nomogram for in-hospital mortality in traumatic brain injury
Tunthanathip, T., Phuenpathom, N., & Jongjit, A. (2023) · The American Journal of Emergency Medicine · doi:10.1016/j.ajem.2023.12.037 · Cited by 16
Colilla, S., Yom‐Tov, E., Zhang, L., Kürzinger, M., Tcherny‐Lessenot, S., Penfornis, C., Jen, S., Gonzalez, D. S., Caubel, P., Welsh, S., et al. (2017) · Drug Safety · doi:10.1007/s40264-017-0507-4 · Cited by 16
Stem size selectivity is stronger than species preferences for beaver, a central place forager
Mahoney, M. J., & Stella, J. C. (2020) · Forest Ecology and Management · doi:10.1016/j.foreco.2020.118331 · Cited by 16
Kappen, T. H., & Peelen, L. M. (2016) · Current Opinion in Anaesthesiology · doi:10.1097/aco.0000000000000386 · Cited by 16
Prediction of Primary Care Depression Outcomes at Six Months: Validation of DOC-6 ©
Angstman, K. B., Garrison, G. M., González, C. A., Cozine, D. W., Cozine, E. W., & Katzelnick, D. J. (2017) · The Journal of the American Board of Family Medicine · doi:10.3122/jabfm.2017.03.160313 · Cited by 14
Wang, Z., Chen, Y., & Díaz, R. (2019) · Environmental Entomology · doi:10.1093/ee/nvz019 · Cited by 16
Dietz, N. E., Sharma, M., Alhourani, A., Ugiliweneza, B., Wang, D., Nuno, M. A., Drazin, D. G., & Boakye, M. (2018) · Neurosurgical FOCUS · doi:10.3171/2018.8.focus18331 · Cited by 16
Socio-economic disparities and returning to work following an injury
Savitsky, B., Radomislensky, I., Goldman, S., Gitelson, N., Frid, Z., & Peleg, K. (2020) · Israel Journal of Health Policy Research · doi:10.1186/s13584-020-00392-3 · Cited by 15
Kim, K.-M., Jeon, H. S., & Lee, J. (2016) · Journal of Korean Medical Science · doi:10.3346/jkms.2017.32.1.4 · Cited by 13
Austin, P. C. (2023) · BMC Medical Research Methodology · doi:10.1186/s12874-023-01836-5 · Cited by 14
Self-citationKaltenborn, A., Matzke, S., Kleine, M., Krech, T., Ramackers, W., Vondran, F. W. R., Klempnauer, J. L., Bektaş, H., & Schrem, H. (2015) · Journal of Surgical Oncology · doi:10.1002/jso.24116 · Cited by 14
Rospleszcz, S., Thorand, B., Gala, T. D. L. H., Meisinger, C., Holle, R., Köenig, W., Mansmann, U., & Peters, A. (2018) · Journal of Epidemiology & Community Health · doi:10.1136/jech-2018-211102 · Cited by 14
The relationship between the C-statistic and the accuracy of program-specific evaluations
Wey, A. R., Salkowski, N., Kasiske, B. L., Skeans, M. A., Gustafson, S. K., Israni, A. K., & Snyder, J. J. (2018) · American Journal of Transplantation · doi:10.1111/ajt.15132 · Cited by 14
Elbashir, M. K., Almotilag, A., Mahmood, M. A., & Mohammed, M. (2024) · Diagnostics · doi:10.3390/diagnostics14192178 · Cited by 13
Bobbio, E., Eldhagen, P., Polte, C. L., Hjalmarsson, C., Karason, K., Rawshani, A., Darlington, P., Kullberg, S., Sörensson, P., Bergh, N., et al. (2023) · Journal of the American Heart Association · doi:10.1161/jaha.123.029481 · Cited by 13
Austin, P. C., Schuster, T., & Platt, R. W. (2015) · BMC Medical Research Methodology · doi:10.1186/s12874-015-0081-3 · Cited by 13
Self-citationMTHFR,TYMSandSLCO1B1Polymorphisms and Adverse Liver Effects of Methotrexate in Rheumatoid Arthritis
Sundbaum, J. K., Baecklund, E., Eriksson, N., Hallberg, P., Kohnke, H., & Wadelius, M. (2020) · Pharmacogenomics · doi:10.2217/pgs-2019-0186 · Cited by 13
Mwove, J. K., Imathiu, S., Orina, I., & Karanja, P. N. (2020) · Current Research in Nutrition and Food Science Journal · doi:10.12944/crnfsj.8.3.26 · Cited by 12
Mahoney, M. J., Johnson, L. K., Guinan, A. Z., & Beier, C. M. (2022) · International Journal of Remote Sensing · doi:10.1080/01431161.2022.2155086 · Cited by 14
Chen, J., Gale, R. P., Feng, Y., Hu, Y., Qi, S., Liu, X., Zhu, H., Gong, X., Zhang, W., Liu, H., et al. (2023) · Leukemia · doi:10.1038/s41375-023-01973-2 · Cited by 12
Prognostic indices for early mortality in ischaemic stroke - meta-analysis
Mattishent, K., Kwok, C. S., Mahtani, A., Pelpola, K., Myint, P. K., & Loke, Y. K. (2015) · Acta Neurologica Scandinavica · doi:10.1111/ane.12421 · Cited by 12
Vanasse, A., Courteau, J., Couillard, S., Beauchesne, M.-F., & Larivée, P. (2017) · COPD Journal of Chronic Obstructive Pulmonary Disease · doi:10.1080/15412555.2017.1343814 · Cited by 12
Zajic, P., Bauer, P., Rhodes, A., Moreno, R. P., Fellinger, T., Metnitz, B., Posch, M., & Metnitz, P. (2019) · Scientific Reports · doi:10.1038/s41598-019-48947-y · Cited by 12
Lim, M. J. R., Neo, A. Y. Y., Singh, G. D., Liew, T. Y. S., Rajendram, M. F., Tan, M. W. X., Ragupathi, T., Lwin, S., Chou, N., Sharma, V. K., et al. (2020) · Journal of Stroke and Cerebrovascular Diseases · doi:10.1016/j.jstrokecerebrovasdis.2020.105360 · Cited by 12
Logan, J. M., Hopkins, A. M., Martini, C., Sorvina, A., Tewari, P., Prabhakaran, S., Huzzell, C., Johnson, I. R. D., Hickey, S. M., Ung, B. S. ‐., et al. (2023) · Cancers · doi:10.3390/cancers15123215 · Cited by 12
Allassonnière‐Tang, M., & Her, O. (2019) · Folia Linguistica · doi:10.1515/flin-2019-2013 · Cited by 11
Pilotto, A., Veronese, N., Polidori, M. C., Strandberg, T. E., Topinková, E., Cruz-Jentoft, A. J., Custodero, C., Maggi, S., & on behalf of the EUROSAF Study Investigators (2022) · Annals of Medicine · doi:10.1080/07853890.2022.2117407 · Cited by 11
Barbagallo, M., Smith, L., Koyanagi, A., Dominguez, L. J., Fazzari, A., Marrone, E., Maggi, S., Ruotolo, G., Castagna, A., & Veronese, N. (2023) · Maturitas · doi:10.1016/j.maturitas.2022.12.007 · Cited by 11
Missing single nucleotide polymorphisms in Genetic Risk Scores: A simulation study
Chagnon, M., O’Loughlin, J. L., Engert, J. C., Karp, I., & Sylvestre, M. (2018) · PLoS ONE · doi:10.1371/journal.pone.0200630 · Cited by 11
A donor risk index for graft loss in pediatric living donor kidney transplantation
Wasik, H. L., Pruette, C. S., Ruebner, R. L., McAdams‐DeMarco, M., Zhou, S., Neu, A. M., Segev, D. L., & Massie, A. B. (2019) · American Journal of Transplantation · doi:10.1111/ajt.15360 · Cited by 11
Foote, C., Woodward, M., & Jardine, M. (2017) · American Journal of Kidney Diseases · doi:10.1053/j.ajkd.2017.02.005 · Cited by 11
de Winkel, J., Maas, C. C. H. M., Roozenbeek, B., Klaveren, D. V., & Lingsma, H. F. (2024) · BMC Medical Research Methodology · doi:10.1186/s12874-024-02280-9 · Cited by 10
McNeill, J. N., Lee, D. H., Hwang, S., Courchesne, P. L., Yao, C., Huan, T., Joehanes, R., O’Connor, G. T., Ho, J. E., & Levy, D. A. (2022) · PLoS ONE · doi:10.1371/journal.pone.0266523 · Cited by 9
Tarkhan, A., & Simon, N. (2022) · Biostatistics · doi:10.1093/biostatistics/kxac039 · Cited by 10
Ghosh, D., & Saha, S. (2023) · Modeling Earth Systems and Environment · doi:10.1007/s40808-023-01740-3 · Cited by 10
Siddique, S. M., Evans, C. V., Harhay, M. O., Johnson, E. S., Aysola, J., Weissman, G. E., Mull, N. K., Flores, E. J., Schmidt, H., Tipton, K. N., et al. (2023) · Health Equity · doi:10.1089/heq.2023.0035 · Cited by 10
Parsons, E. I., Gitzen, R. A., Pynne, J. T., Conner, L. M., Castleberry, S. B., Duncan, S. I., Austin, J. D., & McCleery, R. A. (2021) · Journal of Mammalogy · doi:10.1093/jmammal/gyab144 · Cited by 10
Stability of Asthma Symptom Control in a Longitudinal Study of Mild-Moderate Asthmatics
JOHNSON, K., FitzGerald, J. M., Tavakoli, H., Chen, W., & Sadatsafavi, M. (2017) · The Journal of Allergy and Clinical Immunology In Practice · doi:10.1016/j.jaip.2017.04.006 · Cited by 10
Duong, D. (2015) · Digital Access to Scholarship at Harvard (DASH) (Harvard University) · Cited by 10
Crocker, H., Cromwell, D. A., Modha, S. H., Gray, A. M., Graham, C. F., Thana, L., Fitzpatrick, R. M., Vincent, C. A., Hogan, H., & Peters, M. (2025) · BMJ Quality & Safety · doi:10.1136/bmjqs-2024-017213 · Cited by 9
Worku, D., Gowane, G. R., & Verma, A. (2023) · PLoS ONE · doi:10.1371/journal.pone.0277156 · Cited by 9
Park, H. S., Kwon, H., & McElrath, T. F. (2018) · Human Reproduction · doi:10.1093/humrep/dey228 · Cited by 9
Kagan, I., Ziv, A., Rubin, C., Murad, H., Valinsky, L. J., Asman, O., Tabak, N., & Wilf‐Miron, R. (2021) · Journal of Nursing Scholarship · doi:10.1111/jnu.12759 · Cited by 9
Machine learning based DNA melt curve profiling enables automated novel genotype detection
Boussina, A. E., Langouche, L., Obirieze, A. C., Sinha, M., Mack, H., Leineweber, W. D., Aralar, A., Pride, D. T., Coleman, T. P., & Fraley, S. I. (2024) · BMC Bioinformatics · doi:10.1186/s12859-024-05747-0 · Cited by 8
Asiimwe, S. B., Vittinghoff, E., & Whooley, M. A. (2020) · Journal of Emergency Medicine · doi:10.1016/j.jemermed.2019.11.020 · Cited by 8
Buick, J. E., Austin, P. C., Cheskes, S., Ko, D. T., & Atzema, C. L. (2023) · Academic Emergency Medicine · doi:10.1111/acem.14756 · Cited by 9
Self-citationWang, C., Fu, S., Hung, C., Yang, R., Lin, J., Chen, H., Hsiao, F., & Shen, L. (2020) · International Journal of Health Policy and Management · doi:10.34172/ijhpm.2020.169 · Cited by 8
Massaro, P. A., Kanji, A., Atkinson, P., Pawsey, R., & Whelan, T. (2017) · Canadian Urological Association Journal · doi:10.5489/cuaj.4143 · Cited by 8
Cowling, T. E., Cromwell, D. A., Sharples, L. D., & van der Meulen, J. (2020) · Journal of Clinical Epidemiology · doi:10.1016/j.jclinepi.2020.08.001 · Cited by 7
Zhong, X., Lin, J., Li, L., Barrett, A. M., Poeran, J., & Mazumdar, M. (2020) · Health Services Research · doi:10.1111/1475-6773.13565 · Cited by 8
Bladder Pain Sensitivity Is a Potential Risk Factor for Irritable Bowel Syndrome
Shlobin, A. E., Tu, F. F., Sain, C. R., Kmiecik, M. J., Kantarovich, D., Singh, L., Wang, C. E., & Hellman, K. M. (2023) · Digestive Diseases and Sciences · doi:10.1007/s10620-023-07868-7 · Cited by 8
Lallah, P. N., Laite, C., Bangash, A. B., Chooah, O., & Jiang, C. (2023) · Reviews in Cardiovascular Medicine · doi:10.31083/j.rcm2408215 · Cited by 9
Schuh, H. B., Hooli, S., Ahmed, S., King, C., Roy, A. D., Lufesi, N., Islam, M. A., Mvalo, T., Chowdhury, N. H., Ginsburg, A. S., et al. (2023) · Frontiers in Pediatrics · doi:10.3389/fped.2023.1233532 · Cited by 7
Seoni, S., Beeckman, S., Li, Y., Aasmul, S., Morbiducci, U., Baets, R., Boutouyrie, P., Molinari, F., Madhu, N., & Segers, P. (2022) · Frontiers in Physiology · doi:10.3389/fphys.2021.775052 · Cited by 7
Goodman, D. M., Casale, M. T., Rychlik, K. L., Carroll, M. S., Auger, K. A., Smith, T. L., CARTLAND, J. D. C., & Davis, M. M. (2022) · JAMA Network Open · doi:10.1001/jamanetworkopen.2022.41513 · Cited by 7
Rojas, N. K., Stavola, B. L. D., Norris, T., Cortina‐Borja, M., Nugawela, M. D., Hargreaves, D. S., Dalrymple, E., McOwat, K., Simmons, R., Stephenson, T. J., et al. (2024) · BMC Medical Research Methodology · doi:10.1186/s12874-024-02219-0 · Cited by 10
Ford, N. D., Bichha, R. P., Parajuli, K. R., Paudyal, N., Joshi, N., Whitehead, R. D., Chitekwe, S., Mei, Z., Flores‐Ayala, R. C., Adhikari, D. P., et al. (2019) · Journal of Nutrition · doi:10.1093/jn/nxz307 · Cited by 7
Grit as a Predictor of Academic Success for First-Time Undergraduate Students
Broghammer, S. M. (2017) · Scholarship & Creative Works - Digital UNC a service of University Libraries (University of Northern Colorado) · Cited by 7
de Winkel, J., Roozenbeek, B., Dijkland, S. A., Dammers, R., van Doormaal, P., van der Jagt, M., Klaveren, D. V., Dippel, D. W. J., & Lingsma, H. F. (2024) · BMC Neurology · doi:10.1186/s12883-024-03546-x · Cited by 6
Predictors of Response to Cognitive Behavioral Therapy in Patients With Tinnitus
Mueller, L. E., Kallogjeri, D., Frumkin, M. R., Dizdar, K., Shin, J., Rodebaugh, T. L., & Piccirillo, J. F. (2024) · JAMA Otolaryngology–Head & Neck Surgery · doi:10.1001/jamaoto.2024.2264 · Cited by 6
Verras, G., Hamady, Z. Z. R., Collins, A. R., & Tapper, W. (2025) · Cancers · doi:10.3390/cancers17020241 · Cited by 6
Wang, X., Kerrigan, K. C., Puri, S., Shen, J., Akerley, W., & Haaland, B. A. (2022) · Cancers · doi:10.3390/cancers14030690 · Cited by 6
Purvis, T. E., Neuman, B. J., Riley, L. H., & Skolasky, R. L. (2017) · Spine · doi:10.1097/brs.0000000000002522 · Cited by 6
Seo, S. M., & Jeong, I. S. (2020) · Journal of Korean Academy of Nursing · doi:10.4040/jkan.20137 · Cited by 6
Life course epidemiology: Modeling educational attainment with administrative data
Roos, L. L., & Wall‐Wieler, E. (2017) · PLoS ONE · doi:10.1371/journal.pone.0188976 · Cited by 6
Prognostic accuracy of emergency surgery score: a systematic review
Toloui, A., Kiah, M., Zarrin, A., Azizi, Y., & Yousefifard, M. (2023) · European Journal of Trauma and Emergency Surgery · doi:10.1007/s00068-023-02396-5 · Cited by 5
Sevinyan, L., Asaalaarchchi, H., Tailor, A., Williams, P., Evans, M., Hodnett, D., Arakkal, D., Prabhu, P., Flint, M., & Madhuri, T. K. (2024) · Cancers · doi:10.3390/cancers16132297 · Cited by 6
Komatsu, R., Singleton, M. D., Peperzak, K. A., Wu, J., Dinges, E. M., & Bollag, L. A. (2022) · JA Clinical Reports · doi:10.1186/s40981-022-00535-2 · Cited by 5
Weng, X., Shen, C., Scoy, L. J. V., Boltz, M. P., Joshi, M., & Wang, L. (2022) · Journal of Geriatric Oncology · doi:10.1016/j.jgo.2022.08.011 · Cited by 5
Luo, B., Lin, J., Ni, A., Cai, W., Yu, X., & Wang, M. (2022) · Frontiers in Oncology · doi:10.3389/fonc.2022.927028 · Cited by 5
Prevalence and Clinical Implications of Hemosiderin Deposits in Recent Small Subcortical Infarcts
Xu, Y., Chappell, F. M., Hernández, M. D. C. V., Arteaga, C., Clancy, Ú., García, D. J., Wiseman, S. J., Stringer, M. S., Thrippleton, M. J., Cheng, Y., et al. (2024) · Neurology · doi:10.1212/wnl.0000000000209973 · Cited by 5
Systematic Reviews of Prediction Models
Collins, P. G. S., Moons, K. G. M., Debray, T. P. A., Altman, D. G., & Riley, R. D. (2022) · Wiley eBooks · doi:10.1002/9781119099369.ch18 · Cited by 6
Nigatu, Y. T., & Wang, J. (2019) · Journal of Anxiety Disorders · doi:10.1016/j.janxdis.2019.03.004 · Cited by 5
BigSurvSGD: Big Survival Data Analysis via Stochastic Gradient DescentPreprint
Tarkhan, A., & Simon, N. (2020) · arXiv (Cornell University) · doi:10.48550/arxiv.2003.00116 · Cited by 5
Factors associated with COVID-19 infection in pregnant women: Focusing on maternal anxiety
Jeong, W., Kim, B., Hong, S. H., Cho, E., Kim, S. Y., & Moon, J. Y. (2024) · PLoS ONE · doi:10.1371/journal.pone.0312300 · Cited by 3
Parental influence on youth cannabis use: The interplay between disapproval and warmth
Young, B. R., Wheeler, L. A., & Dai, H. D. (2025) · Addictive Behaviors Reports · doi:10.1016/j.abrep.2025.100621 · Cited by 6
de Jong, V. M. T., Hoogland, J., Moons, K. G. M., Riley, R. D., Nguyen, T., & Debray, T. P. A. (2023) · Statistics in Medicine · doi:10.1002/sim.9817 · Cited by 5
Hosar, R., Berntsen, G., & Steinsbekk, A. (2024) · BMC Health Services Research · doi:10.1186/s12913-024-11715-4 · Cited by 4
Development and Validation of a Prognostic Tool for Direct Enteral Tube Insertion After Acute Stroke
Joundi, R. A., Saposnik, G., Martino, R., Fang, J., & Kapral, M. K. (2020) · Stroke · doi:10.1161/strokeaha.120.028949 · Cited by 4
Stewart, T. C., Luong, K., Alharfi, I. M., McKelvie, B., & Fraser, D. D. (2020) · Injury · doi:10.1016/j.injury.2020.04.047 · Cited by 4
Digital Fleet Management: A Scalable Cloud Framework based on Data-driven Prediction Models
Thomas, S. A., Dubey, A. K., Viassolo, D., & Zanette, M. (2020) · Annual Conference of the PHM Society · doi:10.36001/phmconf.2020.v12i1.1273 · Cited by 4
Russo, G. T., Giandalia, A., Ceriello, A., Bartolo, P. D., Cianni, G. D., Fioretto, P., Giorda, C. B., Manicardi, V., Pontremoli, R., Viazzi, F. C., et al. (2022) · Diabetes Research and Clinical Practice · doi:10.1016/j.diabres.2022.110092 · Cited by 4
Alhassan, Z., Budgen, D., Alshammari, R., & Moubayed, N. A. (2020) · JMIR Medical Informatics · doi:10.2196/18963 · Cited by 4
Toprak, K., Kaplangöray, M., Memioğlu, T., & İnanır, M. (2023) · Coronary Artery Disease · doi:10.1097/mca.0000000000001238 · Cited by 4
Byun, J., Han, S., Liu, Y., & Park, C. (2024) · Therapeutic Advances in Medical Oncology · doi:10.1177/17588359241264721 · Cited by 3
John, S., Joseph, K. S., Fahey, J., Liu, S., Lisonkova, S., & Kramer, M. S. (2025) · Paediatric and Perinatal Epidemiology · doi:10.1111/ppe.70065 · Cited by 3
Biswas, B. N., Husain, M., & Rahman, M. S. (2019) · Journal of Statistical Research · doi:10.47302/jsr.2019530104 · Cited by 3
Sungkaro, K., Taweesomboonyat, C., & Kaewborisutsakul, A. (2022) · Journal of Neurosciences in Rural Practice · doi:10.25259/jnrp-2022-2-31 · Cited by 3
Incorporating Scoring Risk Models for Care Planning of the Elderly with Chronic Kidney Disease
Santos, J., & Fonseca, I. M. (2017) · Current Gerontology and Geriatrics Research · doi:10.1155/2017/8067094 · Cited by 3
Wong, C., Chen, T.-T., Chang, W.-P., Wong, H. S.-C., Wu, M., Adikusuma, W., Lin, Y., & Chang, W. (2020) · Cancers · doi:10.3390/cancers12061654 · Cited by 3
Li, N., Wolter, B., Yang, L., & Siyanova‐Chanturia, A. (2025) · Humanities and Social Sciences Communications · doi:10.1057/s41599-025-05045-x · Cited by 3
Continuous predicted risks should be retained when deploying clinical prediction models
Blythe, R. D., Parsons, R., Ong, M. E. H., & Barnett, A. G. (2025) · Journal of Clinical Epidemiology · doi:10.1016/j.jclinepi.2025.112009 · Cited by 2
Gungor, A. B., Pennathur, P., Guran, H. S., Chu, W., & Roshanov, P. S. (2025) · BMC Anesthesiology · doi:10.1186/s12871-025-03350-1 · Cited by 2
Trends and factors associated with initiation of HIV treatment among PLHIV in Jamaica, 2015–2019
Cushnie, A., Reintjes, R., Figueroa, J. P., & Artama, M. (2023) · PLoS ONE · doi:10.1371/journal.pone.0265468 · Cited by 2
Big data study using health insurance claims to predict multidisciplinary low vision service uptake
Stolwijk, M. L., van Nispen, R. M. A., van der Pas, S., & van Rens, G. H. M. B. (2024) · Optometry and Vision Science · doi:10.1097/opx.0000000000002134 · Cited by 2
Freitas, A., Santos, J. V., Lobo, M. F., & Santos, C. (2017) · Advances in intelligent systems and computing · doi:10.1007/978-3-319-56541-5_33 · Cited by 2
Feng, S., van Walraven, C., Lalu, M. M., Moloo, H., Musselman, R., & McIsaac, D. I. (2020) · BMJ Open · doi:10.1136/bmjopen-2019-034060 · Cited by 2
Cardiovascular Diseases Following Breast Cancer
Abdel-Qadir, H. M., Thavendiranathan, P., Austin, P. C., Lee, D. S., Amir, E., Fung, K., & Anderson, G. M. (2023) · American Journal of Clinical Oncology · doi:10.1097/coc.0000000000000978 · Cited by 2
Self-citationThe reliability and validity of lung cancer and melanoma clinical quality survival measures
Pendl-Robinson, E. L., Calkins, K. L., Simon, S. E., Barrett, K. A., & Poznyak, D. (2023) · Health Services Research · doi:10.1111/1475-6773.14164 · Cited by 2
Parsons, E. I. (2019) · Cited by 2
Metadata
- Authors
- Austin, P. C., & Steyerberg, E. W.
- Affiliations
- Institute for Clinical Evaluative Sciences (CA)
- Erasmus MC (NL)
- Corresponding author
- Austin, Peter C
- Venue
- BMC Medical Research Methodology
- Published
- 2012-06-20
- Volume
- 12
- Issue
- 1
- Pages
- 82-82
- ISSN
- 1471-2288 (ISSN-L)
- PMC
- PMC3528632
- OpenAlex
- W2112200626
- Cited by
- 270
- References
- 23
- Citations by year
- 2026: 17 · 2025: 16 · 2024: 25 · 2023: 29 · 2022: 26 · 2021: 17 · 2020: 30 · 2019: 20 · 2018: 19 · 2017: 28 · 2016: 17 · 2015: 12 · 2014: 7 · 2013: 7
- FWCI
- 7.93
- Type
- journal article
- Language
- en
- Open access
- gold
- doi.org
- Licence
- Locations
- BMC Medical Research Methodology (publishedVersion, cc-by)
- Europe PMC (PubMed Central) (publishedVersion, cc-by)
- PubMed Central (publishedVersion, cc-by)
- PubMed (publishedVersion)
- EUR Research Repository (Erasmus University Rotterdam) (acceptedVersion, other-oa)
- TSpace (University of Toronto) (submittedVersion)
- EUR Research Repository (Erasmus University Rotterdam) (submittedVersion, other-oa)
- RePub (Erasmus University Rotterdam) (submittedVersion, other-oa)
- DOAJ (DOAJ: Directory of Open Access Journals) (submittedVersion)
- Funders
- Heart and Stroke Foundation of Canada
- Institute for Clinical Evaluative Sciences
- Ontario Ministry of Health and Long-Term Care
- Canadian Institutes of Health Research (86508, MOP86508)
- Topics
- Physical Sciences › Mathematics › Statistics and Probability › Statistical Methods in Epidemiology
- Social Sciences › Decision Sciences › Statistics, Probability and Uncertainty › Meta-analysis and systematic reviews
- Physical Sciences › Computer Science › Artificial Intelligence › Imbalanced Data Classification Techniques
- Keywords
- area under the ROC curve, logistic regression, odds ratio, heteroscedasticity, prediction accuracy, discriminatory power, non-normal distributions, gamma distribution, lognormal distribution, uniform distribution
- MeSH terms
- Age Factors, Analysis of Variance, Data Interpretation, Statistical, Humans, Monte Carlo Method, Myocardial Infarction, ROC Curve, Logistic Models, Odds Ratio
About these checks
Registry, retraction, Cites and statistics results are computed, not judged, with one exception: a printed reference that no index lists is read once by a model before it counts as a citation error. Claims are extracted by a model and kept only when their quote appears verbatim in the text; each cited source is then checked, with a model’s help, for whether it says what the claim relies on. Those verdicts can be wrong — read the claim’s quote and the cited source before relying on one.
Statistics and arithmetic are recomputed, not judged.
Confidence bands are shown only for fields calibrated on our annotated test set. None is calibrated yet, so no band is shown.
What counts as a claim ›How we measure confidence ›How we check this ›
Are you an author, or do you see a problem with this page? Request a review
