

The DOI matches its Crossref record; 8 of the 8 references it cites were found in a registry or an index.
The standard error of measurement is a more appropriate measure of quality for postgraduate medical assessments than is reliability: an analysis of MRCP(UK) examinations
Open accessAbstract
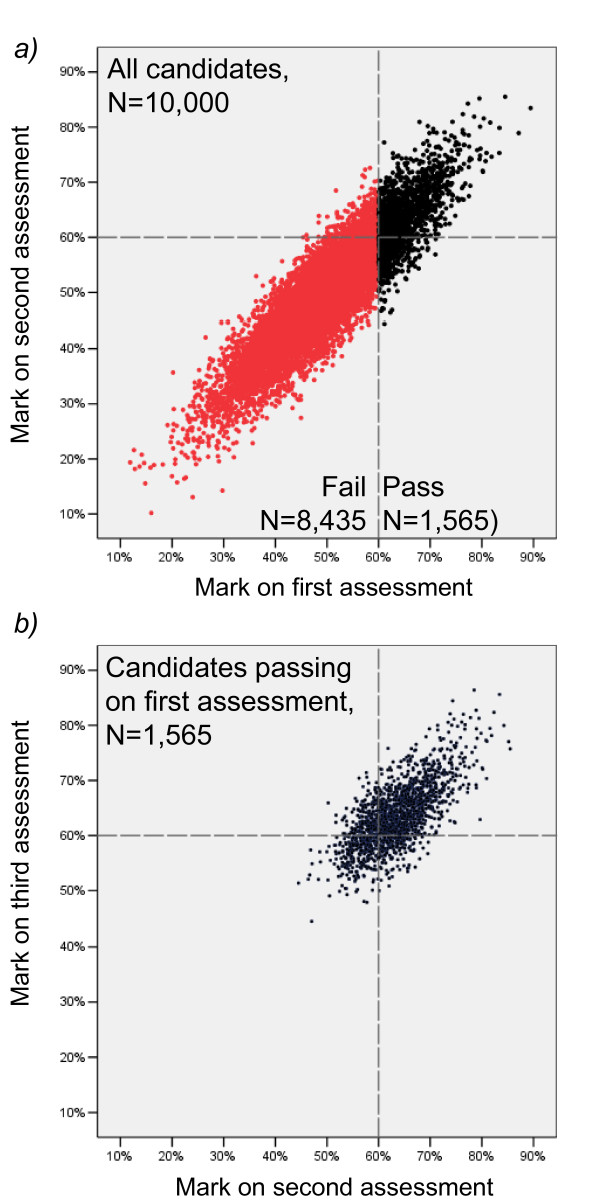
Background: Cronbach's alpha is widely used as the preferred index of reliability for medical postgraduate examinations. A value of 0.8-0.9 is seen by providers and regulators alike as an adequate demonstration of acceptable reliability for any assessment. Of the other statistical parameters, Standard Error of Measurement (SEM) is mainly seen as useful only in determining the accuracy of a pass mark. However the alpha coefficient depends both on SEM and on the ability range (standard deviation, SD) of candidates taking an exam. This study investigated the extent to which the necessarily narrower ability range in candidates taking the second of the three part MRCP(UK) diploma examinations, biases assessment of reliability and SEM. Methods: a) The interrelationships of standard deviation (SD), SEM and reliability were investigated in a Monte Carlo simulation of 10,000 candidates taking a postgraduate examination. b) Reliability and SEM were studied in the MRCP(UK) Part 1 and Part 2 Written Examinations from 2002 to 2008. c) Reliability and SEM were studied in eight Specialty Certificate Examinations introduced in 2008-9. Results: The Monte Carlo simulation showed, as expected, that restricting the range of an assessment only to those who had already passed it, dramatically reduced the reliability but did not affect the SEM of a simulated assessment. The analysis of the MRCP(UK) Part 1 and Part 2 written examinations showed that the MRCP(UK) Part 2 written examination had a lower reliability than the Part 1 examination, but, despite that lower reliability, the Part 2 examination also had a smaller SEM (indicating a more accurate assessment). The Specialty Certificate Examinations had small Ns, and as a result, wide variability in their reliabilities, but SEMs were comparable with MRCP(UK) Part 2. Conclusions: An emphasis upon assessing the quality of assessments primarily in terms of reliability alone can produce a paradoxical and distorted picture, particularly in the situation where a narrower range of candidate ability is an inevitable consequence of being able to take a second part examination only after passing the first part examination. Reliability also shows problems when numbers of candidates in examinations are low and sampling error affects the range of candidate ability. SEM is not subject to such problems; it is therefore a better measure of the quality of an assessment and is recommended for routine use.
Overview
The claims and statistics of this paper haven’t been checked yet.
Run the check — free, no account needed. It reads the open-access text and checks the sources it cites.
Integrity signals
Registry
Cites
Statistics
Figures
Verification
Claims the paper makes
The claims and statistics of this paper haven’t been checked yet.
Run the check — free, no account needed. It reads the open-access text and checks the sources it cites.
Self-check
Percentages, sums and reported differences re-computed from the paper’s own numbers.
The self-check needs the paper’s full text.
Citations
Cites
Coefficient Alpha and the Internal Structure of Tests
Cronbach, L. J. (1951) · Psychometrika · doi:10.1007/bf02310555 · Cited by 43,931
Measurement Theory for the Behavioral Sciences.
Elliott, G. C., Ghiselli, E. Ε., Campbell, J. P., & Zedeck, S. (1982) · Contemporary Sociology A Journal of Reviews · doi:10.2307/2067145 · Cited by 1,011
The continuing misinterpretation of the standard error of measurement.
Dudek, F. J. (1979) · Psychological Bulletin · doi:10.1037/0033-2909.86.2.335 · Cited by 148
Weiss, D. J., & Davison, M. L. (1981) · Annual Review of Psychology · doi:10.1146/annurev.ps.32.020181.003213 · Cited by 83
Hutchinson, L., Aitken, P., & Hayes, T. M. (2002) · Medical Education · doi:10.1046/j.1365-2923.2002.01120.x · Cited by 83
Developing and maintaining an assessment system: A PMETB guide to good practice
Oliver, C. (2007) · Cited by 49
Reliability of the MRCP(UK) Part I Examination, 1984–2001
McManus, I. C., Mooney‐Somers, J., Dacre, J. E., & Vale, J. A. (2003) · Medical Education · doi:10.1046/j.1365-2923.2003.01568.x · Cited by 16
Self-citationThe seven deadly sins of assessment
Tweed, M., & WILKINSON, T. J. (2009) · The Clinical Teacher · doi:10.1111/j.1743-498x.2009.00293.x · Cited by 2
Research works printed but not linked: 3
- Postgraduate Medical Education and Training Board: Principles for an assessment system for postgraduate training: A working paper from the Postgraduate Medical Education Training Board. 2004, London: PMETB
- Postgraduate Medical Education and Training Board: Standards for curricula and assessment systems. 2008, London: PMETB
- Postgraduate Medical Education and Training Board: Reliability issues in the assessment of small cohorts (Guidance 09/1). 2009, London: PMETB, [http://www.pmetb.org.uk]
Cited by
Sorted by citations
Items 101–114 of 114
Rasdi, H. F. M., & Senin, N. S. M. (2022) · Malaysian Journal of Medicine and Health Sciences · doi:10.47836/mjmhs.18.s9.9
De Novo Reliability Synthesis in Assessment for Continuing Quality Improvement
Hassan, S. (2024) · Advances in Science, Technology & Innovation/Advances in science, technology & innovation · doi:10.1007/978-3-031-51244-5_14
Rei, K. M., Dupper, M., Han, V., & Ettarh, R. (2024) · Cureus · doi:10.7759/cureus.66530
Duruöz, M. T., Gezer, H. H., Epstein, J., Soudant, M., & Guillemin, F. (2025) · Rheumatology International · doi:10.1007/s00296-025-05914-3
Dietvorst, M., van de Kerkhof, T. M., Janssen, R. P. A., van den Berg, L. E., & van der Steen, M. C. (2021) · Figshare · doi:10.6084/m9.figshare.16755859
Rashwan, N. I., Aref, S. R., Nayel, O. A., & Rizk, M. H. (2024) · Figshare · doi:10.6084/m9.figshare.26684097
Laven, I. E. W. G., Schröder, F. F., de Graaff, F., Rompen, J. C., Hoogeslag, R. A. G., & van Houten, A. H. (2022) · Figshare · doi:10.6084/m9.figshare.19785824
Hocaoğlu, M., Murtagh, F. E. M., Walshe, C., Chambers, R. L., Maddocks, M., Sleeman, K., Oluyase, A. O., Dunleavy, L., Bradshaw, A., Bajwah, S., et al. (2023) · Figshare · doi:10.6084/m9.figshare.22619110
Ramdas, N., Schellack, N., Uys, C. S., Godman, B., Campbell, S., & Meyer, J. C. (2026) · Antibiotics · doi:10.3390/antibiotics15010107
Bhardwaj, T., Chambers, R. L., Watson, H., Rajvanshi, A., Sharma, R., Higginson, I. J., & Hocaoğlu, M. (2026) · PLOS Global Public Health · doi:10.1371/journal.pgph.0006189
Alshaikh, F. J. (2026) · Physiotherapy Quarterly · doi:10.5114/pq/213537
A comparative study of reading sections of high-stakes teacher-made tests in Portugal
Pato, M. P. M. (2026) · Cadernos de Linguagem e Sociedade · doi:10.26512/les.v26i2.59640
Marcos-Rivero, B., Yanci, J., Granados, C., & Ascondo, J. (2026) · Measurement in Physical Education and Exercise Science · doi:10.1080/1091367x.2026.2720143
Developing an evidence base for the Professional and Linguistic Assessments Board (PLAB) Test
Illing, J., McLachlan, J. C., Rothwell, C., & Archer, J. C. (2014) · Newcastle University ePrints (Newcastle Univesity) · doi:10.25405/ncl.34268439
Metadata
- Authors
- Tighe, J., McManus, I., Dewhurst, N. G., Chis, L., & Mucklow, J.
- Affiliations
- University College London (GB)
- Corresponding author
- McManus, IC
- ORCID
- McManus, IC
- Venue
- BMC Medical Education
- Published
- 2010-06-02
- Volume
- 10
- Issue
- 1
- Pages
- 40-40
- ISSN
- 1472-6920 (ISSN-L)
- PMC
- PMC2893515
- OpenAlex
- W2110536261
- Cited by
- 113
- References
- 8
- Citations by year
- 2026: 7 · 2025: 15 · 2024: 13 · 2023: 6 · 2022: 9 · 2021: 8 · 2020: 6 · 2019: 7 · 2018: 6 · 2017: 7 · 2016: 3 · 2015: 10 · 2014: 1 · 2013: 5 · 2012: 6
- FWCI
- 4.77
- Type
- journal article
- Language
- en
- Open access
- gold
- doi.org
- Licence
- Locations
- BMC Medical Education (publishedVersion, cc-by)
- PubMed Central (publishedVersion, cc-by)
- PubMed (publishedVersion)
- DOAJ (DOAJ: Directory of Open Access Journals) (submittedVersion, cc-by-sa)
- UCL Discovery (University College London) (submittedVersion)
- Topics
- Social Sciences › Education › Innovations in Medical Education
- Social Sciences › Decision Sciences › Management Science and Operations Research › Psychometric Methodologies and Testing
- Social Sciences › Education › Medical Education and Admissions
- Keywords
- standard error of measurement, test reliability, Cronbach's alpha, postgraduate medical examination, range restriction, assessment quality, Monte Carlo simulation
- MeSH terms
- Education, Medical, Graduate, Educational Measurement, Humans, Monte Carlo Method, Reproducibility of Results, Models, Statistical
About these checks
Registry, retraction, Cites and statistics results are computed, not judged, with one exception: a printed reference that no index lists is read once by a model before it counts as a citation error. Claims are extracted by a model and kept only when their quote appears verbatim in the text; each cited source is then checked, with a model’s help, for whether it says what the claim relies on. Those verdicts can be wrong — read the claim’s quote and the cited source before relying on one.
Statistics and arithmetic are recomputed, not judged.
Confidence bands are shown only for fields calibrated on our annotated test set. None is calibrated yet, so no band is shown.
What counts as a claim ›How we measure confidence ›How we check this ›
Are you an author, or do you see a problem with this page? Request a review
