

The DOI matches its Crossref record; 104 of the 104 references it cites were found in a registry or an index.
A comparison of temporal trends in United States autism prevalence to trends in suspected environmental factors
Open accessAbstract
BACKGROUND: The prevalence of diagnosed autism has increased rapidly over the last several decades among U.S. children. Environmental factors are thought to be driving this increase and a list of the top ten suspected environmental toxins was published recently. METHODS: Temporal trends in autism for birth years 1970-2005 were derived from a combination of data from the California Department of Developmental Services (CDDS) and the United States Individuals with Disabilities Education Act (IDEA). Temporal trends in suspected toxins were derived from data compiled during an extensive literature survey. Toxin and autism trends were compared by visual inspection and computed correlation coefficients. Using IDEA data, autism prevalence vs. birth year trends were calculated independently from snapshots of data from the most recent annual report, and by tracking prevalence at a constant age over many years of reports. The ratio of the snapshot:tracking trend slopes was used to estimate the "real" fraction of the increase in autism. RESULTS: The CDDS and IDEA data sets are qualitatively consistent in suggesting a strong increase in autism prevalence over recent decades. The quantitative comparison of IDEA snapshot and constant-age tracking trend slopes suggests that ~75-80% of the tracked increase in autism since 1988 is due to an actual increase in the disorder rather than to changing diagnostic criteria. Most of the suspected environmental toxins examined have flat or decreasing temporal trends that correlate poorly to the rise in autism. Some, including lead, organochlorine pesticides and vehicular emissions, have strongly decreasing trends. Among the suspected toxins surveyed, polybrominated diphenyl ethers, aluminum adjuvants, and the herbicide glyphosate have increasing trends that correlate positively to the rise in autism. CONCLUSIONS: Diagnosed autism prevalence has risen dramatically in the U.S over the last several decades and continued to trend upward as of birth year 2005. The increase is mainly real and has occurred mostly since the late 1980s. In contrast, children's exposure to most of the top ten toxic compounds has remained flat or decreased over this same time frame. Environmental factors with increasing temporal trends can help suggest hypotheses for drivers of autism that merit further investigation.
Overview
The claims and statistics of this paper haven’t been checked yet.
Run the check — free, no account needed. It reads the open-access text and checks the sources it cites.
Integrity signals
Registry
Cites
Statistics
Figures
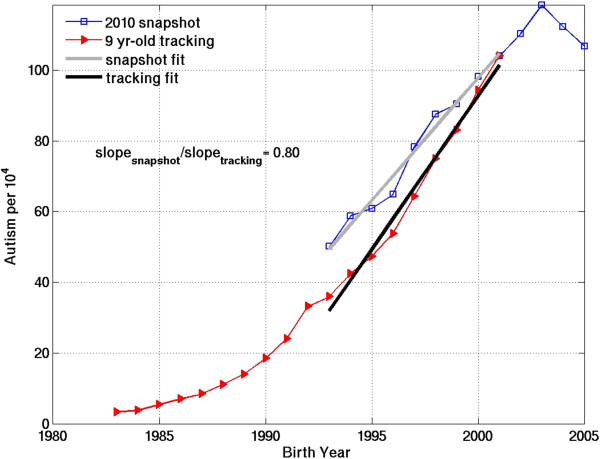
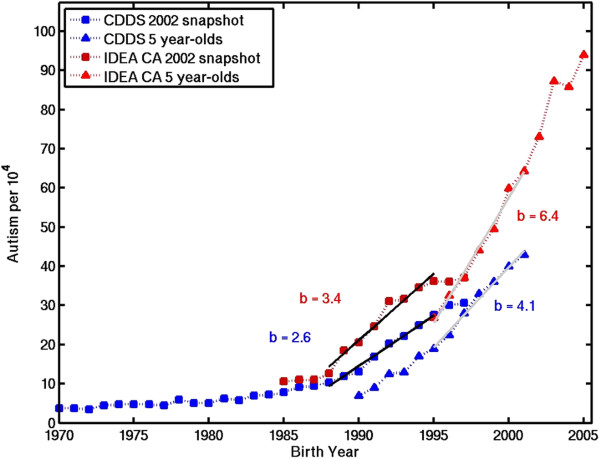
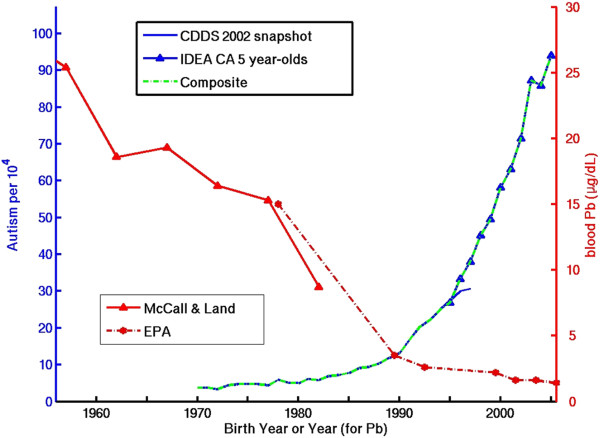
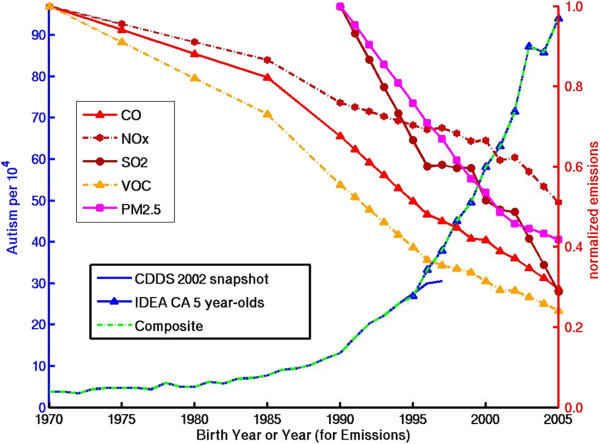
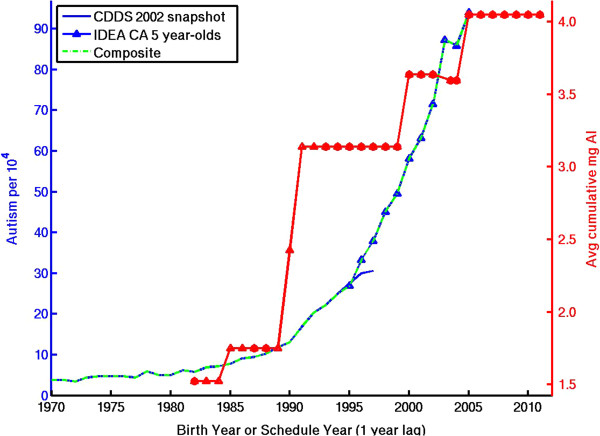
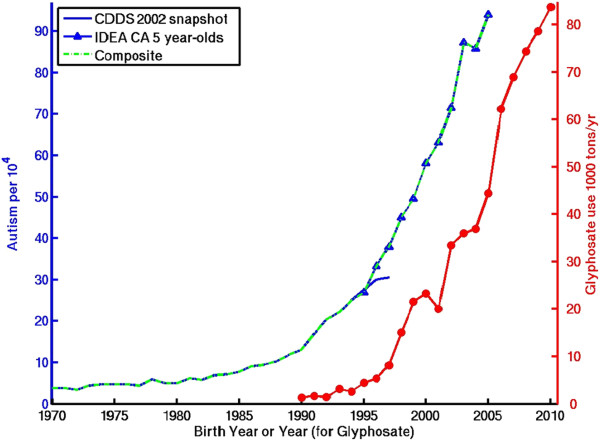
Verification
Claims the paper makes
The claims and statistics of this paper haven’t been checked yet.
Run the check — free, no account needed. It reads the open-access text and checks the sources it cites.
Claims other papers make about this one
Each is checked against this paper’s own text: does it say what the citing paper says it does?
The source backs part of the claim, not all of it — or backs it for a different population, condition or comparison.
In the citing paper
“To date, there is weak or conflicting evidence for the hypothesis that geographic variation or time trends in prevalence may reflect differences in exposure to environmental risk factors (Nevison, 2014) or increased patterns of migration (Keen et al., 2010).”
From Global prevalence of autism: A systematic review update (2022) · cites this paper as Nevison, 2014
Experimental — accuracy not yet measuredIn the citing paper
“Further, ASD risk associated with environmental exposures has been stable for air pollutants and pesticides, with lifestyle risk factors such as smoking and alcohol consumption and other potential hazards related to nutrition and medication in decline [264].”
From The contribution of environmental exposure to the etiology of autism spectrum disorder (2019) · cites this paper as [264]
In the citing paper
“Further, ASD risk associated with environmental exposures has been stable for air pollutants and pesticides, with lifestyle risk factors such as smoking and alcohol consumption and other potential hazards related to nutrition and medication in decline [264].”
From The contribution of environmental exposure to the etiology of autism spectrum disorder (2019) · cites this paper as [264]
Self-check
Percentages, sums and reported differences re-computed from the paper’s own numbers.
The self-check needs the paper’s full text.
Citations
Cites
1 retracted
Hepatitis B vaccination of male neonates and autism diagnosis, NHIS 1997–2002.
Gallagher, C. M., & Goodman, M. S. (2010) · Journal of Toxicology and Environmental Health, Part A · doi:10.1080/15287394.2010.519317 · Cited by 72
Retracted(1943) · The Nervous child · Cited by 8,870
Bulletin of the World Health Organization
van der Sande, M. A. B., Walraven, G. E. L., Milligan, P. J., BANYA, W. A. S., CEESAY, S. M., Nyan, O. A., & McAdam, K. P. W. J. (2001) · Bulletin of the World Health Organization · Cited by 7,097
Metabolic Endotoxemia Initiates Obesity and Insulin Resistance
Cani, P. D., Amar, J., Iglesias, M. A., Poggi, M., Knauf, C., Bastelica, D., Neyrinck, A. M., Fava, F., Tuohy, K. M., Chabo, C., et al. (2007) · Diabetes · doi:10.2337/db06-1491 · Cited by 6,638
Baio, J., Wiggins, L., Christensen, D. L., Maenner, M. J., Daniels, J., Warren, Z., Kurzius-Spencer, M., Zahorodny, W., Robinson, C., Rosenberg, et al. (2018) · MMWR. Surveillance Summaries · doi:10.15585/mmwr.ss6706a1 · Cited by 6,078
Autistic disturbances of affective contact.
Kanner, L. (1968) · PubMed · Cited by 2,282
Genetic Heritability and Shared Environmental Factors Among Twin Pairs With Autism
Hallmayer, J. (2011) · Archives of General Psychiatry · doi:10.1001/archgenpsychiatry.2011.76 · Cited by 1,970
Environmental Health Perspectives
Goehl, T. (2002) · Environmental Health Perspectives · doi:10.1289/ehp.110-1240809 · Cited by 1,944
Bulletin of the World Health Organization
Rennie, S., & Behets, F. (2006) · Bulletin of the World Health Organization · doi:10.2471/blt.00.00000 · Cited by 1,602
Naarden Braun, K. V., Lopez, M., White, T., et al. (2023) · Carolina Digital Repository (University of North Carolina at Chapel Hill) · doi:10.17615/y3kk-5x30 · Cited by 1,381
Research works printed but not linked: 7
- California Health and Human Services Agency, Dept. of Developmental Services: Autistic Spectrum Disorders. Changes in California Caseload. An Update: 1999 Through 2002. 2003, Sacramento, CA: California Health and Human Services Agency, Dept. of Developmental Services
- USEPA (United States Environmental Protection Agency): America’s Children and the Environment, Volume 13. 2013, 504-3
- Davis SC, Diegel SW, Boundy RG: Transportation Energy Data Book. 2010, Oak Ridge, TN: Center for Transportation Analysis, Oak Ridge National Laboratory, 29
- USEPA (United States Environmental Protection Agency): National Emissions Inventory (NEI) Air Pollutant Emissions Trends Data. 2012
- Institute of Medicine (IOM): Immunization Safety Review: Vaccines and Autism. 2004, Washington, D.C, 214-
- Osteen C, Livingston M: Pest Management Practices. In: Agricultural Resources and Environmental Indicators 2006 Edition, Chapter 4.3: In (Wiebe K, Gollehon N, Eds) EIB-16. 2006, Washington, DC: USDA
- Grube Donaldson D, Kiely T, Wu LA: Pesticides Industry Sales and Usage, 2006 and 2007 Market Estimates, US EPA. 2011
Cited by
Sorted by citations
Items 101–109 of 109
Underestimation of glyphosate intake by the methods currently used by regulatory agencies
Grau, D., Grau, N., Paroissin, C., Gascuel, Q., & Cristofaro, J. D. (2023) · Environmental Science and Pollution Research · doi:10.1007/s11356-023-29463-z
Chávez-Trujillo, R., Aguilar, R. M., & González–Mora, J. L. (2024) · Revista Iberoamericana de Automática e Informática Industrial RIAI · doi:10.4995/riai.2024.20484
Myers, S. M., & Challman, T. D. (2024) · Elsevier eBooks · doi:10.1016/b978-0-12-824060-1.00038-9
Abdallah, L. F., & Erçin, Ç. (2024) · Architecture Civil Engineering Environment · doi:10.2478/acee-2024-0025
Aiona, K., Crume, T., Reyes, N., Schmiege, S. J., Young, J., Holst, B., Durkin, M. S., & DiGuiseppi, C. G. (2025) · Journal of Autism and Developmental Disorders · doi:10.1007/s10803-025-06959-w
Grossman, A. (2026) · Frontiers in Neuroscience · doi:10.3389/fnins.2026.1729731
Sung, G. C. Y., & Yeung, S. L. A. (2026) · International Journal of Epidemiology · doi:10.1093/ije/dyag090
Huang, Y., Wang, Y., Zhang, H.-H., Zhou, M.-W., Su, Z., Cheung, T. C. C., Ungvari, G. S., Smith, R. D., Ng, C. H., & Xiang, Y. (2026) · Journal of Autism and Developmental Disorders · doi:10.1007/s10803-026-07438-6
Du, Q., 周群英, Yu, L., Ye, Y., & Wu, X. (2026) · Frontiers in Behavioral Neuroscience · doi:10.3389/fnbeh.2026.1944510
Metadata
- Authors
- Nevison, C. D.
- Affiliations
- Institute of Arctic and Alpine Research (US)
- Corresponding author
- Nevison, Cynthia D
- ORCID
- Nevison, Cynthia D
- Venue
- Environmental Health
- Published
- 2014-09-05
- Volume
- 13
- Issue
- 1
- Pages
- 73-73
- ISSN
- 1476-069X (ISSN-L)
- PMC
- PMC4177682
- OpenAlex
- W2105742120
- Cited by
- 111
- References
- 103
- Citations by year
- 2026: 7 · 2025: 3 · 2024: 5 · 2023: 5 · 2022: 10 · 2021: 12 · 2020: 11 · 2019: 5 · 2018: 9 · 2017: 21 · 2016: 9 · 2015: 14
- FWCI
- 8.11
- Type
- journal article
- Language
- en
- Open access
- gold
- doi.org
- Licence
- Locations
- Environmental Health (publishedVersion, cc-by)
- Europe PMC (PubMed Central) (publishedVersion, cc-by)
- PubMed Central (publishedVersion, cc-by)
- PubMed (publishedVersion)
- Topics
- Life Sciences › Neuroscience › Cognitive Neuroscience › Autism Spectrum Disorder Research
- Health Sciences › Medicine › Psychiatry and Mental health › Child Nutrition and Feeding Issues
- Life Sciences › Biochemistry, Genetics and Molecular Biology › Genetics › Genetics and Neurodevelopmental Disorders
- Keywords
- autism prevalence, temporal trends, environmental toxins, autism risk factors, lead exposure, organochlorine pesticides, vehicle emissions, polybrominated diphenyl ethers, alum adjuvant, glyphosate, diagnostic criteria revision, Individuals with Disabilities Education Act, children's environmental exposure
- MeSH terms
- Adolescent, Autistic Disorder, Child, Child, Preschool, Environmental Pollutants, Female, Humans, Male, United States, Prevalence
About these checks
Registry, retraction, Cites and statistics results are computed, not judged, with one exception: a printed reference that no index lists is read once by a model before it counts as a citation error. Claims are extracted by a model and kept only when their quote appears verbatim in the text; each cited source is then checked, with a model’s help, for whether it says what the claim relies on. Those verdicts can be wrong — read the claim’s quote and the cited source before relying on one.
Statistics and arithmetic are recomputed, not judged.
Confidence bands are shown only for fields calibrated on our annotated test set. None is calibrated yet, so no band is shown.
What counts as a claim ›How we measure confidence ›How we check this ›
Are you an author, or do you see a problem with this page? Request a review
