

The DOI matches its Crossref record; 24 of the 24 references it cites were found in a registry or an index.
Inhibition of succinate dehydrogenase dysregulates histone modification in mammalian cells
Open accessAbstract
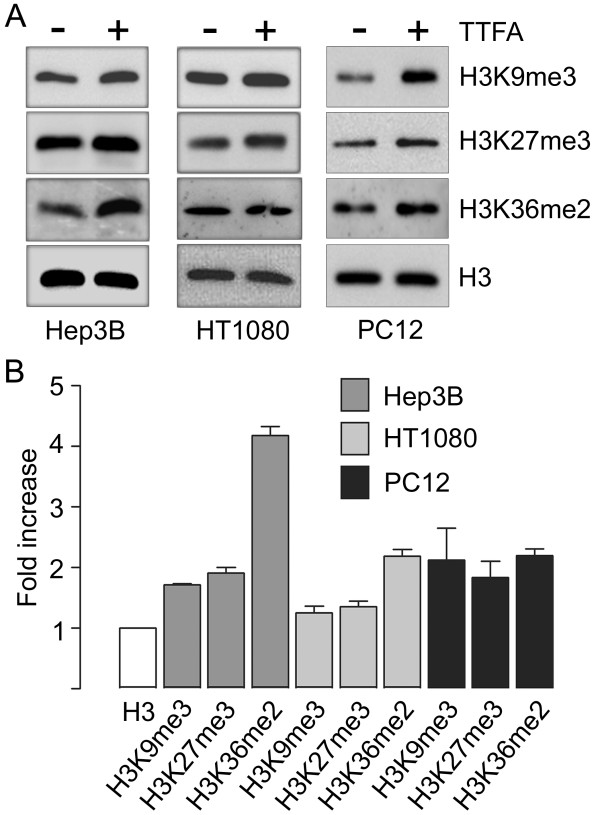
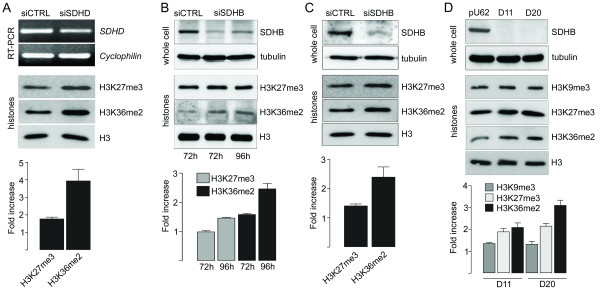
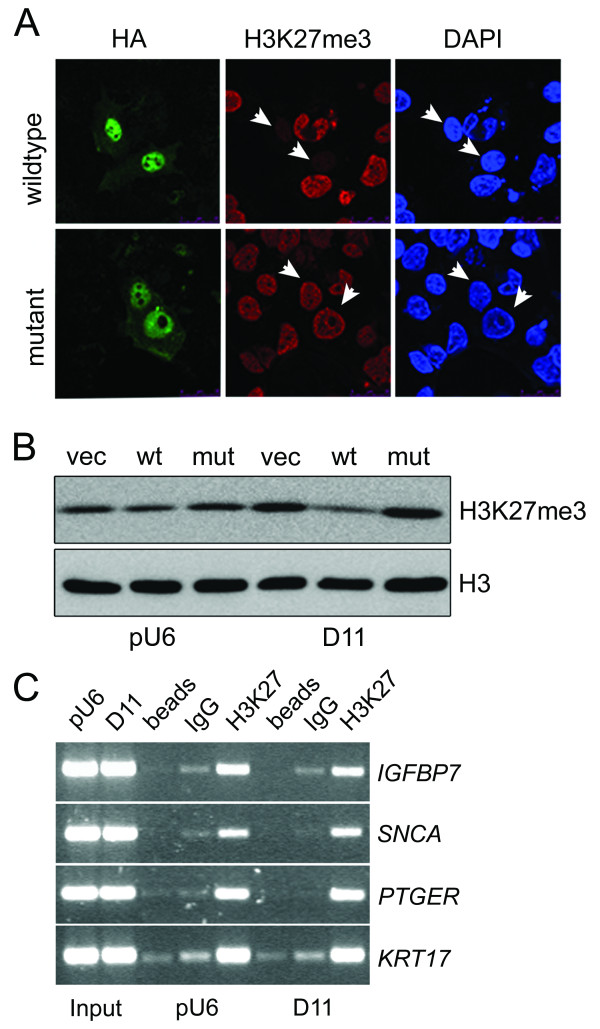
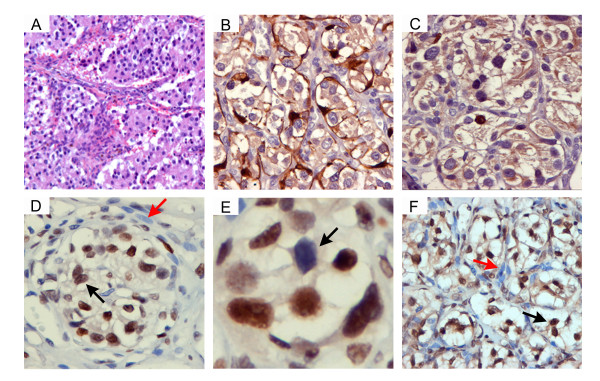
Remodelling of mitochondrial metabolism is a hallmark of cancer. Mutations in the genes encoding succinate dehydrogenase (SDH), a key Krebs cycle component, are associated with hereditary predisposition to pheochromocytoma and paraganglioma, through mechanisms which are largely unknown. Recently, the jumonji-domain histone demethylases have emerged as a novel family of 2-oxoglutarate-dependent chromatin modifiers with credible functions in tumourigenesis. Using pharmacological and siRNA methodologies we show that increased methylation of histone H3 is a general consequence of SDH loss-of-function in cultured mammalian cells and can be reversed by overexpression of the JMJD3 histone demethylase. ChIP analysis revealed that the core promoter of IGFBP7 , which encodes a secreted protein upregulated after loss of SDHB , showed decreased occupancy by H3K27me3 in the absence of SDH . Finally, we provide the first evidence that the chief (type I) cell is the major methylated histone-immunoreactive constituent of paraganglioma. These results support the notion that loss of mitochondrial function alters epigenetic processes and might provide a signature methylation mark for paraganglioma.
Overview
The claims and statistics of this paper haven’t been checked yet.
Run the check — free, no account needed. It reads the open-access text and checks the sources it cites.
Integrity signals
Registry
Cites
Statistics
Figures
Verification
Claims the paper makes
The claims and statistics of this paper haven’t been checked yet.
Run the check — free, no account needed. It reads the open-access text and checks the sources it cites.
Claims other papers make about this one
Each is checked against this paper’s own text: does it say what the citing paper says it does?
In the citing paper
“Elevated succinate levels can lead to epigenetic dysregulation (Cervera et al., 2009; Smith et al., 2007).”
From SIRT5-mediated lysine desuccinylation impacts diverse metabolic pathways (2013) · cites this paper as Cervera et al., 2009
In the citing paper
“R-2HG, succinate, and fumarate are all capable of inhibiting multiple 2-oxoglutarate-dependent dioxygenases, including the JmjC histone demethylases and TET proteins, when present at sufficiently high concentrations (Figure 6B) (Cervera et al., 2009; Chowdhury et al., 2011; Figueroa et al., 2010; Koivunen et al., 2012; Lu et al., 2012; Smith et al., 2007; Turcan et al., 2012; Xiao et al., 2012; Xu”
From Influence of Metabolism on Epigenetics and Disease (2013) · cites this paper as Cervera et al., 2009
In the citing paper
“Like 2HG accumulation, increased levels of succinate and fumarate can inhibit Jumonji C-domain–containing histone demethylases and TET enzymes, driving a widespread hypermethylation phenotype that disrupts normal cell differentiation (179, 180).”
From Regulation and function of the mammalian tricarboxylic acid cycle (2023) · cites this paper as [179]
Self-check
Percentages, sums and reported differences re-computed from the paper’s own numbers.
The self-check needs the paper’s full text.
Citations
Cites
A bivalent chromatin structure marks key developmental genes in embryonic stem cells
Bernstein, B. E., Mikkelsen, T. S., Xie, X., Kamal, M., Huebert, D. J., Cuff, J., Fry, B., Meissner, A., Wernig, M., Plath, K., et al. (2006) · Cell · doi:10.1016/j.cell.2006.02.041 · Cited by 5,361
Histone demethylation by a family of JmjC domain-containing proteins
Tsukada, Y.-I., Fang, J., Erdjument‐Bromage, H., Warren, M., Borchers, C. H., Tempst, P., & Zhang, Y. (2005) · Nature · doi:10.1038/nature04433 · Cited by 2,244
Succinate links TCA cycle dysfunction to oncogenesis by inhibiting HIF-α prolyl hydroxylase
Selak, M. A., Armour, S. M., MacKenzie, E. D., Boulahbel, H., Watson, D. G., Mansfield, K. D., Pan, Y., Simon, M. C., Thompson, C. B., & Gottlieb, E. (2005) · Cancer Cell · doi:10.1016/j.ccr.2004.11.022 · Cited by 2,108 · cited 5×
“Semi-quantitative PCR was then performed using specific oligonucleotide primers for SDHD [11] and cyclophilin [10].”
BackgroundMethodInfluentialMutations in SDHD , a Mitochondrial Complex II Gene, in Hereditary Paraganglioma
Baysal, B. E., Ferrell, R. E., Willett-Brozick, J. E., Lawrence, E. C., Myssiorek, D., Bosch, A., Mey, A. V. D., Taschner, P. E. M., Rubinstein, W. S., Myers, E. N., et al. (2000) · Science · doi:10.1126/science.287.5454.848 · Cited by 1,638
Self-citationThe impact of O2 availability on human cancer
Bertout, J. A., Patel, S. A., & Simon, M. C. (2008) · Nature Reviews Cancer · doi:10.1038/nrc2540 · Cited by 1,365
De Santa, F., Totaro, M. G., Prosperini, E., Notarbartolo, S., Testa, G., & Natoli, G. (2007) · Cell · doi:10.1016/j.cell.2007.08.019 · Cited by 965
Mutations in SDHC cause autosomal dominant paraganglioma, type 3
Niemann, S., & Müller, U. (2000) · Nature Genetics · doi:10.1038/81551 · Cited by 875
Role of Jhdm2a in regulating metabolic gene expression and obesity resistance
Tateishi, K., Okada, Y., Kallin, E. M., & Zhang, Y. (2009) · Nature · doi:10.1038/nature07777 · Cited by 442
Gimenez-Roqueplo, A.-P., Favier, J., Rustin, P., Mourad, J.-J., Plouin, P.-F., Corvol, P., Rötig, A., & Jeunemaitre, X. (2001) · The American Journal of Human Genetics · doi:10.1086/324413 · Cited by 364
A Polycomb Repression Signature in Metastatic Prostate Cancer Predicts Cancer Outcome
Yu, J., Yu, J., Rhodes, D. R., Tomlins, S. A., Cao, X., Chen, G., Mehra, R., Wang, X., Ghosh, D., Shah, R. B., et al. (2007) · Cancer Research · doi:10.1158/0008-5472.can-07-2498 · Cited by 349
Mechanisms involved in the regulation of histone lysine demethylases
Lan, F., Nottke, A. C., & Shi, Y. (2008) · Current Opinion in Cell Biology · doi:10.1016/j.ceb.2008.03.004 · Cited by 241
The emerging functions of histone demethylases
Agger, K., Christensen, J. F., Cloos, P. A., & Helin, K. (2008) · Current Opinion in Genetics & Development · doi:10.1016/j.gde.2007.12.003 · Cited by 237
Epigenetic biomarkers for human cancer: The time is now
Mulero‐Navarro, S., & Esteller, M. (2008) · Critical Reviews in Oncology/Hematology · doi:10.1016/j.critrevonc.2008.03.001 · Cited by 209
Neurotransmission and neuromodulation in the chemosensory carotid body
Nurse, C. A. (2005) · Autonomic Neuroscience · doi:10.1016/j.autneu.2005.04.008 · Cited by 185
Histology and ultrastructure of carotid body paragangliomas.Comparison with the normal gland
Grimley, P. M., & Glenner, G. G. (1967) · Cancer · doi:10.1002/1097-0142(196709)20:9 · Cited by 154
Miller, S. A., Huang, A. C., Miazgowicz, M. M., Brassil, M. M., & Weinmann, A. S. (2008) · Genes & Development · doi:10.1101/gad.1689708 · Cited by 150
Pollard, P. J., El-Bahrawy, M. A., Poulsom, R., Elia, G., Killick, P., Kelly, G. P., Hunt, T., Jeffery, R. E., Seedhar, P., Barwell, J., et al. (2006) · The Journal of Clinical Endocrinology & Metabolism · doi:10.1210/jc.2006-0920 · Cited by 145
Cells Silenced for SDHB Expression Display Characteristic Features of the Tumor Phenotype
Cervera, A. M., Apostolova, N., Crespo, F. L., Mata, M., & McCreath, K. J. (2008) · Cancer Research · doi:10.1158/0008-5472.can-07-5580 · Cited by 102
Self-citationClinical and molecular progress in hereditary paraganglioma: Figure 1
Baysal, B. E. (2008) · Journal of Medical Genetics · doi:10.1136/jmg.2008.058560 · Cited by 86
The human carotid body in health and disease
Heath, D. (1991) · The Journal of Pathology · doi:10.1002/path.1711640102 · Cited by 46
Erlic, Z., & Neumann, H. P. H. (2009) · HORMONES · doi:10.14310/horm.2002.1219 · Cited by 46
Reactivation of IGFBP7 by DNA demethylation inhibits human colon cancer cell growth in vitro
Lin, J., Lai, M., Huang, Q., Ruan, W., Ma, Y., & Cui, J. R. (2008) · Cancer Biology & Therapy · doi:10.4161/cbt.7.12.6937 · Cited by 41
Dekker, P. B. D., Corver, W. E., Hogendoorn, P. C. W., van der Meij, A. G. L., & Cornelisse, C. J. (2004) · The Journal of Pathology · doi:10.1002/path.1535 · Cited by 35
Yi, K. H., Nechushtan, H., Bowers, W. J., Walker, G. R., Zhang, Y., Pham, D. G., Podack, E. R., Federoff, H. J., Tolba, K. A., & Rosenblatt, J. D. (2007) · Cancer Research · doi:10.1158/0008-5472.can-06-2391 · Cited by 18
Cited by
Sorted by citations
Driver mutations in histone H3.3 and chromatin remodelling genes in paediatric glioblastoma
Schwartzentruber, J., Korshunov, A., Liu, X.-Y., Jones, D. T. W., Pfaff, E., Jacob, K., Sturm, D., Fontebasso, A. M., Quang, D.-A. K., Tönjes, M., et al. (2012) · Nature · doi:10.1038/nature10833 · Cited by 2,631
SIRT5-mediated lysine desuccinylation impacts diverse metabolic pathways
Park, J., Chen, Y., Tishkoff, D. X., Peng, C., Tan, M., Dai, L., Xie, Z., Zhang, Y., Zwaans, B. M. M., Skinner, M. E., et al. (2013) · Molecular Cell · doi:10.1016/j.molcel.2013.06.001 · Cited by 1,000
Influence of Metabolism on Epigenetics and Disease
Kaelin, W. G., & McKnight, S. L. (2013) · Cell · doi:10.1016/j.cell.2013.03.004 · Cited by 920
Metabolic Regulation of Epigenetics
Lu, C., & Thompson, C. B. (2012) · Cell Metabolism · doi:10.1016/j.cmet.2012.06.001 · Cited by 699
Succinate, an intermediate in metabolism, signal transduction, ROS, hypoxia, and tumorigenesis
Tretter, L., Patócs, A., & Chinopoulos, C. (2016) · Biochimica et Biophysica Acta (BBA) - Bioenergetics · doi:10.1016/j.bbabio.2016.03.012 · Cited by 550
Metadata
- Authors
- Cervera, A. M., Bayley, J.-P., Devilee, P., & McCreath, K. J.
- Affiliations
- Spanish National Centre for Cardiovascular Research (ES)
- Leiden University Medical Center (NL)
- Corresponding author
- McCreath, Kenneth J
- Venue
- Molecular Cancer
- Published
- 2009-10-22
- Volume
- 8
- Issue
- 1
- Pages
- 89-89
- ISSN
- 1476-4598 (ISSN-L)
- PMC
- PMC2770992
- OpenAlex
- W2166443483
- Cited by
- 156
- References
- 24
- Citations by year
- 2026: 12 · 2025: 4 · 2024: 7 · 2023: 8 · 2022: 13 · 2021: 9 · 2020: 7 · 2019: 5 · 2018: 5 · 2017: 9 · 2016: 9 · 2015: 14 · 2014: 18 · 2013: 12 · 2012: 16
- FWCI
- 8.11
- Type
- journal article
- Language
- en
- Open access
- gold
- doi.org
- Licence
- cc-by
- Locations
- Molecular Cancer (publishedVersion, cc-by)
- PubMed Central (publishedVersion, cc-by)
- PubMed (publishedVersion)
- DOAJ (DOAJ: Directory of Open Access Journals) (submittedVersion, cc-by-sa)
- Funders
- European Commission
- Ministerio de Ciencia e Innovación
- Centro Nacional de Investigaciones Cardiovasculares
- Instituto de Salud Carlos III (PI0600299)
- Topics
- Health Sciences › Medicine › Surgery › Adrenal and Paraganglionic Tumors
- Life Sciences › Biochemistry, Genetics and Molecular Biology › Molecular Biology › Epigenetics and DNA Methylation
- Life Sciences › Biochemistry, Genetics and Molecular Biology › Molecular Biology › Chromatin Remodeling and Cancer
- Keywords
- succinate dehydrogenase, histone H3 methylation, JMJD3, H3K27me3, IGFBP7, paraganglioma, pheochromocytoma, mitochondrial metabolism, epigenetic dysregulation, chief cells, cancer epigenetics
- MeSH terms
- Animals, Carotid Body Tumor, Histones, Humans, Immunohistochemistry, Methylation, Protein Processing, Post-Translational, Staining and Labeling, Succinate Dehydrogenase, Thenoyltrifluoroacetone, Gene Silencing, Cell Line, Tumor, Rats
About these checks
Registry, retraction, Cites and statistics results are computed, not judged, with one exception: a printed reference that no index lists is read once by a model before it counts as a citation error. Claims are extracted by a model and kept only when their quote appears verbatim in the text; each cited source is then checked, with a model’s help, for whether it says what the claim relies on. Those verdicts can be wrong — read the claim’s quote and the cited source before relying on one.
Statistics and arithmetic are recomputed, not judged.
Confidence bands are shown only for fields calibrated on our annotated test set. None is calibrated yet, so no band is shown.
What counts as a claim ›How we measure confidence ›How we check this ›
Are you an author, or do you see a problem with this page? Request a review
