

The DOI matches its Crossref record; 38 of the 38 references it cites were found in a registry or an index; none of the 44 sources its claims cite is checked for support yet.
The haematopoietic GTPase RhoH modulates IL3 signalling through regulation of STAT activity and IL3 receptor expression
Open accessAbstract
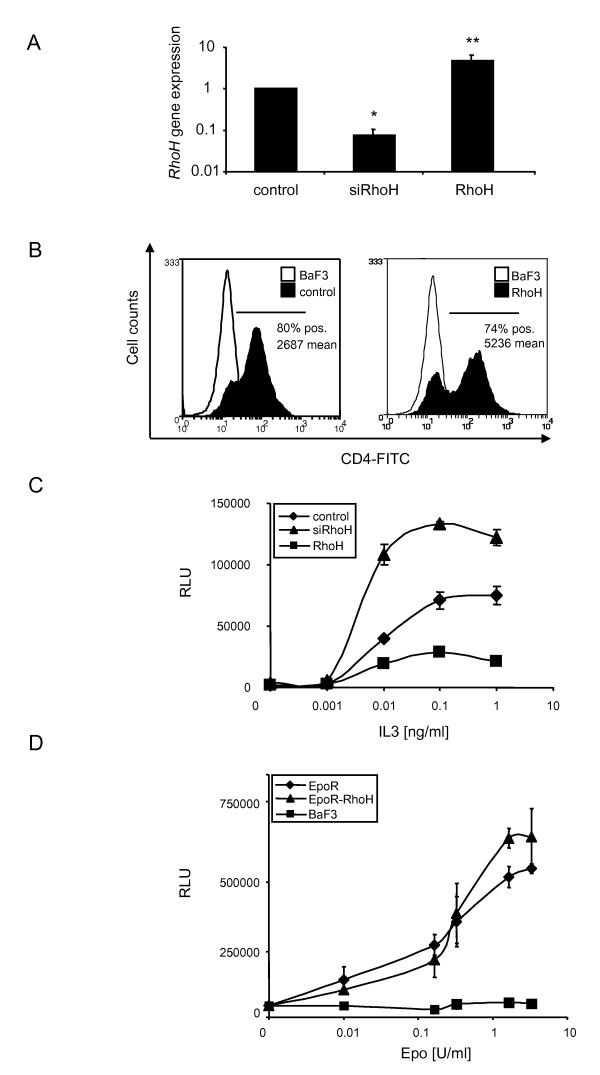
Background: RhoH is a constitutively active member of the family of Rho GTPases. Its expression is restricted to the haematopoietic lineage, where it serves as a positive regulator for T cell selection and mast cell function and as a negative regulator for growth-related functions in other lineages. Here, we examined the activation of signal transducer and activator of transcription (STAT) proteins in response to stimulation with interleukin 3 (IL3). Results: Using the murine IL3-dependent cell line BaF3 we investigated the influence of RhoH protein expression levels on IL3-mediated cellular responses. RhoH overexpressing cells showed lower sensitivity to IL3 and decreased STAT5 activation. SiRNA-mediated repression of RhoH gene expression led to an increase in proliferation and STAT5 activity which correlated with an increased number of IL3 receptor α chain molecules, also known as CD123, expressed at the cell surface. Interestingly, these findings could be reproduced using human THP-1 cells as a model system for acute myeloid leukaemia, where low RhoH levels are known to be an unfavourable prognostic marker. Overexpression of RhoH on the other hand caused an induction of STAT1 activity and western blot analysis revealed that activated STAT1 is phosphorylated on Tyr701. STAT1 is known to induce apoptosis or cell cycle arrest and we detected an upregulation of cyclin-dependent kinase inhibitors (CDKI) p21 Cip1 and p27 Kip1 in RhoH overexpressing BaF3 cells. Conclusions: We propose that RhoH functions as a negative regulator for IL3-induced signals through modulation of the JAK-STAT pathway. High levels of RhoH allow the IL3-dependent activation of STAT1 causing decreased proliferation through upregulation of p21 Cip1 and p27 Kip1 . Low RhoH levels on the other hand led to an upregulation of IL3-dependent cell growth, STAT5 activity and an increase of CD123 surface expression, linking RhoH to a CD123/STAT5 phenotype that has been described in AML patients.
Overview
CoChat Summary
Written by AI from the paper’s full text.
TL;DR
RhoH expression level inversely regulates IL3-driven proliferation in BaF3 cells by modulating STAT1/STAT5 activity and CD123/IRF-1 expression. Low RhoH promotes a STAT5/CD123 phenotype also seen in THP-1 AML cells, while high RhoH activates STAT1 and cell-cycle inhibitors.
Key findings
- In BaF3 cells, RhoH overexpression reduced IL3-dependent proliferation to app. 30% of control, whereas siRhoH increased proliferation to 160%; the effect was specific to IL3, as EpoR and EpoR-RhoH cells showed no growth difference.
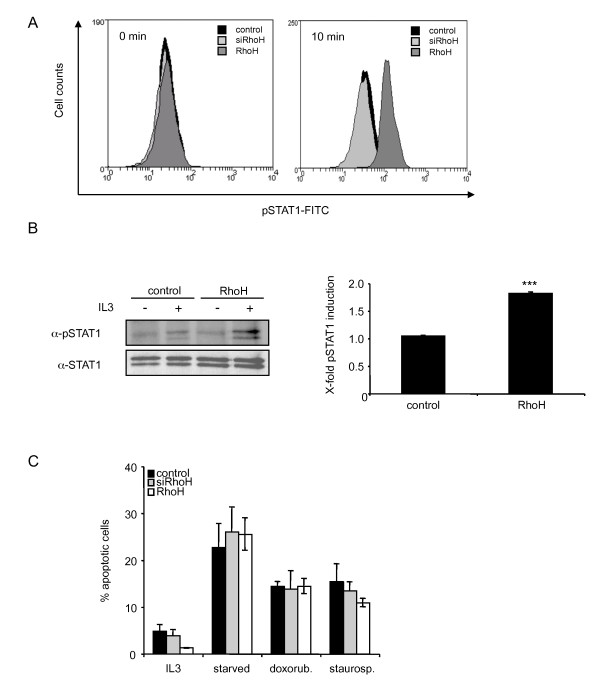
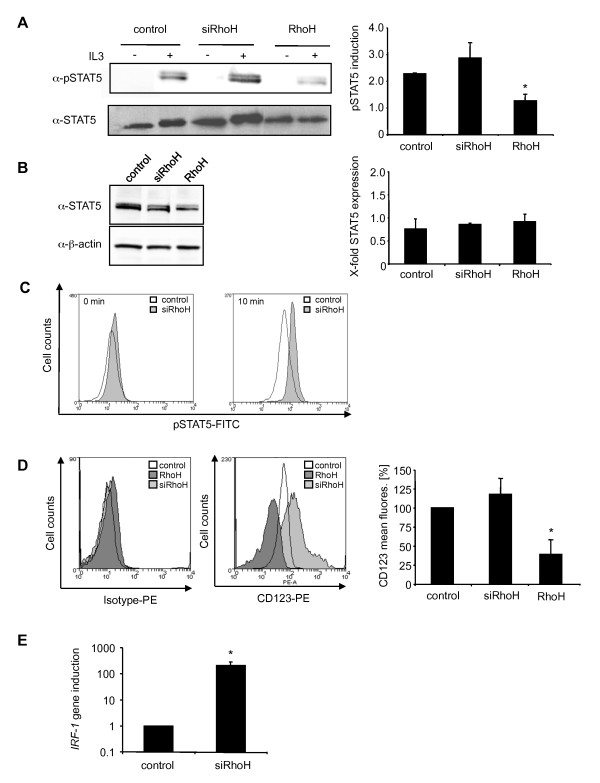
- RhoH overexpression decreased IL3-induced STAT5 phosphorylation to 50% and increased STAT1 Tyr701 phosphorylation app. two-fold; siRhoH increased STAT5 phosphorylation 1.3-fold, with no change in total STAT5 protein.
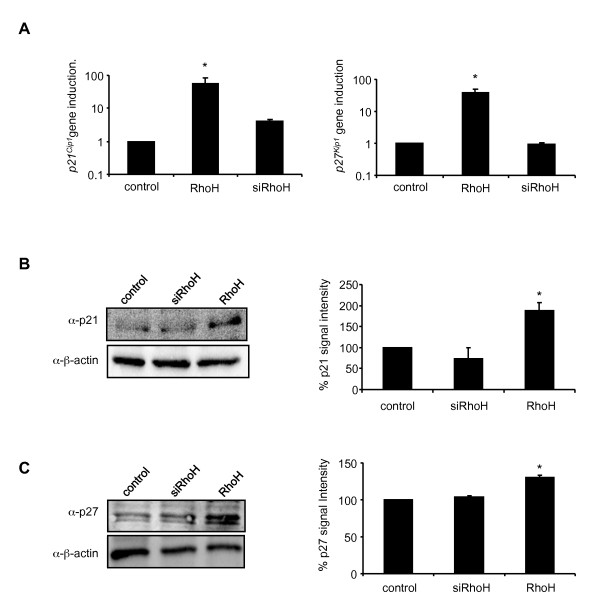
- RhoH overexpression increased p21Cip1 and p27Kip1 mRNA 55- and 40-fold, respectively, and protein levels 2-fold and 1.3-fold; no significant changes were detected in siRhoH cells.
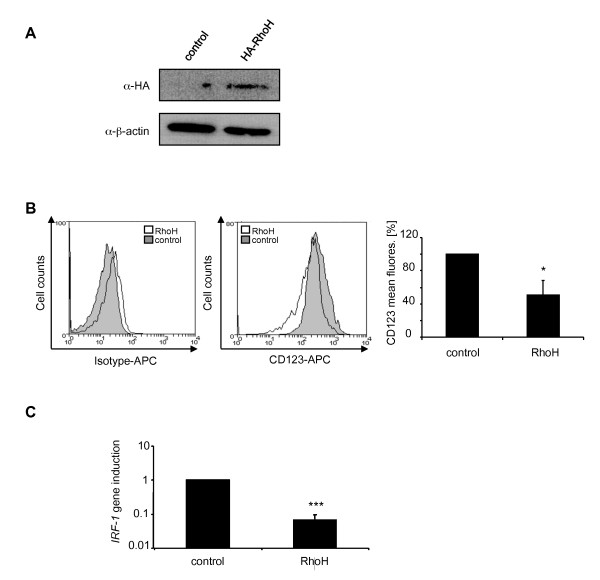
- siRhoH BaF3 cells expressed app. 25% more surface CD123 and app. 200-fold higher IRF-1 mRNA, while RhoH overexpression decreased CD123 by app. 50%; in THP-1 cells, RhoH overexpression decreased CD123 by 50% and IRF-1 expression 15-fold.
Methods
- Murine IL3-dependent BaF3 proB cells were retrovirally transduced to overexpress RhoH or to express siRhoH, with empty-vector controls; human THP-1 acute monocytic leukaemia cells were transiently transfected with HA-RhoH or vector.
- Proliferation/viability was measured by Cell Titer Glo ATP assay, apoptosis by Annexin V/PI FACS, STAT phosphorylation by intracellular FACS and immunoprecipitation/western blot, CD123 surface expression by FACS, and mRNA by quantitative real-time PCR with GAPDH as reference.
- Statistical significance was assessed by paired t-test; data are presented as mean ± SD, with most experiments performed at least in three independent experiments, though some quantifications used n = 2.
Limitations
- Stated: the exact mechanism by which RhoH negatively regulates Rac1 remains to be elucidated; RhoH-deficient animals showed no obvious haematopoietic defect and did not develop lymphomas, suggesting compensation by other cytokines and a limit of the animal model.
- Stated/evident: some supporting data are not shown (IL3-treated bone marrow cells from wildtype vs RhoH-deficient mice; siRhoH survival after cytokine deprivation/readdition), and several experiments have low n (n = 2 for some qPCR/western quantifications).
- Evident: the proposed STAT5→IRF-1→CD123 axis is correlative; no direct manipulation of IRF-1 or STAT5 is reported, and THP-1 findings rely on transient transfection.
Model-written summary. Check it against the paper before relying on it.
Integrity signals
Registry
Cites
Statistics
Figures
Verification
Claims the paper makes
38 Own result · 22 Own interpretation · 14 Not checked yet · 11 Check pending · 9 Own method · 6 No full text of the sources
A result the paper reports from its own data — it cites no other source for it, so there is none to check. The quote shows it is in the paper.
In the paper
“IRF-1 expression was app. 200 fold higher in siRhoH cells compared to control cells”
§ The haematopoietic GTPase RhoH modulates IL3 signalling through regulation of STAT activity and IL3 receptor expression > Results > IL3 Receptor α-chain expression is negatively regulated by RhoH
plainstates an association- Asserted: passes — The authors put it forward as true.
- Checkable: passes — It can be checked against evidence.
- Load-bearing: passes — The paper’s conclusions depend on it.
- Based: passes — The paper gives a reason why it holds.
- Rests on an assumption not shown here.
A result the paper reports from its own data — it cites no other source for it, so there is none to check. The quote shows it is in the paper.
In the paper
“RhoH overexpressing cells showed lower sensitivity to IL3 and decreased STAT5 activation.”
- Also stated in: § Underexpression of RhoH enhances STAT5 activity · boosted
“Western blot analysis (Figure 4A, left panel) and quantification of pSTAT5 levels (Figure 4A, right panel) that was corrected for the level of total STAT5 showed a strong reduction of STAT5 tyrosine phosphorylation compared to control cells (50%).”
§ The haematopoietic GTPase RhoH modulates IL3 signalling through regulation of STAT activity and IL3 receptor expression > Abstract > Results
boostedstates a cause- Asserted: passes — The authors put it forward as true.
- Checkable: passes — It can be checked against evidence.
- Load-bearing: passes — The paper’s conclusions depend on it.
- Based: passes — The paper gives a reason why it holds.
- Also stated in: § Underexpression of RhoH enhances STAT5 activity · boosted
A result the paper reports from its own data — it cites no other source for it, so there is none to check. The quote shows it is in the paper.
In the paper
“we found CD123 to be significantly downregulated in RhoH overexpressing cells (50%).”
§ The haematopoietic GTPase RhoH modulates IL3 signalling through regulation of STAT activity and IL3 receptor expression > Results > The acute monocytic leukaemia cell line THP-1 displays an siRhoH phenotype
plainstates a cause- Asserted: passes — The authors put it forward as true.
- Checkable: passes — It can be checked against evidence.
- Load-bearing: passes — The paper’s conclusions depend on it.
- Based: passes — The paper gives a reason why it holds.
- Rests on 2 assumptions not shown here.
A result the paper reports from its own data — it cites no other source for it, so there is none to check. The quote shows it is in the paper.
In the paper
“This increased expression was also found in IL3-treated bone marrow cells from wildtype compared to RhoH deficient mice (data not shown).”
§ The haematopoietic GTPase RhoH modulates IL3 signalling through regulation of STAT activity and IL3 receptor expression > Results > Overexpression of RhoH leads to the upregulation of p21Cip1 and p27Kip1
plainstates an association- Asserted: passes — The authors put it forward as true.
- Checkable: passes — It can be checked against evidence.
- Load-bearing: passes — The paper’s conclusions depend on it.
- Based: passes — The paper gives a reason why it holds.
A result the paper reports from its own data — it cites no other source for it, so there is none to check. The quote shows it is in the paper.
In the paper
“siRhoH cells express app. 25% more CD123 than control cells”
§ The haematopoietic GTPase RhoH modulates IL3 signalling through regulation of STAT activity and IL3 receptor expression > Results > IL3 Receptor α-chain expression is negatively regulated by RhoH
plainstates a cause- Asserted: passes — The authors put it forward as true.
- Checkable: passes — It can be checked against evidence.
- Load-bearing: passes — The paper’s conclusions depend on it.
- Based: passes — The paper gives a reason why it holds.
- Rests on 2 assumptions not shown here.
- It may state two separate claims as one. 22
- Probably not a substantial claim. 34
Create a free account to see these claims.
Create a free account to see these assumptions.
49 more claims
Create a free account to see all 100 claims and to verify the 30 references still open.
Claims other papers make about this one
Each is checked against this paper’s own text: does it say what the citing paper says it does?
In the citing paper
“Analogous to what has been shown during lymphocyte activation, the repression of RHOH during myeloid differentiation along the monocytic pathway would be expected to release signalling through the Rho family and positively affect processes such as adhesion, chemotaxis, and trans‐endothelial migration critical to the inflammatory response [2, 4, 6, 8‐10, 12].”
From Bimodal expression of RHOH during myelomonocytic differentiation: Implications for the expansion of AML differentiation therapy (2021) · cites this paper as [10]
Self-check
Percentages, sums and reported differences re-computed from the paper’s own numbers.
Each contradiction between two passages listed here was confirmed by an independent check.
Rated minor: it would not touch a result — a value no result rests on, a p-value that stays on the same side of the significance level, or a conflict that is clerical, resolved elsewhere in the paper, or outside its own findings.
In the paper
§ The haematopoietic GTPase RhoH modulates IL3 signalling through regulation of STAT activity and IL3 receptor expression > Results > RhoH modulates IL3-induced STAT activation
“(D) Apoptosis was induced in control cells, siRhoH or RhoH-transduced cells by cultivation in the absence of IL3 (overnight), treatment with 1 μM staurosporine (3 h) or with 1 μM doxorubicine (12 h) prior to Annexin V/PI staining and FACS analysis (mean ± SD, n = 3).”
§ The haematopoietic GTPase RhoH modulates IL3 signalling through regulation of STAT activity and IL3 receptor expression > Results > RhoH modulates IL3-induced STAT activation
“However, no difference in the susceptibility of RhoH cells was found compared to control cells (Figure 2C).”
Rated minor: it would not touch a result — a value no result rests on, a p-value that stays on the same side of the significance level, or a conflict that is clerical, resolved elsewhere in the paper, or outside its own findings.
In the paper
§ The haematopoietic GTPase RhoH modulates IL3 signalling through regulation of STAT activity and IL3 receptor expression > Results > Overexpression of RhoH leads to the upregulation of p21Cip1 and p27Kip1
“Quantification and statistical significance were performed using the 's t-test (mean ± SD, n = 2; *P ≤ 0.05).”
§ The haematopoietic GTPase RhoH modulates IL3 signalling through regulation of STAT activity and IL3 receptor expression > Methods > Materials
“All data shown were performed at least in three independent experiments.”
Rated minor: it would not touch a result — a value no result rests on, a p-value that stays on the same side of the significance level, or a conflict that is clerical, resolved elsewhere in the paper, or outside its own findings.
In the paper
§ The haematopoietic GTPase RhoH modulates IL3 signalling through regulation of STAT activity and IL3 receptor expression > Background
“RhoH null mice showed impaired T cell differentiation due to defective T cell receptor signalling [9,16].”
§ The haematopoietic GTPase RhoH modulates IL3 signalling through regulation of STAT activity and IL3 receptor expression > Discussion
“There was no obvious haematopoietic defect in RhoH-deficient animals, however, it is possible that the disturbed IL3-dependent signalling can be compensated by other cytokines.”
Citations
Cites
Etienne-Manneville, S., & Hall, A. (2002) · Nature · doi:10.1038/nature01148 · Cited by 4,201
Meraz, M. A., White, J. M., Sheehan, K. C. F., Bach, E. A., Rodig, S. J., Dighe, A. S., Kaplan, D. H., Riley, J. K., Greenlund, A. C., Campbell, D., et al. (1996) · Cell · doi:10.1016/s0092-8674(00)81288-x · Cited by 1,656
Targeted Disruption of the Mouse Stat1 Gene Results in Compromised Innate Immunity to Viral Disease
Durbin, J. E., Hackenmiller, R., Simon, M. C., & Levy, D. E. (1996) · Cell · doi:10.1016/s0092-8674(00)81289-1 · Cited by 1,242
Karasuyama, H., & Melchers, F. (1988) · European Journal of Immunology · doi:10.1002/eji.1830180115 · Cited by 1,059
Hypermutation of multiple proto-oncogenes in B-cell diffuse large-cell lymphomas
Pasqualucci, L., Neumeister, P., Goossens, T., Nanjangud, G., Chaganti, R. S. K., Küppers, R., & Dalla-Favera, R. (2001) · Nature · doi:10.1038/35085588 · Cited by 1,032
Bar‐Sagi, D., & Hall, A. (2000) · Cell · doi:10.1016/s0092-8674(00)00115-x · Cited by 802
Chin, Y. E., Kitagawa, M., Su, W.-C. S., You, Z.-H., Iwamoto, Y., & Fu, X.-Y. (1996) · Science · doi:10.1126/science.272.5262.719 · Cited by 696
Increasing Complexity of the Ras Signaling Pathway
Vojtek, A. B., & Der, C. J. (1998) · Journal of Biological Chemistry · doi:10.1074/jbc.273.32.19925 · Cited by 582
rac, a novel ras-related family of proteins that are botulinum toxin substrates
Didsbury, J., Weber, R. F., Bokoch, G. M., Evans, T., & Snyderman, R. (1989) · Journal of Biological Chemistry · doi:10.1016/s0021-9258(19)84716-6 · Cited by 575
A novel ras-related gene family
Madaule, P., & Axel, R. (1985) · Cell · doi:10.1016/0092-8674(85)90058-3 · Cited by 502
Cited by
CellFM: a large-scale foundation model pre-trained on transcriptomics of 100 million human cells
Zeng, Y., Xie, J., Shangguan, N., Wei, Z., Li, W., Su, Y., Yang, S., Zhang, C., Zhang, J., Fang, N., et al. (2025) · Nature Communications · doi:10.1038/s41467-025-59926-5 · Cited by 120
The role of cytokines in acute myeloid leukemia: A systematic review
Kupsa, T., Horáček, J. M., & Jebavý, L. (2012) · Biomedical Papers · doi:10.5507/bp.2012.108 · Cited by 50
Activation of STAT transcription factors by the Rho-family GTPases
Corry, J., Mott, H. R., & Owen, D. (2020) · Biochemical Society Transactions · doi:10.1042/bst20200468 · Cited by 40
Methanol extract of the ethnopharmaceutical remedy Smilax spinosa exhibits anti-neoplastic activity
Seelinger, M., Popescu, R., Giessrigl, B., Jarukamjorn, K., Unger, C., Wallnöfer, B., Fritzer‐Szekeres, M., Szekeres, T., Díaz, R. E., Jäger, W. R., et al. (2012) · International Journal of Oncology · doi:10.3892/ijo.2012.1538 · Cited by 37
Feng, L., Li, C., Zeng, L., Gao, D., Sun, Y., Zhong, L., Lin, H., Shu, H., & Li, S. (2022) · Signal Transduction and Targeted Therapy · doi:10.1038/s41392-021-00834-7 · Cited by 34
Metadata
- Authors
- Gündogdu, M. S., Liu, H., Metzdorf, D., Hildebrand, D., Aigner, M., Aktories, K., Heeg, K., & Kubatzky, K. F.
- Affiliations
- Heidelberg University (DE)
- University of Bern (CH)
- Universitätsklinikum Erlangen (DE)
- University of Freiburg (DE)
- Corresponding author
- Kubatzky, Katharina F
- Venue
- Molecular Cancer
- Published
- 2010-08-25
- Volume
- 9
- Issue
- 1
- Pages
- 225-225
- ISSN
- 1476-4598 (ISSN-L)
- PMC
- PMC2936343
- OpenAlex
- W2148472599
- Semantic Scholar
- 82c29c1276b025e4a6c8dee1e648fcc5734f17cf
- Cited by
- 29
- References
- 38
- Citations by year
- 2025: 2 · 2024: 4 · 2023: 4 · 2022: 3 · 2021: 1 · 2020: 1 · 2018: 1 · 2016: 2 · 2015: 1 · 2014: 3 · 2013: 1 · 2012: 3
- FWCI
- 0.90
- Type
- journal article
- Language
- en
- Open access
- gold
- doi.org
- Licence
- cc-by
- Locations
- Molecular Cancer (publishedVersion, cc-by)
- PubMed (publishedVersion)
- PubMed Central (publishedVersion, cc-by)
- heiDOK (Heidelberg University) (acceptedVersion, other-oa)
- DOAJ (DOAJ: Directory of Open Access Journals) (submittedVersion)
- Funders
- Deutsche Forschungsgemeinschaft
- Topics
- Life Sciences › Immunology and Microbiology › Immunology › Cytokine Signaling Pathways and Interactions
- Life Sciences › Biochemistry, Genetics and Molecular Biology › Molecular Biology › Protein Kinase Regulation and GTPase Signaling
- Life Sciences › Biochemistry, Genetics and Molecular Biology › Molecular Biology › Protein Tyrosine Phosphatases
- Keywords
- RhoH, Rho GTPases, STAT5, STAT1, CD123, JAK/STAT signaling, acute myeloid leukemia, p21, p27, cell proliferation, hematopoietic cells, Ba/F3 cells, THP-1 cells
- MeSH terms
- Animals, Cell Line, Interleukin-3, Transcription Factors, Signal Transduction, Up-Regulation, Receptors, Interleukin-3, rho GTP-Binding Proteins, Cell Proliferation, Cyclin-Dependent Kinase Inhibitor p21, Cyclin-Dependent Kinase Inhibitor p27, STAT Transcription Factors, Mice
About these checks
Registry, retraction, Cites and statistics results are computed, not judged, with one exception: a printed reference that no index lists is read once by a model before it counts as a citation error. Claims are extracted by a model and kept only when their quote appears verbatim in the text; each cited source is then checked, with a model’s help, for whether it says what the claim relies on. Those verdicts can be wrong — read the claim’s quote and the cited source before relying on one.
A language model drew the claims from the paper on 2026-11-12, under version 3 of the claim definition (model deepseek-v4.1-flash, prompt extract-v3).
A second model labelled each claim on 2026-11-12 (model jev-1.13-20260917, definition revision gold-guideline-v0.2).
Statistics and arithmetic are recomputed, not judged.
Confidence bands are shown only for fields calibrated on our annotated test set. None is calibrated yet, so no band is shown.
What counts as a claim ›How we measure confidence ›How we check this ›
Are you an author, or do you see a problem with this page? Request a review
How to cite
Cite CoChat for the checks on this page, and the paper for its own findings.
- This page
- CoChat. (2026). Citation check: The haematopoietic GTPase RhoH modulates IL3 signalling through regulation of STAT activity and IL3 receptor expression. https://app.cochat.ai/papers/10.1186/1476-4598-9-225
- The paper
- Gündogdu, M. S., Liu, H., Metzdorf, D., Hildebrand, D., Aigner, M., Aktories, K., Heeg, K., & Kubatzky, K. F. (2010). The haematopoietic GTPase RhoH modulates IL3 signalling through regulation of STAT activity and IL3 receptor expression. Molecular Cancer. https://doi.org/10.1186/1476-4598-9-225
