

The DOI matches its Crossref record; 40 of the 40 references it cites were found in a registry or an index.
Oncogenic KRAS modulates mitochondrial metabolism in human colon cancer cells by inducing HIF-1α and HIF-2α target genes
Open accessAbstract
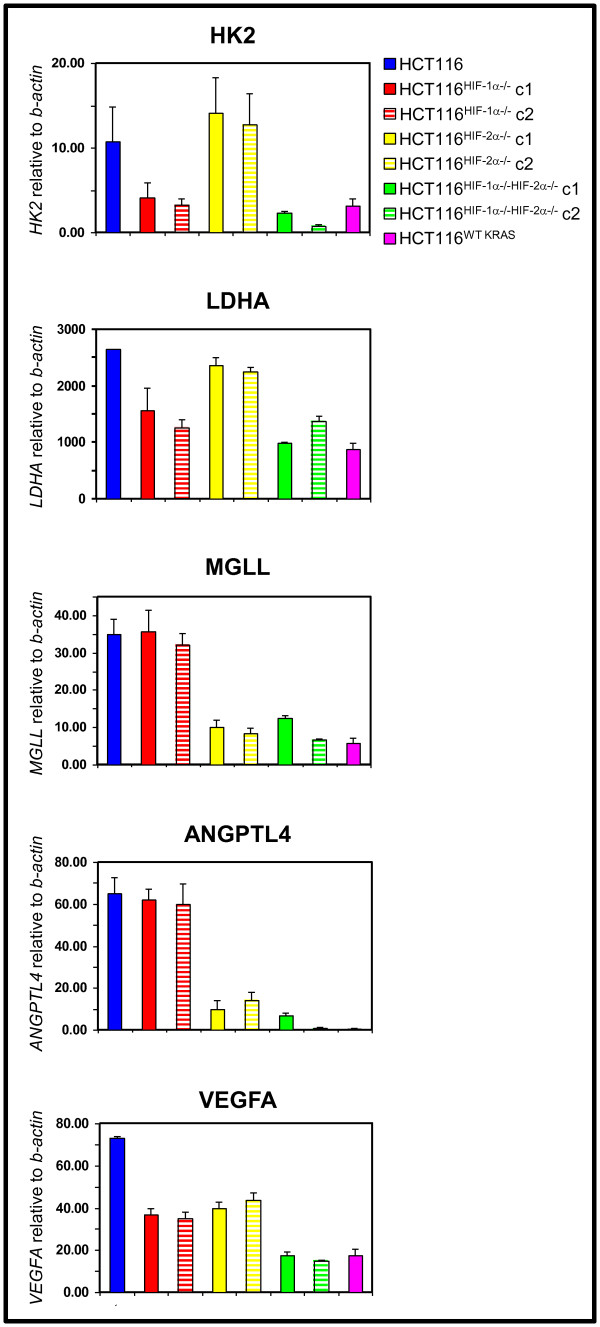
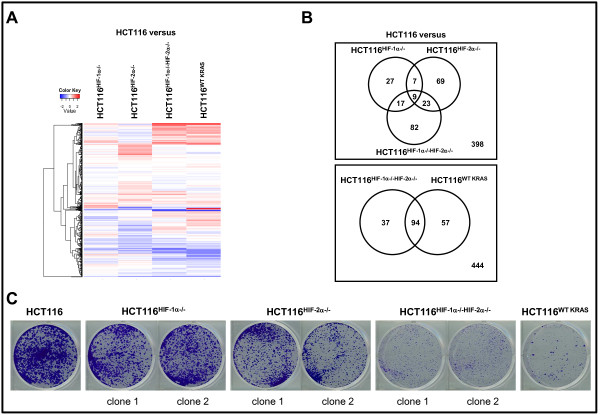
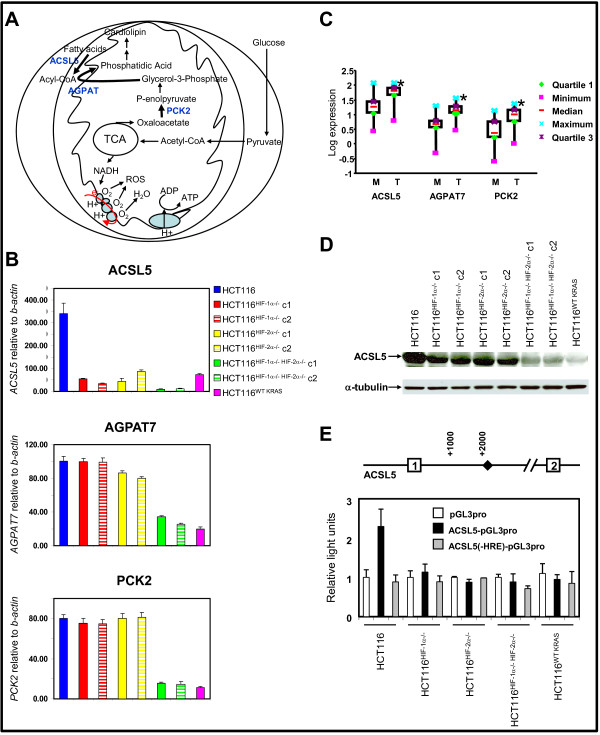
Background: Activating KRAS mutations are important for cancer initiation and progression; and have recently been shown to cause primary resistance to therapies targeting the epidermal growth factor receptor. Therefore, strategies are currently in development to overcome treatment resistance due to oncogenic KRAS. The hypoxia-inducible factors-1α and -2α (HIF-1α and HIF-2α) are activated in cancer due to dysregulated ras signaling. Methods: To understand the individual and combined roles of HIF-1α and HIF-2α in cancer metabolism and oncogenic KRAS signaling, we used targeted homologous recombination to disrupt the oncogenic KRAS, HIF-1α, and HIF-2α gene loci in HCT116 colon cancer cells to generate isogenic HCT116 WT KRAS, HCT116 HIF-1α-/-, HCT116 HIF-2α-/-, and HCT116 HIF-1α-/-HIF-2α-/- cell lines. Results: Global gene expression analyses of these cell lines reveal that HIF-1α and HIF-2α work together to modulate cancer metabolism and regulate genes signature overlapping with oncogenic KRAS. Cancer cells with disruption of both HIF-1α and HIF-2α or oncogenic KRAS showed decreased aerobic respiration and ATP production, with increased ROS generation. Conclusion: Our findings suggest novel strategies for treating tumors with oncogenic KRAS mutations.
Overview
The claims and statistics of this paper haven’t been checked yet.
Run the check — free, no account needed. It reads the open-access text and checks the sources it cites.
Integrity signals
Registry
Cites
Statistics
Figures
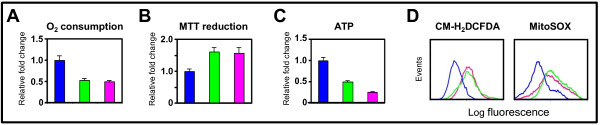
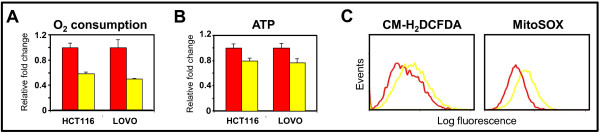
Verification
Claims the paper makes
The claims and statistics of this paper haven’t been checked yet.
Run the check — free, no account needed. It reads the open-access text and checks the sources it cites.
Claims other papers make about this one
Each is checked against this paper’s own text: does it say what the citing paper says it does?
In the citing paper
“Oncogenic KRAS also upregulates expression of other key glycolytic enzymes, such as PFK1, ENO1, and LDHA28,31–33, thereby promoting glycolytic flux and enabling the production of glycolytic intermediates that can be shunted into other anabolic pathways (Fig 2).”
From The metabolic landscape of RAS-driven cancers from biology to therapy (2021) · cites this paper as [33]
Self-check
Percentages, sums and reported differences re-computed from the paper’s own numbers.
The self-check needs the paper’s full text.
Citations
Cites
A SIMPLE METHOD FOR THE ISOLATION AND PURIFICATION OF TOTAL LIPIDES FROM ANIMAL TISSUES
Folch, J., Lees, M., & Stanley, G. H. S. (1957) · Journal of Biological Chemistry · doi:10.1016/s0021-9258(18)64849-5 · Cited by 65,189
Hanahan, D., & Weinberg, R. A. (2000) · Cell · doi:10.1016/s0092-8674(00)81683-9 · Cited by 29,219
Warburg, O. (1956) · Science · doi:10.1126/science.123.3191.309 · Cited by 13,425
Targeting HIF-1 for cancer therapy
Semenza, G. L. (2003) · Nature Reviews Cancer · doi:10.1038/nrc1187 · Cited by 6,717
Hypoxia — a key regulatory factor in tumour growth
Harris, A. L. (2002) · Nature Reviews Cancer · doi:10.1038/nrc704 · Cited by 5,177
ras oncogenes in human cancer: a review.
Bos, J. L. (1989) · PubMed · Cited by 5,061
Kim, J.-W., Tchernyshyov, I., Semenza, G. L., & Dang, C. V. (2006) · Cell Metabolism · doi:10.1016/j.cmet.2006.02.002 · Cited by 3,905
HIF-1 mediates adaptation to hypoxia by actively downregulating mitochondrial oxygen consumption
Papandreou, I., Cairns, R. A., Fontana, L., Lim, A. L., & Denko, N. C. (2006) · Cell Metabolism · doi:10.1016/j.cmet.2006.01.012 · Cited by 2,267
Ohh, M., Park, C. W., Ivan, M., Hoffman, M. A., Kim, T.-Y., Huang, L. E., Pavletich, N., Chau, V., & Kaelin, W. G. (2000) · Nature Cell Biology · doi:10.1038/35017054 · Cited by 1,577
HIF-1 Regulates Cytochrome Oxidase Subunits to Optimize Efficiency of Respiration in Hypoxic Cells
Fukuda, R., Zhang, H., Kim, J.-W., Shimoda, L., Dang, C. V., & Semenza, G. L. (2007) · Cell · doi:10.1016/j.cell.2007.01.047 · Cited by 1,225
Cited by
Sorted by citations
Deconvoluting the context-dependent role for autophagy in cancer
White, E. (2012) · Nature reviews. Cancer · doi:10.1038/nrc3262 · Cited by 1,758
Kamphorst, J. J., Cross, J. R., Fan, J., de Stanchina, E., Mathew, R., White, E. P., Thompson, C. B., & Rabinowitz, J. D. (2013) · Proceedings of the National Academy of Sciences · doi:10.1073/pnas.1307237110 · Cited by 726
Fan, J., Kamphorst, J. J., Mathew, R., Chung, M. K., White, E., Shlomi, T., & Rabinowitz, J. D. (2013) · Molecular Systems Biology · doi:10.1038/msb.2013.65 · Cited by 428
The metabolic landscape of RAS-driven cancers from biology to therapy
Mukhopadhyay, S., Vander Heiden, M. G., & McCormick, F. (2021) · Nature Cancer · doi:10.1038/s43018-021-00184-x · Cited by 315
Vincent, E. E., Sergushichev, A., Griss, T., Gingras, M., Samborska, B., Ntimbane, T., Coelho, P. P., Blagih, J., Raissi, T. C., Choinière, L., et al. (2015) · Molecular Cell · doi:10.1016/j.molcel.2015.08.013 · Cited by 281
Metadata
- Authors
- Chun, S. Y., Johnson, C., Washburn, J. G., Cruz-Correa, M. R., Dang, D. T., & Dang, L. H.
- Affiliations
- University of Michigan (US)
- University of Puerto Rico System (PR)
- University of Florida (US)
- Corresponding author
- Dang, Long H
- Venue
- Molecular Cancer
- Published
- 2010-11-13
- Volume
- 9
- Issue
- 1
- Pages
- 293-293
- ISSN
- 1476-4598 (ISSN-L)
- PMC
- PMC2999617
- OpenAlex
- W2107951449
- Cited by
- 109
- References
- 39
- Citations by year
- 2026: 2 · 2025: 6 · 2024: 8 · 2023: 6 · 2022: 14 · 2021: 12 · 2020: 8 · 2019: 4 · 2018: 3 · 2017: 3 · 2016: 6 · 2015: 4 · 2014: 13 · 2013: 8 · 2012: 3
- FWCI
- 2.01
- Type
- journal article
- Language
- en
- Open access
- gold
- doi.org
- Licence
- cc-by
- Locations
- Molecular Cancer (publishedVersion, cc-by)
- Europe PMC (PubMed Central) (publishedVersion, cc-by)
- PubMed Central (publishedVersion, cc-by)
- PubMed (publishedVersion)
- Deep Blue (University of Michigan) (submittedVersion)
- DOAJ (DOAJ: Directory of Open Access Journals) (submittedVersion, cc-by-sa)
- Funders
- Pfizer
- National Comprehensive Cancer Network
- National Institutes of Health
- University of Michigan Comprehensive Cancer Center
- National Cancer Institute (R21CA115809, K22CA111897)
- Topics
- Life Sciences › Biochemistry, Genetics and Molecular Biology › Cancer Research › Cancer, Hypoxia, and Metabolism
- Life Sciences › Biochemistry, Genetics and Molecular Biology › Molecular Biology › Metabolism, Diabetes, and Cancer
- Life Sciences › Biochemistry, Genetics and Molecular Biology › Molecular Biology › Kruppel-like factors research
- Keywords
- oncogenic KRAS, HIF-1α, HIF-2α, hypoxia-inducible factor, colon cancer, mitochondrial metabolism, aerobic respiration, reactive oxygen species, ATP production, KRAS mutation, isogenic cell lines, HCT116 cells, cancer metabolism
- MeSH terms
- Endothelial PAS Domain-Containing Protein 1, Adenosine Triphosphate, Colonic Neoplasms, Humans, Mitochondria, Oxygen Consumption, Proto-Oncogene Proteins, Blotting, Western, Proto-Oncogene Proteins p21(ras), Mutagenesis, Site-Directed, Reactive Oxygen Species, ras Proteins, Reverse Transcriptase Polymerase Chain Reaction, Gene Expression Profiling, HCT116 Cells, Cell Line, Tumor, Basic Helix-Loop-Helix Proteins, Hypoxia-Inducible Factor 1, alpha Subunit
About these checks
Registry, retraction, Cites and statistics results are computed, not judged, with one exception: a printed reference that no index lists is read once by a model before it counts as a citation error. Claims are extracted by a model and kept only when their quote appears verbatim in the text; each cited source is then checked, with a model’s help, for whether it says what the claim relies on. Those verdicts can be wrong — read the claim’s quote and the cited source before relying on one.
Statistics and arithmetic are recomputed, not judged.
Confidence bands are shown only for fields calibrated on our annotated test set. None is calibrated yet, so no band is shown.
What counts as a claim ›How we measure confidence ›How we check this ›
Are you an author, or do you see a problem with this page? Request a review
