

The DOI matches its Crossref record; 114 of the 117 references it cites were found in a registry or an index.
Strong mitochondrial DNA support for a Cretaceous origin of modern avian lineages
Open accessAbstract
BACKGROUND: Determining an absolute timescale for avian evolutionary history has proven contentious. The two sources of information available, paleontological data and inference from extant molecular genetic sequences (colloquially, 'rocks' and 'clocks'), have appeared irreconcilable; the fossil record supports a Cenozoic origin for most modern lineages, whereas molecular genetic estimates suggest that these same lineages originated deep within the Cretaceous and survived the K-Pg (Cretaceous-Paleogene; formerly Cretaceous-Tertiary or K-T) mass-extinction event. These two sources of data therefore appear to support fundamentally different models of avian evolution. The paradox has been speculated to reflect deficiencies in the fossil record, unrecognized biases in the treatment of genetic data or both. Here we attempt to explore uncertainty and limit bias entering into molecular divergence time estimates through: (i) improved taxon (n = 135) and character (n = 4594 bp mtDNA) sampling; (ii) inclusion of multiple cladistically tested internal fossil calibration points (n = 18); (iii) correction for lineage-specific rate heterogeneity using a variety of methods (n = 5); (iv) accommodation of uncertainty in tree topology; and (v) testing for possible effects of episodic evolution. RESULTS: The various 'relaxed clock' methods all indicate that the major (basal) lineages of modern birds originated deep within the Cretaceous, although temporal intraordinal diversification patterns differ across methods. We find that topological uncertainty had a systematic but minor influence on date estimates for the origins of major clades, and Bayesian analyses assuming fixed topologies deliver similar results to analyses with unconstrained topologies. We also find that, contrary to expectation, rates of substitution are not autocorrelated across the tree in an ancestor-descendent fashion. Finally, we find no signature of episodic molecular evolution related to either speciation events or the K-Pg boundary that could systematically mislead inferences from genetic data. CONCLUSION: The 'rock-clock' gap has been interpreted by some to be a result of the vagaries of molecular genetic divergence time estimates. However, despite measures to explore different forms of uncertainty in several key parameters, we fail to reconcile molecular genetic divergence time estimates with dates taken from the fossil record; instead, we find strong support for an ancient origin of modern bird lineages, with many extant orders and families arising in the mid-Cretaceous, consistent with previous molecular estimates. Although there is ample room for improvement on both sides of the 'rock-clock' divide (e.g. accounting for 'ghost' lineages in the fossil record and developing more realistic models of rate evolution for molecular genetic sequences), the consistent and conspicuous disagreement between these two sources of data more likely reflects a genuine difference between estimated ages of (i) stem-group origins and (ii) crown-group morphological diversifications, respectively. Further progress on this problem will benefit from greater communication between paleontologists and molecular phylogeneticists in accounting for error in avian lineage age estimates.
Overview
The claims and statistics of this paper haven’t been checked yet.
Run the check — free, no account needed. It reads the open-access text and checks the sources it cites.
Integrity signals
Registry
Cites
Statistics
Figures
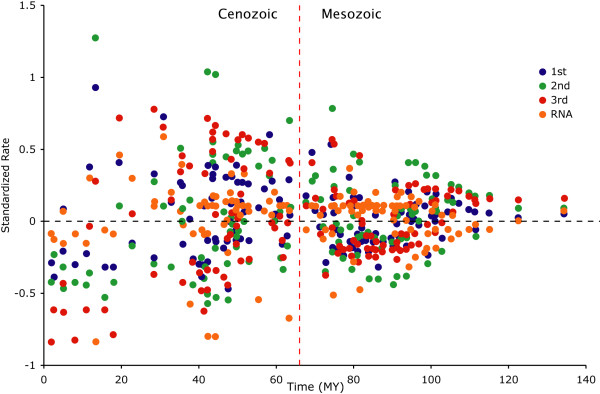
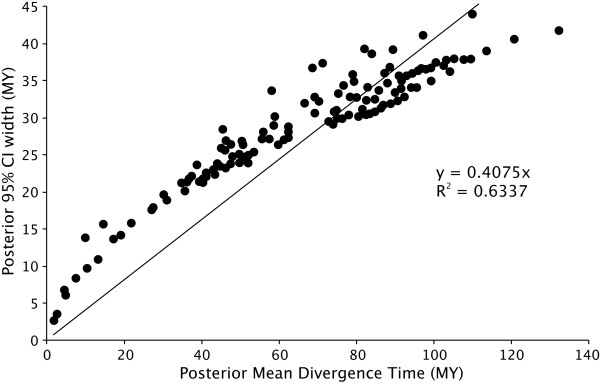
Verification
Claims the paper makes
The claims and statistics of this paper haven’t been checked yet.
Run the check — free, no account needed. It reads the open-access text and checks the sources it cites.
Claims other papers make about this one
Each is checked against this paper’s own text: does it say what the citing paper says it does?
The cited source says what the claim attributes to it.
In the citing paper
“Although WAIR has been recorded in the Tinamou and some neognaths, the origin of crown Aves (Neornithes) is estimated at approximately 86.5 MYA, using fossils [106], and 130 MYA, using molecular dating [107].”
From Assessing Arboreal Adaptations of Bird Antecedents: Testing the Ecological Setting of the Origin of the Avian Flight Stroke (2011) · cites this paper as [107]
Self-check
Percentages, sums and reported differences re-computed from the paper’s own numbers.
The self-check needs the paper’s full text.
Citations
Cites
PHYLIP-Phylogeny inference package (Version 3.2)
Felsenstein, J. (1989) · Cladistics · Cited by 17,682
BEAST: Bayesian evolutionary analysis by sampling trees
Drummond, A. J., & Rambaut, A. (2007) · BMC Evolutionary Biology · doi:10.1186/1471-2148-7-214 · Cited by 13,104
Relaxed Phylogenetics and Dating with Confidence
Drummond, A. J., Ho, S. Y. W., Phillips, M. J., & Rambaut, A. (2006) · PLoS Biology · doi:10.1371/journal.pbio.0040088 · Cited by 6,463 · cited 6×
“Newly developed methods exist where probability distributions can be applied to calibrated nodes in a Bayesian framework [47,84,85].”
InfluentialPAML: a program package for phylogenetic analysis by maximum likelihood
Yang, Z. (1997) · Computer applications in the biosciences · doi:10.1093/bioinformatics/13.5.555 · Cited by 5,377
Punctuated equilibria: an alternative to phyletic gradualism
Eldredge, N., Gould, S. J., & Schöpf, T. J. M. (1972) · Cited by 3,257
PHYLIP ( PHYLogeny Inference Package)
Cummings, M. P. (2004) · Dictionary of Bioinformatics and Computational Biology · doi:10.1002/9780471650126.dob0534.pub2 · Cited by 3,127
Handbook of the Birds of the World
del Hoyo, J., Elliott, A., Vicens, J. S. I., & Christie, D. G. S. (2010) · Medical Entomology and Zoology · Cited by 2,893
Cellular Scaling Rules for the Brains of Marsupials: Not as “Primitive” as Expected
Santos, S. E. D., Porfírio, J., Cunha, F., Manger, P. R., Tavares, W. C., Pessôa, L. M., Raghanti, M. A., Sherwood, C. C., & Herculano‐Houzel, S. (2017) · Brain Behavior and Evolution · doi:10.1159/000452856 · Cited by 2,652
Phylogeny and Classification of the Birds
Sibley, C. G., & Ahlquist, J. E. (1991) · Yale University Press eBooks · doi:10.2307/j.ctt1xp3v3r · Cited by 2,312
The delayed rise of present-day mammals
Bininda-Emonds, O. R. P., Cardillo, M., Jones, K. E., MacPhee, R. D. E., Beck, R. M. D., Grenyer, R., Price, S. A., Vos, R. A., Gittleman, J. L., & Purvis, A. (2007) · Nature · doi:10.1038/nature05634 · Cited by 2,082
Research works printed but not linked: 4
- Easteal S: Molecular evidence for the early divergence of placental mammals. BioEssays. 1999, 21: 1052-1058. 10.1002/(SICI)1521-1878(199912)22:1<1052::AID-BIES9>3.0.CO;2-6. · DOI
- Swofford DL: PAUP*. Phylogenetic Analysis Using Parsimony (*and Other Methods) 4 (beta 10). 2003, Sunderland, MA: Sinauer Associates
- Britton T, Anderson CL, Jaquet D, Lundqvist S, Bremer K: PATHd8 – a new method for estimating divergence times in large phylogenetic trees without a molecular clock. 2006, [ http://www.math.su.se/PATHd8 ]
- Cutler DJ: Dating5. 2000
Cited by
Sorted by citations
A phylogenomic study of birds reveals their evolutionary history
Hackett, S. J., Kimball, R. T., Reddy, S., Bowie, R. C. K., Braun, E. L., Braun, M. J., Chojnowski, J. L., Cox, W. A., Han, K.-L., Harshman, J., et al. (2008) · Science · doi:10.1126/science.1157704 · Cited by 2,125
Whole-genome analyses resolve early branches in the tree of life of modern birds
Jarvis, E. D., Mirarab, S., Aberer, A. J., Li, B., Houde, P., Li, C., Ho, S. Y. W., Faircloth, B. C., Nabholz, B., Howard, J. T., et al. (2014) · Science · doi:10.1126/science.1253451 · Cited by 1,901
Self-citationAccounting for Calibration Uncertainty in Phylogenetic Estimation of Evolutionary Divergence Times
Ho, S. Y. W., & Phillips, M. J. (2009) · Systematic Biology · doi:10.1093/sysbio/syp035 · Cited by 906
Phylogeny and tempo of diversification in the superradiation of spiny-rayed fishes
Near, T. J., Dornburg, A., Eytan, R. I., Keck, B. P., Smith, W. L., Kuhn, K. L., Moore, J. A., Price, S. A., Burbrink, F. T., Friedman, M., et al. (2013) · Proceedings of the National Academy of Sciences · doi:10.1073/pnas.1304661110 · Cited by 502
Bayesian Total-Evidence Dating Reveals the Recent Crown Radiation of Penguins
Gavryushkina, A., Heath, T. A., Ksepka, D. T., Stadler, T., Welch, D., & Drummond, A. J. (2016) · Systematic Biology · doi:10.1093/sysbio/syw060 · Cited by 372
A new time tree reveals Earth history’s imprint on the evolution of modern birds
Claramunt, S., & Cracraft, J. (2015) · Science Advances · doi:10.1126/sciadv.1501005 · Cited by 383
The origin and diversification of birds
Brusatte, S. L., O’Connor, J. K., & Jarvis, E. D. (2015) · Current Biology · doi:10.1016/j.cub.2015.08.003 · Cited by 334
McCormack, J. E., Harvey, M. G., Faircloth, B. C., Crawford, N. G., Glenn, T. C., & Brumfield, R. T. (2013) · PLoS ONE · doi:10.1371/journal.pone.0054848 · Cited by 347
Evolutionary stasis: the stable chromosomes of birds
Ellegren, H. (2010) · Trends in Ecology & Evolution · doi:10.1016/j.tree.2009.12.004 · Cited by 266
Insights into the Evolutionary History of an Emerging Livestock Pathogen: Porcine Circovirus 2
Firth, C., Charleston, M., Duffy, S., Shapiro, B., & Holmes, E. C. (2009) · Journal of Virology · doi:10.1128/jvi.01719-09 · Cited by 265
McCormack, J. E., Heled, J., Delaney, K. S., Peterson, A. T., & Knowles, L. L. (2010) · Evolution · doi:10.1111/j.1558-5646.2010.01097.x · Cited by 262
Phillips, M. J., Gibb, G. C., Crimp, E. A., & Penny, D. (2009) · Systematic Biology · doi:10.1093/sysbio/syp079 · Cited by 246
Evolution of Modern Birds Revealed by Mitogenomics: Timing the Radiation and Origin of Major Orders
Pacheco, M. A., Battistuzzi, F. U., Lentino, M., Aguilar, R. F., Kumar, S., & Escalante, A. A. (2011) · Molecular Biology and Evolution · doi:10.1093/molbev/msr014 · Cited by 245
Barker, F. K., Burns, K. J., Klicka, J., Lanyon, S. M., & Lovette, I. J. (2015) · The Auk · doi:10.1642/auk-14-110.1 · Cited by 223
Nakatani, M., Miya, M., Mabuchi, K., Saitoh, K., & Nishida, M. (2011) · BMC Evolutionary Biology · doi:10.1186/1471-2148-11-177 · Cited by 201
Metabolic rate and body size are linked with perception of temporal information
Healy, K., McNally, L., Ruxton, G. D., Cooper, N., & Jackson, A. L. (2013) · Animal Behaviour · doi:10.1016/j.anbehav.2013.06.018 · Cited by 202
Christidis, L., Rheindt, F. E., Iliff, M. J., Lepage, D., Rasmussen, P. C., Donald, P. F., Alström, P., Areta, J. I., Brammer, F. P., Chesser, R. T., et al. (2025) · doi:10.2173/avilist.v2025 · Cited by 203
Phylogenetic relationships based on two mitochondrial genes and hybridization patterns in Anatidae
Gonzalez, J., Düttmann, H., & Wink, M. (2009) · Journal of Zoology · doi:10.1111/j.1469-7998.2009.00622.x · Cited by 171
The impact of calibration and clock-model choice on molecular estimates of divergence times
Duchêne, S., Lanfear, R., & Ho, S. Y. W. (2014) · Molecular Phylogenetics and Evolution · doi:10.1016/j.ympev.2014.05.032 · Cited by 156
Cowman, P. F., Bellwood, D. R., & van Herwerden, L. (2009) · Molecular Phylogenetics and Evolution · doi:10.1016/j.ympev.2009.05.015 · Cited by 150
Brown, J. W., & Sörhannus, U. (2010) · PLoS ONE · doi:10.1371/journal.pone.0012759 · Cited by 148
Self-citationNew perspectives on the origin and diversification of Africa’s forest avifauna
Fjeldså, J., & Bowie, R. C. K. (2008) · African Journal of Ecology · doi:10.1111/j.1365-2028.2008.00992.x · Cited by 150
Gene duplication and fragmentation in the zebra finch major histocompatibility complex
Balakrishnan, C. N., Ekblom, R., Völker, M., Westerdahl, H., Godinez, R., Kotkiewicz, H., Burt, D. W., Graves, T., Griffin, D. K., Warren, W. C., et al. (2010) · BMC Biology · doi:10.1186/1741-7007-8-29 · Cited by 135
Evolutionary history of the butterflyfishes (f: Chaetodontidae) and the rise of coral feeding fishes
Bellwood, D. R., Klanten, O. S., Cowman, P. F., Pratchett, M. S., Konow, N., & van Herwerden, L. (2009) · Journal of Evolutionary Biology · doi:10.1111/j.1420-9101.2009.01904.x · Cited by 133
The value of avian genomics to the conservation of wildlife
Romanov, M. N., Tuttle, E. M., Houck, M. L., Modi, W. S., Chemnick, L. G., Korody, M. L., Mork, E. M. S., Otten, C. A., Renner, T., Jones, K. C., et al. (2009) · BMC Genomics · doi:10.1186/1471-2164-10-s2-s10 · Cited by 133
The Evolutionary Genomics of Birds
Ellegren, H. (2013) · Annual Review of Ecology Evolution and Systematics · doi:10.1146/annurev-ecolsys-110411-160327 · Cited by 125
Mayr, G. (2010) · Journal of Zoological Systematics & Evolutionary Research · doi:10.1111/j.1439-0469.2010.00586.x · Cited by 116
Imoto, J. M., Saitoh, K., Sasaki, T., Yonezawa, T., Adachi, J., Kartavtsev, Y. P., Miya, M. U., Nishida, M., & Hanzawa, N. (2012) · Gene · doi:10.1016/j.gene.2012.10.019 · Cited by 118
Phylogenetics, divergence times and diversification from three genomic partitions in monocots
Hertweck, K. L., Kinney, M. S., Stuart, S., Maurin, O., Mathews, S., Chase, M. W., Gandolfo, M. A., & Pires, J. C. (2015) · Botanical Journal of the Linnean Society · doi:10.1111/boj.12260 · Cited by 109
The Completeness of the Fossil Record of Mesozoic Birds: Implications for Early Avian Evolution
Brocklehurst, N., Upchurch, P., Mannion, P. D., & O'Connor, J. K. (2012) · PLoS ONE · doi:10.1371/journal.pone.0039056 · Cited by 113
Avian longevities and their interpretation under evolutionary theories of senescence
Wasser, D., & Sherman, P. W. (2010) · Journal of Zoology · doi:10.1111/j.1469-7998.2009.00671.x · Cited by 106
Toward Resolving Deep Neoaves Phylogeny: Data, Signal Enhancement, and Priors
Pratt, R. C., Gibb, G. C., Morgan‐Richards, M., Phillips, M. J., Hendy, M. D., & Penny, D. (2008) · Molecular Biology and Evolution · doi:10.1093/molbev/msn248 · Cited by 102
Near-Stasis in the Long-Term Diversification of Mesozoic Tetrapods
Benson, R., Butler, R. J., Alroy, J., Mannion, P. D., Carrano, M. T., & Lloyd, G. T. (2016) · PLoS Biology · doi:10.1371/journal.pbio.1002359 · Cited by 100
A role for migration‐linked genes and genomic islands in divergence of a songbird
Ruegg, K., Anderson, E. C., Boone, J. Q., Pouls, J., & Smith, T. B. (2014) · Molecular Ecology · doi:10.1111/mec.12842 · Cited by 103
What Determines Bird Beauty in Human Eyes?
Rádlová, S., & Frynta, D. (2013) · Anthrozoös · doi:10.2752/175303713x13534238631399 · Cited by 99
Haddrath, O., & Baker, A. J. (2012) · Proceedings of the Royal Society B Biological Sciences · doi:10.1098/rspb.2012.1630 · Cited by 101
Smith, N. D. (2010) · PLoS ONE · doi:10.1371/journal.pone.0013354 · Cited by 99
Return to the Malay Archipelago: the biogeography of Sundaic rainforest birds
Sheldon, F. H., Lim, H. C., & Moyle, R. G. (2015) · Journal für Ornithologie · doi:10.1007/s10336-015-1188-3 · Cited by 98
Battistuzzi, F. U., Filipski, A., Hedges, S. B., & Kumar, S. (2010) · Molecular Biology and Evolution · doi:10.1093/molbev/msq014 · Cited by 89
Body mass‐corrected molecular rate for bird mitochondrial DNA
Nabholz, B., Lanfear, R., & Fuchs, J. (2016) · Molecular Ecology · doi:10.1111/mec.13780 · Cited by 85
Černý, D., & Natale, R. (2022) · Molecular Phylogenetics and Evolution · doi:10.1016/j.ympev.2022.107620 · Cited by 90
Rothfels, C. J., Johnson, A. K., Hovenkamp, P., Swofford, D. L., Roskam, H. C., Fraser-Jenkins, C. R., Windham, M. D., & Pryer, K. M. (2015) · The American Naturalist · doi:10.1086/679662 · Cited by 85
Miya, M. U., & Nishida, M. (2014) · Ichthyological Research · doi:10.1007/s10228-014-0440-9 · Cited by 87
Age, origins and extinctions of the avifauna of Macaronesia
Illera, J., Rando, J., Richardson, D., & Emerson, B. (2012) · Quaternary Science Reviews · doi:10.1016/j.quascirev.2012.07.013 · Cited by 70
The evolutionary history of cockatoos (Aves: Psittaciformes: Cacatuidae)
White, N. E., Phillips, M. J., Gilbert, M. T. P., Alfaro‐Núñez, A., Willerslev, E., Mawson, P. R., Spencer, P. B. S., & Bunce, M. (2011) · Molecular Phylogenetics and Evolution · doi:10.1016/j.ympev.2011.03.011 · Cited by 88
Reweaving the Tapestry: a Supertree of Birds
Davis, K. E., & Page, R. (2014) · PLoS Currents · doi:10.1371/currents.tol.c1af68dda7c999ed9f1e4b2d2df7a08e · Cited by 85
Wang, P., Zhu, Y., Song, X., Cao, Z., Ding, Y., Liu, B., Zhu, X., Wang, S., Guo, W., & Zhang, T. (2012) · Theoretical and Applied Genetics · doi:10.1007/s00122-012-1797-7 · Cited by 86
An examination of phylogenetic models of substitution rate variation among lineages
Ho, S. Y. W. (2009) · Biology Letters · doi:10.1098/rsbl.2008.0729 · Cited by 86
A Paleogene origin for crown passerines and the diversification of the Oscines in the New World
Selvatti, A. P., Gonzaga, L. P., & Russo, C. (2015) · Molecular Phylogenetics and Evolution · doi:10.1016/j.ympev.2015.03.018 · Cited by 86
Ware, J. L., Grimaldi, D. A., & Engel, M. S. (2009) · Arthropod Structure & Development · doi:10.1016/j.asd.2009.11.003 · Cited by 83
Simulating and detecting autocorrelation of molecular evolutionary rates among lineages
Ho, S. Y. W., Duchêne, S., & Duchêne, D. A. (2014) · Molecular Ecology Resources · doi:10.1111/1755-0998.12320 · Cited by 84
Schweizer, M., D, O. S. C., Güntert, M., & Hertwig, S. T. (2009) · Molecular Phylogenetics and Evolution · doi:10.1016/j.ympev.2009.08.021 · Cited by 81
Schweizer, M., D, O. S. C., & Hertwig, S. T. (2011) · Journal of Biogeography · doi:10.1111/j.1365-2699.2011.02555.x · Cited by 81
What Have We Learned from the First 500 Avian Genomes?
Bravo, G. A., Schmitt, C. J., & Edwards, S. V. (2021) · Annual Review of Ecology Evolution and Systematics · doi:10.1146/annurev-ecolsys-012121-085928 · Cited by 81
Ho, S. Y. W., & Lanfear, R. (2010) · Mitochondrial DNA · doi:10.3109/19401736.2010.494727 · Cited by 72
Retroposon Insertions and the Chronology of Avian Sex Chromosome Evolution
Suh, A., Kriegs, J. O., Brosius, J., & Schmitz, J. (2011) · Molecular Biology and Evolution · doi:10.1093/molbev/msr147 · Cited by 74
Leavitt, S. D., Esslinger, T. L., Divakar, P. K., & Lumbsch, H. T. (2012) · Biological Journal of the Linnean Society · doi:10.1111/j.1095-8312.2012.01978.x · Cited by 71
do Amaral, F. R., Sheldon, F. H., Gamauf, A., Haring, E., Riesing, M., Silveira, L. F., & Wajntal, A. (2009) · Molecular Phylogenetics and Evolution · doi:10.1016/j.ympev.2009.07.020 · Cited by 69
Hoffmann, F. G., Opazo, J. C., & Storz, J. F. (2011) · Genome Biology and Evolution · doi:10.1093/gbe/evr055 · Cited by 69
Geomolecular Dating and the Origin of Placental Mammals
Phillips, M. J. (2015) · Systematic Biology · doi:10.1093/sysbio/syv115 · Cited by 71
Leavitt, S. D., Esslinger, T. L., Divakar, P. K., & Lumbsch, H. T. (2012) · BMC Evolutionary Biology · doi:10.1186/1471-2148-12-176 · Cited by 69
The origins of crown group birds: molecules and fossils
Mayr, G. (2014) · Palaeontology · doi:10.1111/pala.12103 · Cited by 72
Santure, A. W., Gratten, J., Mossman, J. A., Sheldon, B. C., & Slate, J. (2011) · BMC Genomics · doi:10.1186/1471-2164-12-283 · Cited by 69
Penguins Past, Present, and Future: Trends in the Evolution of the Sphenisciformes
Ksepka, D. T., & Ando, T. (2011) · doi:10.1002/9781119990475.ch6 · Cited by 68
Dufort, M. J. (2015) · Molecular Phylogenetics and Evolution · doi:10.1016/j.ympev.2015.08.025 · Cited by 67
Worthy, T. H., Mitri, M., Handley, W. D., Lee, M. S. Y., Anderson, A., & Sand, C. (2016) · PLoS ONE · doi:10.1371/journal.pone.0150871 · Cited by 68
Livezey, B. C. (2010) · Zoological Journal of the Linnean Society · doi:10.1111/j.1096-3642.2010.00635.x · Cited by 64
Wang, N., Braun, E. L., & Kimball, R. T. (2011) · Molecular Biology and Evolution · doi:10.1093/molbev/msr230 · Cited by 64
Nie, W., O’Brien, P. C. M., Ng, B. L., Fu, B., Volobouev, V. T., Carter, N. P., Ferguson-Smith, M. A., & Yang, F. (2009) · Chromosome Research · doi:10.1007/s10577-009-9021-6 · Cited by 67
Multiple lineages of lice pass through the K–Pg boundary
Smith, V., Ford, T., Johnson, K. P., Johnson, P., Yoshizawa, K., & Light, J. E. (2011) · Biology Letters · doi:10.1098/rsbl.2011.0105 · Cited by 62
Stein, R. W., Brown, J. W., & Mooers, A. Ø. (2015) · Molecular Phylogenetics and Evolution · doi:10.1016/j.ympev.2015.06.005 · Cited by 62
Self-citationTaxonomic recommendations for Western Palearctic birds: 11th report
Sangster, G., Collinson, J. M., Crochet, P., Kirwan, G. M., Knox, A. G., Parkin, D. T., & Votier, S. C. (2015) · Ibis · doi:10.1111/ibi.12322 · Cited by 61
Phylogenetic relationships of the paraphyletic ‘caprimulgiform’ birds (nightjars and allies)
Mayr, G. (2009) · Journal of Zoological Systematics & Evolutionary Research · doi:10.1111/j.1439-0469.2009.00552.x · Cited by 61
Gibb, G. C., England, R., Hartig, G., McLenachan, P. A., Smith, B. L. T., McComish, B. J., Cooper, A., & Penny, D. (2015) · Genome Biology and Evolution · doi:10.1093/gbe/evv196 · Cited by 62
Eocene Diversification of Crown Group Rails (Aves: Gruiformes: Rallidae)
García–R, J. C., Gibb, G. C., & Trewick, S. A. (2014) · PLoS ONE · doi:10.1371/journal.pone.0109635 · Cited by 59
Widespread flower color convergence in Solanaceae via alternate biochemical pathways
Ng, J., & Smith, S. D. (2015) · New Phytologist · doi:10.1111/nph.13576 · Cited by 58
Dececchi, T. A., & Larsson, H. C. E. (2011) · PLoS ONE · doi:10.1371/journal.pone.0022292 · Cited by 56
“5 MYA, using fossils [106], and 130 MYA, using molecular dating [107].”
MethodMayr, G. (2013) · Systematics and Biodiversity · doi:10.1080/14772000.2013.765521 · Cited by 58
Scaling of Convex Hull Volume to Body Mass in Modern Primates, Non-Primate Mammals and Birds
Brassey, C., & Sellers, W. I. (2014) · PLoS ONE · doi:10.1371/journal.pone.0091691 · Cited by 58
A tree of geese: A phylogenomic perspective on the evolutionary history of True Geese
Ottenburghs, J., Megens, H., Kraus, R. H. S., Madsen, O., van Hooft, P., van Wieren, S. E., Crooijmans, R. P. M. A., Ydenberg, R. C., Groenen, M. A. M., & Prins, H. H. T. (2016) · Molecular Phylogenetics and Evolution · doi:10.1016/j.ympev.2016.05.021 · Cited by 59
Halliday, T. J. D., Upchurch, P., & Goswami, A. (2016) · Proceedings of the Royal Society B Biological Sciences · doi:10.1098/rspb.2015.3026 · Cited by 61
Beyond phylogeny: pelecaniform and ciconiiform birds, and long-term niche stability
Gibb, G. C., Kennedy, M., & Penny, D. (2013) · Molecular Phylogenetics and Evolution · doi:10.1016/j.ympev.2013.03.021 · Cited by 59
Diet and Diversification in the Evolution of Coral Reef Fishes
Lobato, F. L., Barneche, D. R., Siqueira, A. C., Liedke, A. M. R., Lindner, A., Pie, M. R., Bellwood, D. R., & Floeter, S. R. (2014) · PLoS ONE · doi:10.1371/journal.pone.0102094 · Cited by 56
Avian Emotions: Comparative Perspectives on Fear and Frustration
Papini, M. R., Penagos-Corzo, J. C., & Pérez-Acosta, A. M. (2019) · Frontiers in Psychology · doi:10.3389/fpsyg.2018.02707 · Cited by 58
A Machine Learning Method for Detecting Autocorrelation of Evolutionary Rates in Large Phylogenies
Tao, Q., Tamura, K., Battistuzzi, F. U., & Kumar, S. (2019) · Molecular Biology and Evolution · doi:10.1093/molbev/msz014 · Cited by 50
Linking the molecular evolution of avian beta (β) keratins to the evolution of feathers
Greenwold, M. J., & Sawyer, R. H. (2011) · Journal of Experimental Zoology Part B Molecular and Developmental Evolution · doi:10.1002/jez.b.21436 · Cited by 50
The smallest avian genomes are found in hummingbirds
Gregory, T. R., Andrews, C. B., McGuire, J. A., & Witt, C. C. (2009) · Proceedings of the Royal Society B Biological Sciences · doi:10.1098/rspb.2009.1004 · Cited by 51
Tsai, H. P., Middleton, K. M., Hutchinson, J. R., & Holliday, C. M. (2018) · Journal of Vertebrate Paleontology · doi:10.1080/02724634.2017.1427593 · Cited by 52
Multi-locus phylogenetic inference among New World vultures (Aves: Cathartidae)
Johnson, J. A., Brown, J. W., Fuchs, J., & Mindell, D. P. (2016) · Molecular Phylogenetics and Evolution · doi:10.1016/j.ympev.2016.08.025 · Cited by 54
Self-citationSmith, N. D. (2011) · Evolution · doi:10.1111/j.1558-5646.2011.01494.x · Cited by 49
Ksepka, D. T., & Phillips, M. J. (2015) · Annals of the Missouri Botanical Garden · doi:10.3417/2014032 · Cited by 46
Episodic Evolution and Adaptation of Chloroplast Genomes in Ancestral Grasses
Zhong, B., Yonezawa, T., Zhong, Y., & Hasegawa, M. (2009) · PLoS ONE · doi:10.1371/journal.pone.0005297 · Cited by 46
Low ecological disparity in Early Cretaceous birds
Mitchell, J. S., & Makovicky, P. J. (2014) · Proceedings of the Royal Society B Biological Sciences · doi:10.1098/rspb.2014.0608 · Cited by 45
Kimball, R. T., & Braun, E. L. (2014) · PeerJ · doi:10.7717/peerj.361 · Cited by 43
Fuchs, J., Pons, J., Liu, L., Ericson, P. G. P., Couloux, A., & Pasquet, É. (2013) · Molecular Phylogenetics and Evolution · doi:10.1016/j.ympev.2013.02.014 · Cited by 45
Sen, L., Fares, M. A., Liang, B., Gao, L., Wang, B., Wang, T., & Su, Y. (2011) · Biology Direct · doi:10.1186/1745-6150-6-29 · Cited by 46
Shultz, A. J., Baker, A. J., Hill, G. E., Nolan, P. M., & Edwards, S. V. (2016) · Ecology and Evolution · doi:10.1002/ece3.2444 · Cited by 47
JOHNSTON, P. (2011) · Zoological Journal of the Linnean Society · doi:10.1111/j.1096-3642.2011.00730.x · Cited by 45
Michelet, L., Carod, J.-F., Rakontondrazaka, M., Ma, L., Gay, F., & Dauga, C. (2010) · Molecular Phylogenetics and Evolution · doi:10.1016/j.ympev.2010.01.008 · Cited by 43
Leavitt, S. D., Esslinger, T. L., & Lumbsch, H. T. (2012) · American Journal of Botany · doi:10.3732/ajb.1200146 · Cited by 43
Metadata
- Authors
- Brown, J. W., Rest, J. S., García-Moreno, J., Sorenson, M. D., & Mindell, D. P.
- Affiliations
- University of Michigan (US)
- University of Chicago (US)
- Boston University (US)
- Corresponding author
- Brown, Joseph W
- Venue
- BMC Biology
- Published
- 2008-01-28
- Volume
- 6
- Issue
- 1
- Pages
- 6-6
- ISSN
- 1741-7007 (ISSN-L)
- PMC
- PMC2267772
- OpenAlex
- W2099180789
- Cited by
- 236
- References
- 117
- Citations by year
- 2026: 1 · 2025: 4 · 2024: 7 · 2023: 2 · 2022: 4 · 2021: 5 · 2020: 5 · 2019: 5 · 2018: 7 · 2017: 5 · 2016: 15 · 2015: 31 · 2014: 29 · 2013: 24 · 2012: 20
- FWCI
- 18.01
- Type
- journal article
- Language
- en
- Open access
- gold
- doi.org
- Licence
- Locations
- BMC Biology (publishedVersion, cc-by)
- Europe PMC (PubMed Central) (publishedVersion, cc-by)
- PubMed Central (publishedVersion, cc-by)
- PubMed (publishedVersion)
- Deep Blue (University of Michigan) (submittedVersion)
- DOAJ (DOAJ: Directory of Open Access Journals) (submittedVersion, cc-by-sa)
- OpenBU (Boston University) (submittedVersion, cc-by)
- Topics
- Physical Sciences › Earth and Planetary Sciences › Paleontology › Evolution and Paleontology Studies
- Physical Sciences › Earth and Planetary Sciences › Paleontology › Paleontology and Evolutionary Biology
- Life Sciences › Agricultural and Biological Sciences › Ecology, Evolution, Behavior and Systematics › Plant Diversity and Evolution
- Keywords
- avian evolution, mitochondrial DNA, K-Pg mass extinction, fossil calibration, relaxed molecular clock, topological uncertainty, avian phylogeny, Cenozoic diversification, fossil record bias
- MeSH terms
- Animals, Bayes Theorem, Birds, DNA, Mitochondrial, Fossils, Phylogeny, Genetic Variation, Evolution, Molecular, Genetic Speciation
About these checks
Registry, retraction, Cites and statistics results are computed, not judged, with one exception: a printed reference that no index lists is read once by a model before it counts as a citation error. Claims are extracted by a model and kept only when their quote appears verbatim in the text; each cited source is then checked, with a model’s help, for whether it says what the claim relies on. Those verdicts can be wrong — read the claim’s quote and the cited source before relying on one.
Statistics and arithmetic are recomputed, not judged.
Confidence bands are shown only for fields calibrated on our annotated test set. None is calibrated yet, so no band is shown.
What counts as a claim ›How we measure confidence ›How we check this ›
Are you an author, or do you see a problem with this page? Request a review
