

The DOI matches its Crossref record; 66 of the 67 references it cites were found in a registry or an index.
Human APOE4 increases microglia reactivity at Aβ plaques in a mouse model of Aβ deposition
Open accessAbstract
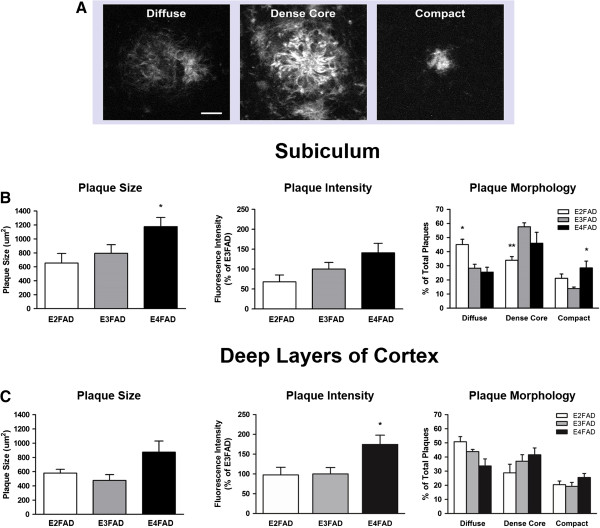
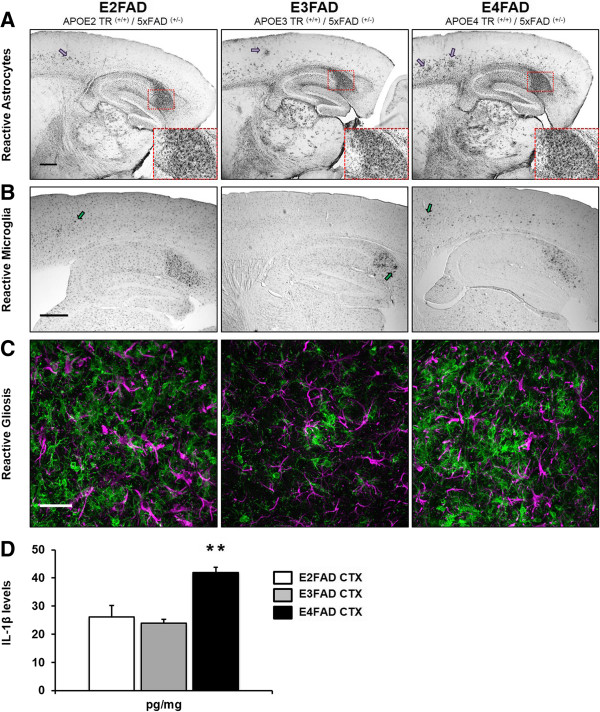
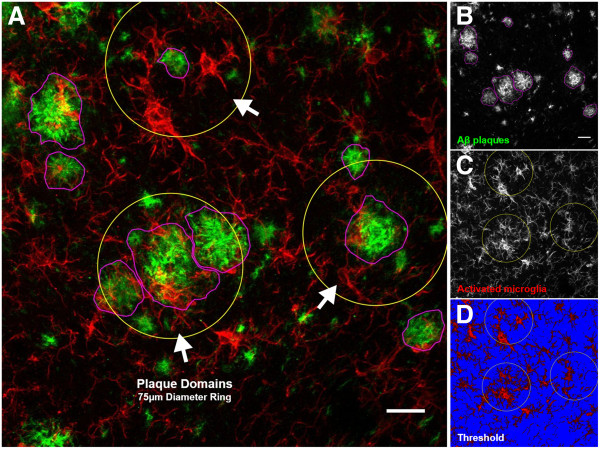
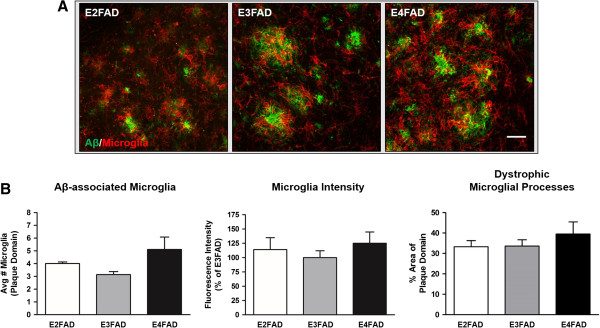
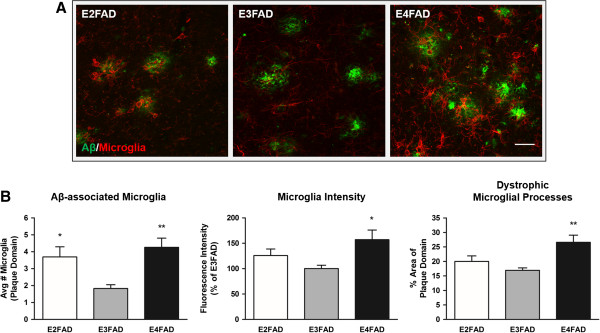
BACKGROUND: Having the apolipoprotein E4 (APOE-ϵ4) allele is the strongest genetic risk factor for the development of Alzheimer's disease (AD). Accumulation of amyloid beta (Aβ) in the brain is influenced by APOE genotype. Transgenic mice co-expressing five familial AD mutations (5xFAD) in the presence of human APOE alleles (ϵ2, ϵ3 or ϵ4) exhibit APOE genotype-specific differences in early Aβ accumulation, suggesting an interaction between APOE and AD pathology. Whether APOE genotype affects Aβ-plaque-associated neuroinflammation remains unclear. In the current study, we address the role of APOE genotype on Aβ-associated microglial reactivity in the EFAD transgenic mouse model. METHODS: We analyzed Aβ-induced glial activation in the brains of 6-month-old EFAD transgenic mice (E2FAD, E3FAD and E4FAD). Region-specific morphological profiles of Aβ plaques in EFAD brain sections were compared using immunofluorescence staining. We then determined the degree of glial activation in sites of Aβ deposition while comparing levels of the inflammatory cytokine Interleukin-1β (IL-1β) by ELISA. Finally, we quantified parameters of Aβ-associated microglial reactivity using double-stained EFAD brain sections. RESULTS: Characterization of Aβ plaques revealed there were larger and more intensely stained plaques in E4FAD mice relative to E2FAD and E3FAD mice. E4FAD mice also had a greater percentage of compact plaques in the subiculum than E3FAD mice. Reactive microglia and dystrophic astrocytes were prominent in EFAD brains, and primarily localized to two sites of significant Aβ deposition: the subiculum and deep layers of the cortex. Cortical levels of IL-1β were nearly twofold greater in E4FAD mice relative to E3FAD mice. To control for differences in levels of Aβ in the different EFAD mice, we analyzed the microglia within domains of specific Aβ deposits. Morphometric analyses revealed increased measures of microglial reactivity in E4FAD mice, including greater dystrophy, increased fluorescence intensity and a higher density of reactive cells surrounding cortical plaques, than in E3FAD mice. CONCLUSIONS: In addition to altering morphological profiles of Aβ deposition, APOE genotype influences Aβ-induced glial activation in the adult EFAD cortex. These data support a role for APOE in modulating Aβ-induced neuroinflammatory responses in AD progression, and support the use of EFAD mice as a suitable model for mechanistic studies of Aβ-associated neuroinflammation.
Overview
The claims and statistics of this paper haven’t been checked yet.
Run the check — free, no account needed. It reads the open-access text and checks the sources it cites.
Integrity signals
Registry
Cites
Statistics
Figures
Verification
Claims the paper makes
The claims and statistics of this paper haven’t been checked yet.
Run the check — free, no account needed. It reads the open-access text and checks the sources it cites.
Claims other papers make about this one
Each is checked against this paper’s own text: does it say what the citing paper says it does?
The source backs part of the claim, not all of it — or backs it for a different population, condition or comparison.
In the citing paper
“APOE4 has been associated with altered plaque morphology, greater fi brillar amyloid deposition, and enhanced plaque-associated microglialreactivity”
From APOE2 attenuates APOE4-associated amyloid pathology and related toxicity in a mouse model of Alzheimer’s disease (2026) · cites this paper as [51]
Experimental — accuracy not yet measuredThe source backs part of the claim, not all of it — or backs it for a different population, condition or comparison.
In the citing paper
“Recently, several studies have shown that APOE4 is associated with increased innate immune reactivity and enhanced cytokine secretion in primary microglia and peripheral macrophages in various animal models as well as human subjects [31–42].”
From 25-Hydroxycholesterol amplifies microglial IL-1β production in an apoE isoform-dependent manner (2020) · cites this paper as [34]
Experimental — accuracy not yet measuredThe cited source says what the claim attributes to it.
In the citing paper
“apoE4-expressing 5xFAD mice display higher levels of glial activation and the proinflammatory cytokine interleukin-1β (IL-1β) as well as larger and more intensely stained Aβ plaques than apoE3-expressing 5xFAD mice”
From ApoE4 reduction: An emerging and promising therapeutic strategy for Alzheimer's disease (2022) · cites this paper as Rodriguez et al 2014
The check wasn’t confident either way, so it gives no verdict — never disputed.
In the citing paper
“Nevertheless other studies have also reported that APOE2 expression is associated with similar or even higher plaque load than APOE3 (Rodriguez et al, 2014; Youmans et al, 2012; Bales et al, 2009; Dodart et al, 2005).”
From APOE from astrocytes restores Alzheimer’s Aβ-pathology and DAM-like responses in APOE deficient microglia (2024) · cites this paper as Rodriguez et al, 2014
Experimental — accuracy not yet measured
Self-check
Percentages, sums and reported differences re-computed from the paper’s own numbers.
The self-check needs the paper’s full text.
Citations
Cites
Fiji: an open-source platform for biological-image analysis
Schindelin, J., Arganda-Carreras, I., Frise, E., Kaynig, V., Longair, M., Pietzsch, T., Preibisch, S., Rueden, C., Saalfeld, S., Schmid, B., et al. (2012) · Nature Methods · doi:10.1038/nmeth.2019 · Cited by 66,890
The Amyloid Hypothesis of Alzheimer’s Disease: Progress and Problems on the Road to Therapeutics
Hardy, J., & Selkoe, D. J. (2002) · Science · doi:10.1126/science.1072994 · Cited by 13,864
The Mouse Brain in Stereotaxic Coordinates
Paxinos, G. (2001) · Cited by 12,859
Amyloid oligomers exacerbate tau pathology in a mouse model of tauopathy
Selenica, M.-L. B., Brownlow, M., Jimenez, J. P., Lee, D. C., Pena, G., Dickey, C. A., Gordon, M. N., & Morgan, D. (2013) · Neurodegenerative Diseases · doi:10.1159/000337230 · Cited by 10,359
Corder, E. H., Saunders, A. M., Strittmatter, W. J., Schmechel, D. E., Gaskell, P. C., Small, G. W., Roses, A. D., Haines, J. L., & Pericak-Vance, M. A. (1993) · Science · doi:10.1126/science.8346443 · Cited by 9,429
Strittmatter, W. J., Saunders, A. M., Schmechel, D., Pericak-Vance, M., Enghild, J., Salvesen, G. S., & Roses, A. D. (1993) · Proceedings of the National Academy of Sciences · doi:10.1073/pnas.90.5.1977 · Cited by 4,268
Association of apolipoprotein E allele ϵ4 with late‐onset familial and sporadic Alzheimer's disease
Saunders, A. M., Strittmatter, W. J., Schmechel, D., St. George-Hyslop, P. H., Pericak-Vance, M. A., Joo, S. H., Rosi, B. L., Gusella, J. F., Crapper-MacLachlan, D. R., Alberts, M. J., et al. (1993) · Neurology · doi:10.1212/wnl.43.8.1467 · Cited by 3,786
Oakley, H., Cole, S. L., Logan, S., Maus, E., Shao, P., Craft, J., Guillozet-Bongaarts, A., Ohno, M., Disterhoft, J., Van Eldik, L., et al. (2006) · The Journal of Neuroscience · doi:10.1523/jneurosci.1202-06.2006 · Cited by 3,530 · cited 4×
“Extracellular amyloid can be detected as early as 2 to 4 months of age in the subiculum and deep layers of the cortex [32,33].”
BackgroundInfluentialStaging of alzheimer's disease-related neurofibrillary changes
Braak, H., & Braak, E. (1995) · Neurobiology of Aging · doi:10.1016/0197-4580(95)00021-6 · Cited by 2,357
The role of apolipoprotein E in Alzheimer's disease
Kim, J., Basak, J. M., & Holtzman, D. M. (2009) · Neuron · doi:10.1016/j.neuron.2009.06.026 · Cited by 1,661
Cited by
Sorted by citations
Apolipoprotein E and Alzheimer disease: pathobiology and targeting strategies
Yamazaki, Y., Zhao, N., Caulfield, T. R., Liu, C.-C., & Bu, G. (2019) · Nature Reviews Neurology · doi:10.1038/s41582-019-0228-7 · Cited by 1,425
ApoE in Alzheimer’s disease: pathophysiology and therapeutic strategies
Raulin, A.-C., Doss, S. V., Trottier, Z. A., Ikezu, T. C., Bu, G., & Liu, C.-C. (2022) · Molecular Neurodegeneration · doi:10.1186/s13024-022-00574-4 · Cited by 756
Interplay between innate immunity and Alzheimer disease: APOE and TREM2 in the spotlight
Shi, Y., & Holtzman, D. M. (2018) · Nature Reviews Immunology · doi:10.1038/s41577-018-0051-1 · Cited by 595
Late onset Alzheimer’s disease genetics implicates microglial pathways in disease risk
Efthymiou, A. G., & Goate, A. M. (2017) · Molecular Neurodegeneration · doi:10.1186/s13024-017-0184-x · Cited by 562
Inflammation: the link between comorbidities, genetics, and Alzheimer’s disease
Newcombe, E. A., Camats-Perna, J., Silva, M. L., Valmas, N., Huat, T. J., & Medeiros, R. (2018) · Journal of Neuroinflammation · doi:10.1186/s12974-018-1313-3 · Cited by 532
Metadata
- Authors
- Rodriguez, G. A., Tai, L. M., LaDu, M. J., & Rebeck, G. W.
- Affiliations
- Georgetown University Medical Center (US)
- University of Illinois Chicago (US)
- Corresponding author
- Rebeck, G William
- Venue
- Journal of Neuroinflammation
- Published
- 2014-06-19
- Volume
- 11
- Issue
- 1
- Pages
- 111-111
- ISSN
- 1742-2094 (ISSN-L)
- PMC
- PMC4077554
- OpenAlex
- W2107281222
- Cited by
- 193
- References
- 67
- Citations by year
- 2026: 11 · 2025: 15 · 2024: 19 · 2023: 20 · 2022: 28 · 2021: 19 · 2020: 21 · 2019: 13 · 2018: 14 · 2017: 12 · 2016: 5 · 2015: 15 · 2014: 1
- FWCI
- 7.33
- Type
- journal article
- Language
- en
- Open access
- gold
- doi.org
- Licence
- cc-by
- Locations
- Journal of Neuroinflammation (publishedVersion, cc-by)
- PubMed Central (publishedVersion, cc-by)
- PubMed (publishedVersion)
- Funders
- National Institutes of Health (UL1TR000050)
- University of Illinois at Urbana-Champaign (UL1TR000050)
- University of Illinois at Chicago (UL1TR000050)
- National Institute on Aging (P01AG030128, R01AG035379, R01 AG035379-S)
- National Institute of Neurological Disorders and Stroke (T32 NS041218-S1, T32NS041218)
- National Center for Advancing Translational Sciences
- Office of the Vice Chancellor for Research, University of Illinois at Chicago
- Topics
- Life Sciences › Neuroscience › Cellular and Molecular Neuroscience › Alzheimer's disease research and treatments
- Life Sciences › Neuroscience › Neurology › Neuroinflammation and Neurodegeneration Mechanisms
- Life Sciences › Neuroscience › Neurology › Neurological Disease Mechanisms and Treatments
- Keywords
- APOE ε4, apolipoprotein E, Alzheimer's disease, amyloid plaques, microglial activation, neuroinflammation, 5xFAD mice, IL-1β, APOE genotype, plaque morphology, subiculum, glial activation, APOE ε3
- MeSH terms
- Alzheimer Disease, Animals, Cerebral Cortex, Disease Models, Animal, Gene Expression Regulation, Humans, Mice, Transgenic, Mutation, Amyloid beta-Peptides, Amyloid beta-Protein Precursor, Microglia, Microscopy, Confocal, Mice, Apolipoprotein E4, Interleukin-1beta, Presenilin-1, Plaque, Amyloid
About these checks
Registry, retraction, Cites and statistics results are computed, not judged, with one exception: a printed reference that no index lists is read once by a model before it counts as a citation error. Claims are extracted by a model and kept only when their quote appears verbatim in the text; each cited source is then checked, with a model’s help, for whether it says what the claim relies on. Those verdicts can be wrong — read the claim’s quote and the cited source before relying on one.
Statistics and arithmetic are recomputed, not judged.
Confidence bands are shown only for fields calibrated on our annotated test set. None is calibrated yet, so no band is shown.
What counts as a claim ›How we measure confidence ›How we check this ›
Are you an author, or do you see a problem with this page? Request a review
